Prepare for Short Squeeze! 6500->8000 in few minutes!Remember April 2018 when everyone have no hope in crypto and a lot of ppl said it will go down to 4k?
And people just build up short position along the way and it reach the ATH at 40k short position at Bitfinex...
What happen next is... they got rekt! and price of BTC jump from 6800 to 8000 in few minutes. ( I still remember that moment, I having dinner and got rekt alert from Bitmex Rekt bot. )
Well, this time it could happening too. Because when most people looking at the same way, whale ( or maybe us lol ) will do the opposite.
I think if the price can stay at 6500 + it will be very scary because it might jump real bad because of short liquidation chain reaction at bitmex.
I think a lot of big order are around 6500-6800 range and it can be rekt so easily.
Anyway, it might not happen but who know! Better prepare!
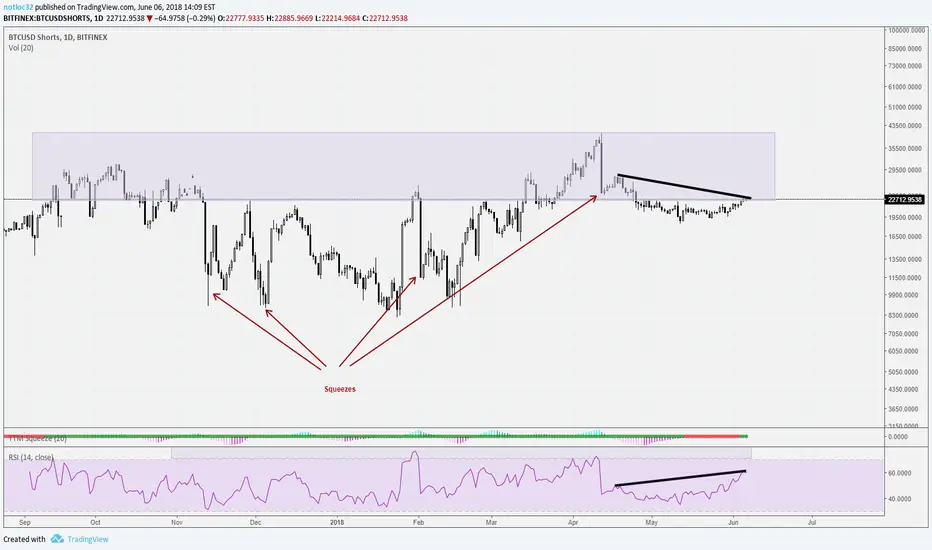
Squeeze

Falling Wedge Short Squeeze - $800 eoyshorts at ATH again.
you know what that means.
Falling wedge target ~ $800


GBTC- The Junior BTC ChartThis chart squeeze will soon lead to a chart POP. Whether the price will go up or down is anyone's guess. All I know is if you believe in crypto and want an alt trade to the crypto craze you may have found your window of opportunity. If you own no stake in this stock you may want to initiate your investment tomorrow, and built your stake from there.

Is TDOC a takeover target of AMZN?For all fundamental reasons the success of Teladoc is noble but you can see from this accumulation/distribution chart that someone is heavily accumulating the stock. There are multitude of reasons this could be happening. One super exciting and others very typical of trading in growth companies.
So let's start with my far flung idea. Amazon is pushing aggressively to get into the healthcare space. There was talks of Amazon buying a large insurance provider such as Aetna. A much more reasonable acquisition, and one that would be the perfect fit to stair-step them into the space is Teladoc. Teladoc conducts medical exams entirely online and over the phone. They boast almost 20 million customer accounts around the world and have an opportunity in the U.S. alone to do at least 75 times their current volume of consultations. What better place for people to find that than the Wal-mart of the online world. Amazon. For that matter if Wal-mart took notice they would also be a suitor.
Catalyst 2: Short interest. For a long time short traders were rooting for Teladoc to fail because they were spending heavy to acquire competitors and pushing growth over all else. Well those bets have not paid off at all. As a matter of fake with an estimated 38% of the float short we could see a short squeeze for the record books playing out before our eyes.
Catalyst 3: The future prospects for TDOC without it being sold. Even with no buyer TDOC has grown over 100% this year with their own internal marketing push and the acquisition of their second biggest competitor. They are insurmountably the leader of the pack in tele-medicine. They are the uber of doctors if you will. They are in the critical mass stage. Twenty million customers turns into 50 million real fast when people start to tell their friends how their doctors 'visit' fell from $160 to $40. There is no doubting it is a disruption of the mega status quo and several of those companies have gone on to be worth 60-100 billion dollars. That is a 30x-50x from today's 3.8 billion dollar value.
*** These opinions are my own and not meant to be financial advice. I am currently long TDOC calls.


SALT/BTC 4h - Aggressive EntryThis is my aggressive entry point for SALT. It has bullish divergence and is squeezing on the daily.

BTCUSD: Break Of Bearish Trend Line Means Bulls Taking Control.BTCUSD update: Inside bar formation leads to price spike into the 6431 to 6614 resistance zone. This should not be that surprising if you have been following my recent articles on S.C. and on here. The bearish trend line which was compromised in this move is the first confirmation that a broader bullish move is in progress.
It all started with the pin bar 8 days ago. I wrote about the significance of it's size and location. The 6431 to 6614 resistance happens to be a minor .618 zone relative to the recent 6850 high. The simultaneous break of this zone and bearish trend line are significant signs of strength.
As I wrote in my S.C. article earlier today, the shallow higher low which has been established by the inside bar, is a riskier location for a swing trade. Our plan is to wait for the next retrace in order to enter a swing trade long.
An attractive location for a setup would be the 6126 to 5977 support zone (.618 of current bullish swing). In light of the probability of this broader area, we are anticipating a higher low formation rather than a retest of the lows on the next pull back.
The mistake to avoid is to chase this market now. Even though it has potential on the bigger picture, the risk of retrace increases as it climbs. At S.C. we have been writing about accumulating inventory for weeks across all of these coins. As this market bottoms, we are in a general position to benefit, whether we catch the smaller individual trades or not. And that is the whole point of employing strategies across multiple time horizons.
In summary, do not worry if you missed this squeeze. As I wrote on S.C., opportunities are infinite but at the same time infrequent. Patience is your best friend in these markets. One of the most valuable skills you can develop as a trader is the ability to wait.
If a broader move higher is truely in progress, there will be more opportunities to get long that offer much better reward/risk. The next retrace will be a very important test for this market. Prepare for it now rather than fretting over the movement that has resulted from signs that appeared days ago.

BTC: short squeeze soon possibleHi,
a quick update, since BTC is doint it's boring thing again.
However, interestingly, we have now a similar situation as in early April. The shorts are rising more and more, and will soon be higher than the longs.
In this case, I think we'll see a nice short squeeze, as in April.
I'll keep a close eye on the long/short ratio at Bitfinex. The indicators are otherwise oversold on one week and three days, which coould indeed mean that we'll see short term pumps up to 10k.
And then when everyone is hoping for the bullmarket again, and longs are high again, BTC will probably brutally destroy all hopes and dreams and continue with the bearmarket till 2019, hehe.

Litecoin Short Squeeze Incoming?BITFINEX:LTCUSDSHORTS
Litecoin Short Squeeze incoming or further into over bought conditions?
Analysis: Double top in progress with TD Sequential passing a 9.
Level to watch: 136,000
Prediction: Shorts about to get wrecked.

Possible short term trade / short squeezeShorts are ramping up again and a squeeze could be in order. Keep in mind this is a counter trend trade so don't expect this to go beyond previous highs.
What I would suggest is look for an entry in the 397 to 414 range and aim for 580 as profit target.
This is a high risk trade.
Other indicators are also looking ready for a squeeze, it could take another 1 to 3 days before there is enough build up selling pressure to squeeze.
-RSI is almost below 30, aiming for 25-26 ish.
- Up trend line is in the 400 area
- MACD bearish
- Buyers have left the space looking at the DMI, needs a bit more selling pressure. It's currently at a 9.1 (green line) and would like to see it at 7.8 or 8.
- Shorts are high.
This is no exact science and lots of selling pressure could send us tumbling through the uptrend line etc, because we are still in a bear trend. So instead of placing limit orders right now and hoping for the best, it probably is a good idea to set an alarm at $432 ETH and look at the price action from there. If you see buyers returning on a smaller timeframe (1H for example) then a swing trade long could be in place. Be careful out there ;)

EOS greed - short squeeze might happenShorters are too greedy in EOS. EOS dropped 30% in the last 24h and too many traders are still thinking it's an easy trade to short EOS. But they forget to watch EOSUSD SHORTS chart. This chart says that EOS shorts are still builing up, but shorters are not able to push the price lower anymore. That's the same situation that happened to BTC on 12th april 2018. When shorts are accumulating at the same price level, if bulls manage to push the price higher in a green pump, shorters will start to close their positions. And when there are many short positions on the same price level, this results in a massive "short squeeze".
Of course don't forget that shorts building up and price not moving down is not a guaranteed indicator that price will go up. Bears can still win and push the price down in the end and close their positions normally. But.. if bulls manage to make a push, it's a very bad situation for the bears, as all of the will start closing their shorts together (= buying).
BTC shorts are also on a rise, with BTC daily RSI touching oversold level, history shows that we always had a rally after that. This is a good time for long EOS position imho. If you're not sure about that, just wait for the squeeze pump to enter. Also EOSBTC is in support zone atm (0.00160 - 0.00167).

SGYP Is Setting Up for A Big Move!SGYP seems to be setting up for a big big move. The Squeeze Momentum Indicator has been forming a triangle which is now about to close and the crosses in the indicator have been black for some time meaning that a release of the squeeze should be about to manifest. My guess is that spike will be to the upside, and it could go as high as 3.60$ (90%+ appreciation), which is the 0.382 retracement level of 17's highs and the 1.618 retracement level of this year's highs.

Fat cup and handle (C&H) on ZRX on the 12hrLooks like 0x ZRX is going to pop out of the triangle in the coming days. Looking for it to bounce up and test .000215 sats, then retrace down to .000195 range before continuing past resistance.
20 day EMA looking positive still for the run.
**Full Disclosure**
I'm not a pro trader, just going off of what I've been learning the past few months. Definitely not financial advice, do your own research. Any feedback is appreciated.
BINANCE:ZRXBTC

$RUN seems to be ready for another leg upImpressive relative strength today on $RUN.
Broke out of consolidation on strong volume. Short interest of 18% might help to squeeze a little.

$SHAK looks like it might confirm breakoutSHAK had a breakout on strong volume two days ago and looks like it could leg up from here.
Yesterday the consolidation zone was retestet - close today will be interesting.
High short interest of 40%+

$WBAI breakout on decent volumeInteresting looking chart with rising volume the last few days.
Might be shorts covering - short interest is high with 20% and might go in squeeze mode since it´s a small cap with relatively low liquidity.
Round bottom looks nice as well as the double bottom (almost.. more if you think of aa supportzone than the previous low)

XLM (Stellar Lumen) is in a squeeze and might POP!XLM (Stellar Lumen) is in a squeeze and might POP!

Why BTC fractals are not always trustworthyHello!
In this chart I'd like to show that you can find nice fractals everywhere, because fundamentally markets are driven by human mass psychology and since this mass psychology doesn't change, the patterns also repeat.
But are they always to be trusted? No. One has to look at a lot of different factors and check if the situation now is similar to the situation of the comparison fractal.
In our case here, many people expect a nice pump like the one in the beginning of april.
However, even though the pattern before the pump looks very similar, the market conditions now are quite different.
One has to realize, that whales play the market in order to make nice profit with leveraged longs and shorts. It is very easy if you have a lot of coins. You look at the ratio longs vs shorts. If for example one is much higher than the other, i.e. shorts much highter than longs,
you can create a short squeeze, with one strong buy. This triggers a cascade of shorts that are closed, forcing the price higher, closing even more shorts, a short squeeze. Those whales wentl leveraged long before that, and made some nice profit, and sell their coins alter for
a higher price, because the ensuing FOMO drives the price even higher. A win win for them.
However, as you can see, now the situation is quite different. Leveraged shorts are much lower, in fact, the longs are much highter than the shorts. This means that one should not count on a short squeeze like the one beginning of April.
From looking at the overbought 4 hour and 1 day stoch RSI, a declining price is more likely. I say more likely, because one can only speak in probabilities here. I give a 70% chance that we grind down, and a 30% chance that we still go up, despite high longs.
When trading BTC, it is always good to look at the long/short ratio, because then you have a good overview of the general market sentiment, which is more bullish than bearish now. And most of the time it is good to do the opposite of what most people do, hehe XD.
Since I like doing the opposite of most people, I have a moderate short position open atm.