VIRTUAL – Major Confluence ZoneEntry into 3D S/R and Demand Zone (Blue Box)
The current price action is testing a key 3D support/resistance level, which aligns with a historical demand zone.
Multiple diagonal supports converge here, making it a high-probability zone for a reaction.
Accumulation & Reversal Play
The setup suggests that this zone is ideal for building a position.
Expect potential wicks/spikes into the lower blue zone, hunting liquidity before a reversal.
If price holds above ~$1.40 (blue line), look for signs of strength (bullish candles, reclaim of lost support).
Upside Targets
If the zone holds, the first target is the prior local highs ($2.00–2.05).
Further targets are the overhead supply zones (highlighted in red), especially if the momentum persists.
Invalidation
A daily close below $1.40 or sustained trading below the lower blue box invalidates the setup and signals a risk-off environment.
Sr

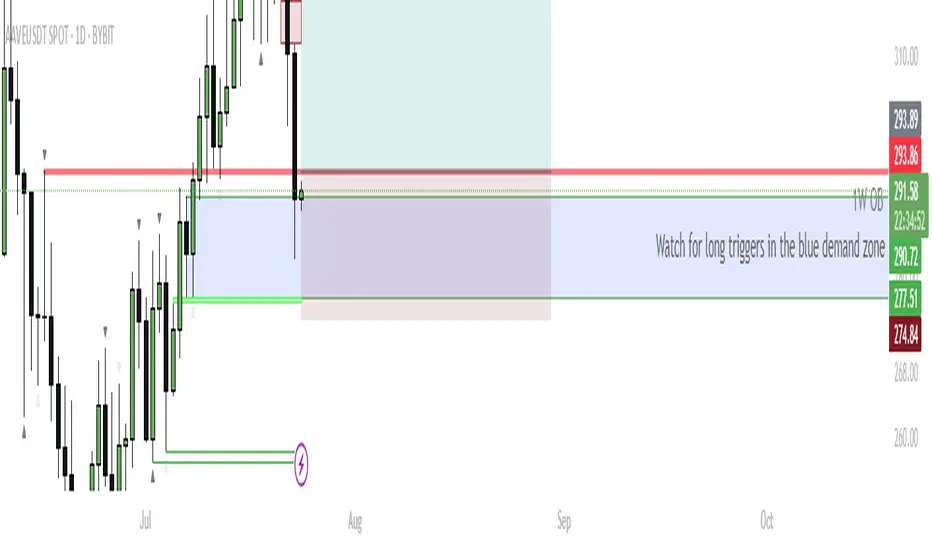
AAVE – Eyeing Reversal From Daily Demand for $400 TargetCurrent Structure:
AAVE recently rejected from 1M S/R at $332.54 and pulled back into a confluence support zone—overlapping 1W order block (OB), 1D OB, and previous resistance now flipped support ($277–$290 zone, marked blue).
Buy Zone:
Watching the blue box area for bullish reversal triggers. This is a high-probability demand zone due to multiple timeframe confluence.
Trigger:
Wait for a bullish reaction/candle confirmation inside the blue zone. Ideal scenario: bullish engulfing, sweep of the low and reclaim, or a strong bounce with rising volume.
Targets:
Primary upside target: retest of the 1M S/R at $332, then continuation toward $400 if momentum sustains.
Invalidation:
If price closes below the 1D OB ($274.84), long setup is invalidated—risk of further downside increases.
AAVE is testing a major support confluence zone, combining weekly and daily order blocks. This area previously acted as resistance and now presents a strong demand zone. If bulls defend this zone and trigger a reversal, there’s a clear runway back to previous highs and potentially $400. This setup offers a favorable risk/reward profile with tight invalidation.
PEPE – Highest Weekly Close in 6 Months: Eyes on New HighsMajor Breakout Level:
Last week’s candle closed above the 1W S/R (~0.000013845), marking the highest weekly close in half a year.
Bullish Structure:
Price reclaimed and closed above a crucial weekly resistance. This flips the structure bullish, increasing odds of continuation.
Next Targets:
Immediate resistance lies near the 1M S/R (around 0.000020193–0.000020272). Break and close above opens way toward the 1.27–1.618 Fib extensions (0.000029793+).
Invalidation:
Failure to hold above the 1W S/R and a weekly close back below (~0.000013845) would invalidate the breakout, putting risk back toward mid-range support (0.000009697).
The weekly close above key resistance signals strong buyer interest and market acceptance of higher prices, especially after a multi-month consolidation. This “highest close in 6 months” is a classic trend continuation setup. The next natural target is the higher time frame resistance (1M S/R), with Fibs aligning to previous price action. Failure to hold the breakout level would suggest a failed move and likely mean-reversion.

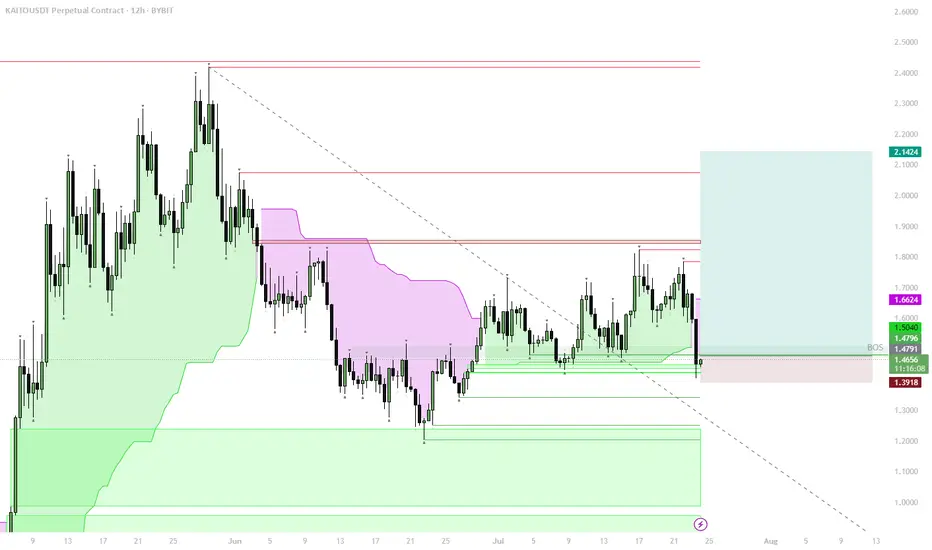
KAITO – Structural Flip, Bullish Accumulation ZoneStructural Shift:
Price reclaimed the key 1D S/R + BOS (Break of Structure) level, signaling a major trend change from bearish to bullish.
Trend Confirmation:
The move above $1.48–$1.50 zone confirms a bullish market structure. This level is now strong support.
Accumulation Opportunity:
The area between $1.65–$1.50 is ideal for spot accumulation, as it aligns with the reclaimed BOS and the lower edge of the bullish structure.
Upside Targets:
If the bullish structure holds, price could target $1.66 (local resistance), with the next targets at $1.85, $2.14, and potentially higher if momentum continues.
Invalidation:
A break and close below $1.48 would invalidate this bullish scenario and signal a return to the previous range.
The reclaim of the BOS level, with a shift above 1D S/R, marks a clear bullish structural flip on the chart. Historically, such shifts create strong accumulation zones just above the reclaimed level, where risk/reward is best for spot buys. Buying into the $1.65–$1.50 range aligns with both trend-following and classic Smart Money concepts: enter after the structural confirmation, not before. Invalidation is clear below $1.48, where structure would flip bearish again.
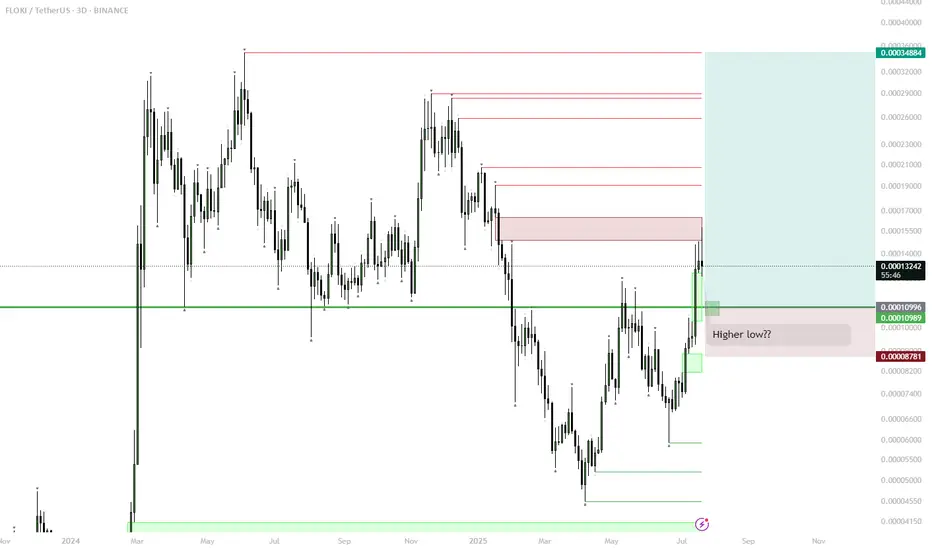
FLOKI – Range Low Setup for Next Big Move? (1D Plan)
FLOKI has reclaimed the key horizontal support, forming a possible higher low.
Currently watching the green box/range low for signs of accumulation (sideways price action) and support confirmation.
If FLOKI establishes a range or shows strength at this zone, look for a long entry with stop below the range.
Upside target is the range high and previous major resistance, offering a potential ~180% move.
Invalidation: clear breakdown and close below the green zone signals failed setup.
FLOKI is showing classic bottoming structure: reclaim of support and formation of a higher low after a prolonged downtrend. Range lows historically have provided major entries for explosive moves. If the green box zone acts as accumulation and price holds, it could set the stage for a rally back to the top of the range as seen before. This setup is favored in meme/altcoin cycles, especially when market sentiment improves. Risk is defined, reward is high.
PUMP Trend Reversal – Testing 1H Supply FlipStep-by-step Price Scenario:
Price has broken the local downtrend and reclaimed the 1H supply zone, showing LTF strength.
Look for acceptance above 0.00445–0.00452 green zone for confirmation of the reversal.
If price holds above this zone, expect a move toward the next supply levels at 0.0048, then 0.0050, and 0.0054.
If price loses the green zone (close below 0.00436), scenario is invalidated—look for a retest of the previous lows near 0.00394.
Reasoning:
After a strong local downtrend, price has started to show reversal signs with a clear break and reclaim of the 1H supply zone. This area previously acted as resistance and now flipped to support, signaling the potential for a short-term rally. If buyers manage to hold above this new support, it would confirm the strength of the reversal and open up the path to test the next local supply zones above. However, failure to hold the reclaimed level (close below 0.00436) would invalidate this scenario and suggest the downtrend may continue. This setup is based on a classical supply/demand flip and early signs of bullish momentum on lower timeframes.

SEI — Breakout & D1 OB Target1. Support 0.33–0.36 holding
2. Entry after SR breakout
3. Target: D1 OB 0.47–0.54
4. Stop below 0.33

JTO — 1D Trend Breakout & MSS Hold1. Buy zone: 1.86–1.95 (hold above 1D S/R + MSS)
2. Entry: after trend breakout + MSS confirmation
3. Target: FVGs above, full tp 2.78
4. Stop: below 1.76

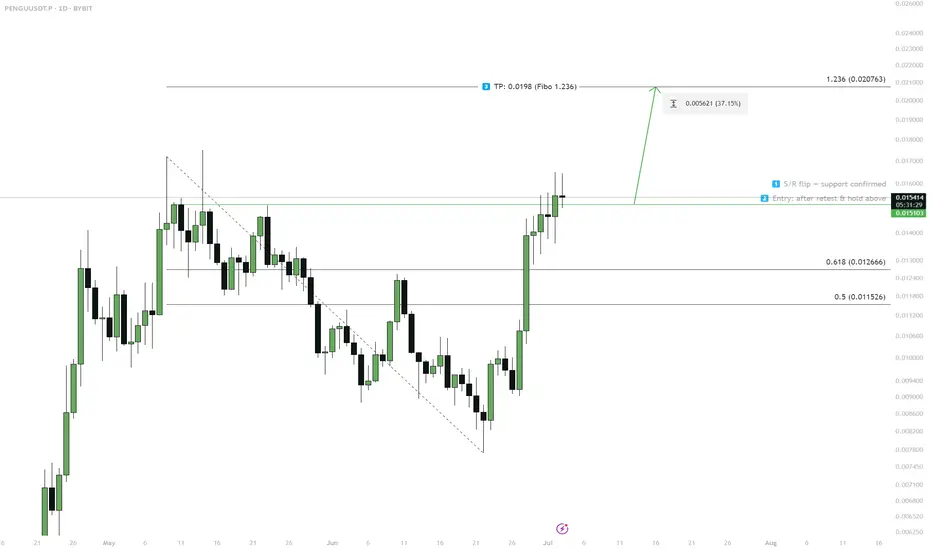
PENGU — S/R Flip & Breakout Scenario1. S/R flip at 0.0151 — wait for retest
2. Enter on successful hold above 0.0151
3. Target: 0.0198 (Fibo 1.236)
4. If fails to hold above 0.0151 — scenario invalid
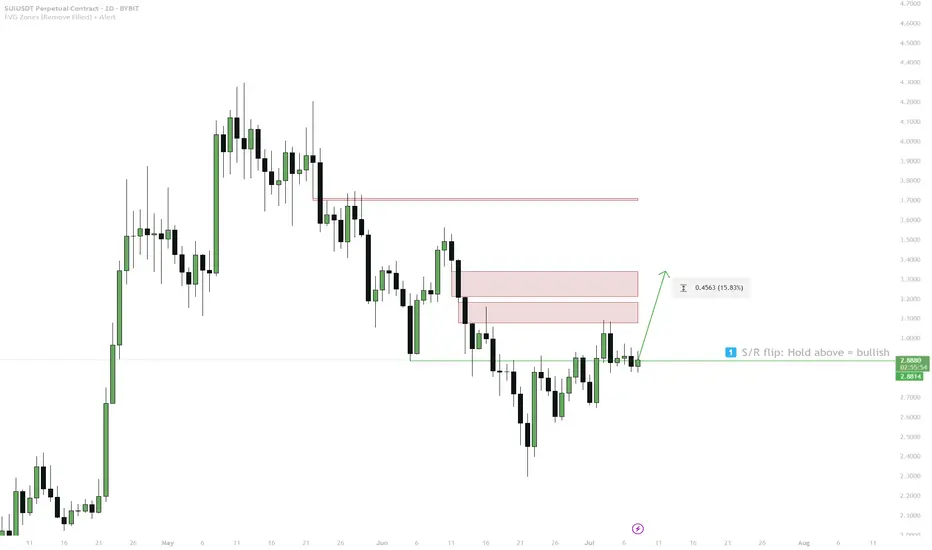
SUI — 1D S/R Flip & FVG Target1. Hold above 1D S/R + BOS (blue box) = bullish bias
2. Entry: Only long above blue box
3. Target: 3.32 (FVG)
4. Stop: Below blue box = invalid
EURUSD 26/8/24Coming into this week, we maintained a very clear bullish directional bias that we identified last week in our analysis. We do not expect this bias to change suddenly. You can see in our chart that we have a straightforward idea, which is a continuation of the trend from the similar trajectory we established last week. However, if the price sells off, giving us a significant pullback within the higher time frame range, it could change the outlook. If we take out the low marked on our chart, it will indicate a higher probability of a move toward lower prices, taking us down into the higher time frame area of demand.
We’ve only marked one order block within our current range because it’s the only one available. Any other order blocks on the sell side will need to be created before we can consider them, which is why they are not included in this week’s analysis. Overall, our bias is long, and we’re looking for an interaction with either the established trajectory or the area of demand just below it. If we break down out of this range, we’ll look for lower prices, and our bias will shift to short-term bearish. However, our daily time frame still shows a clear bullish momentum, and we aim to follow this.
Trade safely, stick to your risk management, and always follow your plan.

NEARUSDT can ascend further!Hi.
BINANCE:NEARUSDT
😊Today, I want to analyze NEAR for you in a WEEKLY time frame so that we can have a Mid-term view of NEAR regarding the technical analysis. (Please ✌️respectfully✌️share if you have a different opinion from me or other analysts).
NEAR is testing the s/r zone on weekly timeframe🤔
✅ Due to the Ascending structure of the chart...
- High potential areas are clear in the chart.
Stay awesome my friends.
_ _ _ _ _ _ _ _ _ _ _ _ _ _ _ _ _ _ _ _ _ _ _ _ _ _ _ _ _ _ _ _ _
✅Thank you, and for more ideas, hit ❤️Like❤️ and 🌟Follow🌟!
⚠️Things can change...
The markets are always changing and even with all these signals, the market changes tend to be strong and fast!!

short trade entryconfluences:
overall market dump
bearish pivot
s/r flip
bearish .618
bearish break of structure
exits:
range POC
LIQ HUNT
expecting a HNS/choch after reaching ote zone

EURCAD 1.38 incoming!!EURCAD has respected the previous SR zone of 1.46 and is now moving back down to the 1.38 zone, the move should be clean and fast.

Baltic Dry Index drops to 2020 levelsCoinciding with talks of recession, the Baltic Dry Index (which can be thought of as the cost of international shipping of primary goods and so an economic indicator) is approaching the lows seen during 2020. With a 60% drop left to the 1D Cosmic Channel Lite support and Cosmic Markers Lite not yet flashing the strongest support signals the prognosis is bearish with a potential reversal at 270.

META neutral near Cosmic Bands top1D price rose close to the max Cosmic Bands resistance, potentially forming a new Cosmic BB SR level. Statistically this would be a point of reversal but max resistance has not been reached on higher timeframes and it may be a good idea to wait for bearish confirmation.

SPX at overlapping resistanceSPX price has risen to high-maximum resistance on multiple timeframes while showing few bullish signs, suggesting a drop is likely. The short target is set at the extrapolated 1W Cosmic Gravity resistance channel top.

Bitcoin above $70k resistance levelThe neat thing about Cosmic Flow is that is lets you use one MA period for the resistance and another one for the support. Here we used the HMA with 50 bar resistance and 100 bar support to recognize a repeating pattern on the 1W chart, in combination with the Cosmic BB SR indicator. While these two indicators show that the price is now more bullish than it was during the last $70k top in November 2021, the Cosmic Angle indicator is still showing a significant negative trajectory and is changing its angle at a very slow pace. This information suggests two likely effects: 1) a large and sudden bullish movement 2) a gradual reversion to the Cosmic Flow basis line.

Coal futures 1M short forecastWhile according to the 1D signal the price should reverse back up, the other timeframes suggest that the bearish trend may continue at least until the Cosmic Bands S1 line, where the short target is set.

Copper Futures above BB SR resistanceThe chart points paint a bullish picture although the price is just above support levels on the 1M and 1D timeframes. The long target is set at the next extrapolated 1M resistance and the stop at the 1D basis line.

USDJPY 1D neat forecastingBy combining the levels show by the 2 indicators Cosmic Flow and Cosmic BB SR it is possible to forecast the amount the price will drop (or rise) as shown with the vertical red arrows. The price is currently at a level it consecutively tested twice and were it to drop further a rough estimate for a short target using the current trajectory would be in the $125-126 region.

DXY major overlapping support targetThe 6h, 1h, and 15 minute timeframes show the next concentrated support to be at $100.7 (thick red line), while the next minor 1D timeframe support lies at $100.1. The price hovering below the current 6 hour Cosmic BB SR support suggests further downward momentum.

NZDUSDIn this market, I see 2 suitable positions to enter, which I have explained in the chart.
It is better to wait for a suitable entry trigger in the lower time frame (H4 / H1) in the ranges I have specified for entry, then enter the position.
Of course, there is no certainty in any analysis and these signs help us to increase the winning percentage of our transactions.
