USDJPY - Yearly Snapshot of Weekly Support ResistanceUSDJPY Snapshot of Support and Resistance on Weekly Timeframes over past year.
Some of the Support and Resistance lines have old historical price action pre 2016*.
Resistance
117.178
117.609
118.185
120.662 *
Support
116.058
115.209
114.757
110.915
Sr

GBPUSD - Snapshot of Past Year - Weekly S/RGBPUSD - Snapshot of Past Year - Weekly S/R
Weekly snapshot of the past year via Weekly Support & Resistance.
Resistance
1.22722
1.24317
1.24964
1.27274
Support
1.2080
1.12052

EURUSD - Historical Support Resistance from 4 Hour Chart1.05873 Present Price . 6:48pm January 9
Resistances
1.06127 January 5,6 2017
1.06492
1.06866
1.08623
Supports
1.05245
1.04669
1.03692

EURUSD - A Few Historical Support and Resistance Zones - Daily1.05848
Resistances
*1.06127* on the 4 hour chart, January 5 & 6.
1.06492
1.06866
1.08623
Supports
1.05245
1.04669
1.03692

EURUSD - Weekly Historical Support Resistance from 3/9/15Weekly Support and Resistance going back to March 3 2015.
1.05873 - Price Present
Prices Approximated
Resistance
1.06537 - December 26 2016
1.06866 - November 23 2015
1.08623 - December 5 2016 (sorta, maybe)
1.09887 - October 24 2016 (long historical area of S/R going back to March 2015)
1.12935 - November 7 2016 (historical S/R back to February 2015)
1.14445 - May 9 2016 (1.14238 June 20 2016)
Support
1.05245 - November 21 2016
1.04666 - Old low March 3 2015
1.03693 - December 26 2016
1.03406 - All Time Low January 2 2017


GBPAUD At neckline -> buyPrice is around the neck line level (H&S).
I'm kooking to get into a buy trade once it breaks the trend resistance as well

GBPCHFThe pair is at a major SR zone, on the daily there's good buying rejection. If price breaks the structure, take a short trade till around S2 pivot.

NZDUSD Short on breakThis pair is at R3 pivot and major SR area, showing signs, once again, of slowing. If this time it does break the structure. Take this short position.
Good trading all

NZDJPY Short on breakoutThere's been a good run up following the structure, at this area it looks like it could reverse. Plenty of room to the left and the daily shows buying rejection at this SR area.
Go short on the break of this structure

USDCHF Break of structure -> shortThe daily shows slow down and reversal signals. On the break of this structure on the 60 min chart, take a short position till around the weekly pivot level

EURGBP Buy Daily shows signs of reversing on support. If structure breaks, go long.
Good trading all!

GBPAUD confluence of resistance -> sellPrice is around major support resistance and its near a major trend line. short as seen on the chart.
Be aware of some GBP news tomorrow.
Good trading all!

AUDNZD buy on support1) 6 hour candle will close with a long wick indicating buying is strong
2) On the weekly buyers look to be stronger as well, with bounces off the green trend line.
3) Price is probably going for the 1.075 price zone where it bounced off several times now
Enter on the 0.5 fib level of this 6 hour candle
Good trading all!

EURUSD Short on the way next weekQuite the shooting star on the last 12 hour candle, Monday it's likely going to retrace a bit and then I'm looking to get in around the 0.5 Fib of the last daily candle.
There's USD CPI news on Tuesday that you need to be careful of when entering.
Good trading all next week!

EURAUD buy on major support level1.45 level has held many times this year and judging by price action on the 12 hour chart it seems selling has met with quite some resistance. There's a good RR trade here till fib extension 2.618 for a 1:3
Good trading all!

NZDUSD buy on retracement12 hour and daily candles show good selling rejection on major SR area indicating good probabilities for a reversal.
Enter on the 0.5 fib retracement of the daily candle till fib extension level 2.272
Good trading all!

EURAUD Shooting star -> SellSee 12 hour chart, shooting star formed on major SR area, good probability short setup here.

USDJPY Buy correlation trade GBPJPYThis buy is correlated to the pound yen buy on support.
Be aware of NFP at the end of the week

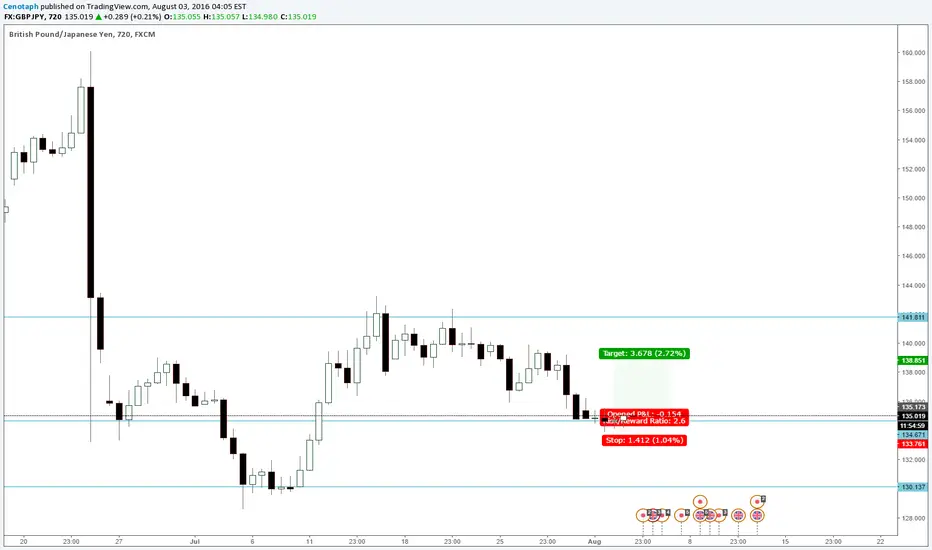
GBPJPY Buy on supportSupport is holding and the wicks suggest selling has stalled and a reversal is highly probable.
Enter as shown, be aware of BOE news tomorrow midday, which in all cases so far after Brexit have resulted in a short for this pair.
Let's see where this can go in 24 hours time.
eurusd buy on higher highThe last 12 hour candle didn't manage to break support, current candle shows continued buying. If we get a higher high later today or probably tomorrow, enter for a good 1:2.4 RR trade.
Be aware of USD news this week for increased volatility, particularly NFP on Friday.

usdchf buying opportunity coming weekThe last 12 hour candle from Friday has quite the long wick showing strong selling rejection.
Possible buying opportunity can occur early coming week. Shown entry is an estimate of a trade I could take.
Keep an eye out and be aware of USD news.

USDJPY SHORT OPPORTUNITY H1As you can see, there will be a correction on USDJPY should go up to the trendline and resistance level, enter with a good candlestick pattern and then price should make lower low even to the demand zone around 104.170.
Entry - 105.250
SL - 105.770 (52 pips)
TP - 104.200 (105 pips)
Good Luck !
