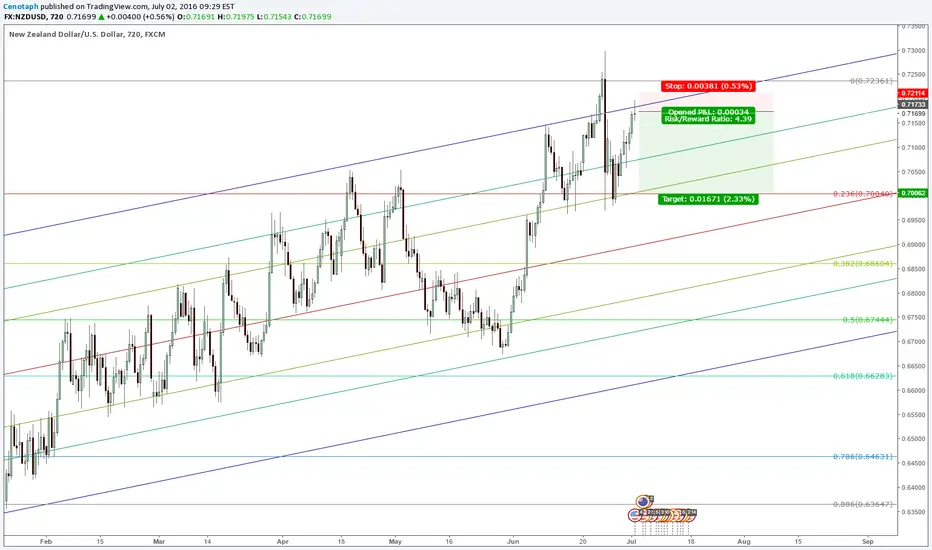
NZDUSD Buy on Higher High1) Trend since this year is bullish and has followed pitchfork to median consistently. Reversal to median is highly likely (historically)
2) On higher high the move up is highly probable
3) Candles printing some selling rejection at major SR zone. Reversal can happen.
Enter a buy order on higher high, This can take time to form(!).
Be aware of lots of USD news this week!
Sr

GBPJPY Short1) Weekly chart indicates short on the horizon
2) Pitchfork drawn on major swing points indicate a bear triangle formed on support. Wait for this break.
3) Move to median is highly probable.
Enter on lower low to catch the break of the triangle somewhere this week.
Be aware of the BOJ news on the 29th (Friday) that can seriously move this pair!

USDCAD Buy after retracement1) Bull Triangle forming on major price level 1.312
2) Pitchfork suggest more up movement expected (reversal to median)
3) Wait for reversal around 1.3 price level for a good entry to long (see coming week how this develops)
The sign are go for a bullish move somewhere next week or the week after. It looks to reverse around the SR zone first, so wait for a better entry to buy.
Be aware of USD news and CAD news coming week.
Good trading all!

AUDCHF Short at break of structure1) On the weekly chart a nice shooting star candle
2) Break of this upward structure (green line up), is likely a start of bearish move
3) pitchfork indicates we likely see a move towards the median line again
4) This pair is strongly correlated with other other AUD pairs (see related idea), also indicating downward movement is highly probable.
You can enter aggressively as shown on this chart, or a more conservative entry would be just below the consolidation area around 0.736.
Be aware of the Fibonacci levels for possible take profits.

AUDUSD Short on break of structure1) Weekly chart shows a clear reversal bar
2) The pitchfork drawn (swing high low) with the median along the trend indicates further down movement for the this pair and high probability movement towards median line (red)
3) Bears still look to dominate at price 0.747.Support Resistance area
4) If price breaks structure support (green line), continued down movement follows till next support is likely.
Enter at break of structure support and keep in mind the price levels indicated with the blue lines


USDCAD Long opportunity setting upNext week this pair looks to develop into a long trade, there are signs of slowed movement down that can indicate a reversal at this fib level.
Let's see half way next week if this will go in a move to break that 1.308 price level
Good trading all!

NZDUSD Early Reversal signs showingEarly reversal signs are showing with a pinbar on a major area. I will be looking for a short opportunity to happen somewhere next week around Tuesday/Wednesday.
Most likely price will make a double top before the bearish move really sets in.
The shown possible entry and stop is indicative.
Good trading all next week :)
GBPAUD Long retracementIt's making higher highs and lower lows, trend has been established as well (the pitchfork). The 6 hour shows good reversal signs as well indicating trend continuation. Enter as shown for a good RR possibility
Good trading all!

NZDCAD ShortIt's been in a ranging pattern for a couple of days now, the most recent 12 Hour bar shows a shooting star indicating a likely bearish trend is starting.
Good trading all!

AUDCAD Bearflag -> Short10 hour chart shows clear buying rejection from the last couple of days. Furthermore, a bear-flag formed which is a typical sell pattern.
Let's see how far it can go before the Brexit.
Good trading everyone!

USDCAD Shooting star -> ShortMassive rejection candle on the 12 hour.
IF selling continues with a lower low, enter for about a 1:5 RR

NZDUSD Sell Second leg downFirst leg was till 0.382 Fib, second leg down to 0.5 Fib level. 12 hour candles show high probability selling will continue.
Enter as shown on the chart for a good 1:4.8 RR.
Watch for the CPI news later today!
Good trading all :)


Corrective wave on EURUSD short the breakout EURUSD has been falling hard recently, if there is a trendline bounce along with the plotted SR touch a breakout could occur for the corrective wave channel. Look for a retest of the breakout and short.

USDCHF Buy next weekThe pitchfork shows a bull bull bias, last week's 12 hour candles show a push up towards the next SR zone. Let's see if early next week, Monday and Tuesday, this bull trend continues.
If it does, enter for a long trade towards the 0.5 Fib retracement level (not shown on chart, but that TP is the 0.5 fib)
Good trading next week everyone!

EURAUD Short on lower lowA lower low could signal a break of the consolidation area. The 12 hour candle at this moment clearly shows continued bearish movement. Enter on lower low for a good RR of about 1:4
Good trading all this week!

CADCHF ShortPossibility the upward channel gets broken, if price makes another low and breaks 0.382 fib, enter as shown and TP around the 0.5 Fib level.
Good trading this week everyone!

NZDUSD Short retracement to 0.5 FibI think long term this pair will still go up, but short term it looks to retrace to 50% fib level and bounce up from there. If last week is any indication the selling might continue next week. Tuesday will definitely tell which direction this pair will go.
If it break support, go short till the 0.5 fib level for a 1:4 RR possible return.
Good weekend and good trading!

USDCAD BuyLast 12 hour close of the week clearly shows selling rejection, this means a good probability the buying will continue next week. Monday price is likely moving counter trend, enter as shown on the chart for a good 1:4.6 RR
Good weekend all and good trading next week!

AUDCAD ShortSelling pressure has been building for this whole week now, looks to continue passed the SR zone towards 0.936 price zone.
Enter when lower low with a tight stop for a good 1:5 RR
Good trading and beware of news later today for this pair

CADJPY Buy till medianQuite some selling suppressed at this major SR zone around price level 84.5. The direction seems therefore to be bullish. A good TP area is around the (red line) median. This trade setup is good for about 1:7 RR
Good trading everyone!

USDCHF SellUSDCHF slowly moving upwards but there's not enough momentum to push it further, reversal looks possible towards the median line.
There's a good Risk Reward entering at the top of the pitchfork range for almost a 1:8
Good trading all!
