SRM/USD - Time to pump back to $8!SRM just broke resistance and also formed a very nice inverted head and shoulders... we broke the neckline of this formation which means one thing - BULLISH!
MACD is bullish, RSI is climbing, looking good. :)
Volume also looking healthy on this breakout. I expect higher levels. First target at $6.42 then $8.15 which is also our ATH. These levels should provide some resistance so watch these before entering.
On daily the indicators look even more bullish, so long term I expect price to go beyond $8. Bias remains very bullish.
Like and follow if you liked this idea! Also join my crypto community to stay in touch!
SRMUSD

SRMUSD another retest of previous ATH at $3.79 before move up We have already previously retested the resistance turned support at the previous ATH price of $3.79, however with the current bearish momentum of BTC this is dragged all ALTs down with it. It looking very likely that we reach this price once again before a continuation of the upwards trend

SRM 1H BUYAlso set some Buy orders near the Trendline
Remember no more than 5% of the deposit in one trade
SL: next sell signal

SRM 1H BUYAlso set some Buy orders near the Trendline
Remember no more than 5% of the deposit in one trade
SL: next sell signal


SRM - great entry hereSRM is such a great project. This is a great entry. Good RR. COrrection should be over.

SERUM LONG IDEAThink this is a possible play into next week.
TP1 & TP 2 as shown
SL as shown
Fundamentally serum is picking up traction
Not a fan of entering trades before weekly close, wide stop to accommodate for this
Let's see

SRM 1H BUYAlso set some Buy orders near the Trendline
Remember no more than 5% of the deposit in one trade
SL: next sell signal

Serum (SRM) • Don't bet against Sam Basically don't bet against Sam from FTX.
Another great low cap going that is looking that is getting ready to break ATH soon.

SRM 1H BUYAlso set some Buy orders near the Trendline
Remember no more than 5% of the deposit in one trade
SL: next sell signal


Serum cycle chart: still a 10x left in it ? 💰Looks like serum still has plenty of potential upside on HTF

Serum (SRM) coin formed Shark move for upto 105% bullish moveHi dear patrons, hope you are well and welcome to the new update on Serum ( SRM ) coin.
On the 4-hour time frame chart, the price action of the SRM coin is completing the final leg of the bullish reversal Shark move and soon it will be entered the potential reversal zone. There is also 200 simple moving average support in the buying zone.
This trade has a huge profit possibility of 105%, and the loss possibility is 21%.
Note: Above idea is for educational purpose only. It is advised to diversify and strictly follow the stop loss, and don't get stuck with trade.

SRMUSDTSRMUSDT just had about 80% move up.
It might get a support around $5.9 - $6.7 and the go back up and touch the highs of $8.
⚠️ NOTE: This usually happens when a coin gets hot on crypto platforms: it might go down by a little and then get back up to a new high.
Good Luck 🎲
Tell me your ideas. Like and Share 🗣✅

Serum (SRM) • Plenty of upside on this Alameda backed coinSerum, decentralised finance (DeFi) platform powered by the Solana blockchain.
SRM already moved a lot but i think the uptrend is still looking healthy and it's very likely to continue to gain market cap considering that it's backed by Alameda research and FTX.

SRM 1H BUYAlso set some Buy orders near the Trendline
Remember no more than 5% of the deposit in one trade
SL: next sell signal

🆓Serum/USDT Analysis (17/2) #SRM $SRMIf SRM holds $3.2 zone and conquer 4.2$ zone, this will be a good opportunity for SRM to increase strongly to $6 or even $8 zone in this February.
📈BUY
-Buy: 3.2-3.4$. SL if B
-Buy: 4.1-4.3$ if A. SL if B
📉SELL
-Sell: 5.8-6.0$. SL if A
-Sell: 8.0-8.4$. SL if A
♻️BACK-UP
-Sell: 3.2-3.4$ if B. SL if A
-Buy: 2.2-2.4$. SL if A
❓Details
Condition A : "If 8H candle closes ABOVE this zone"
Condition B : "If 8H candle closes BELOW this zone"


SRM heading to 5 dollars !!!SRM is at the moment flipping the previous resistance of our first target into support ...
If we successfully close above, we will head till the 5 dollars region !
Enjoy the ride ...
The content covered in this publication is NOT to be considered as investment advice.
Thank you all,
If you enjoyed this analysis please mark a thumbs up and do not hesitate to share your point of view in the comment section.
Have a Good day and Safe trade
Butterfly .D
/Metamorphose your portfolio/

SRMUSDT Buy Price ActionI like to watch the price action on this coin because it respects it a lot. Now we are seeing a reversal price action for a buy. For you not to miss any update, follow, like or comment. Thank you for your support. Trade with PROFITS.

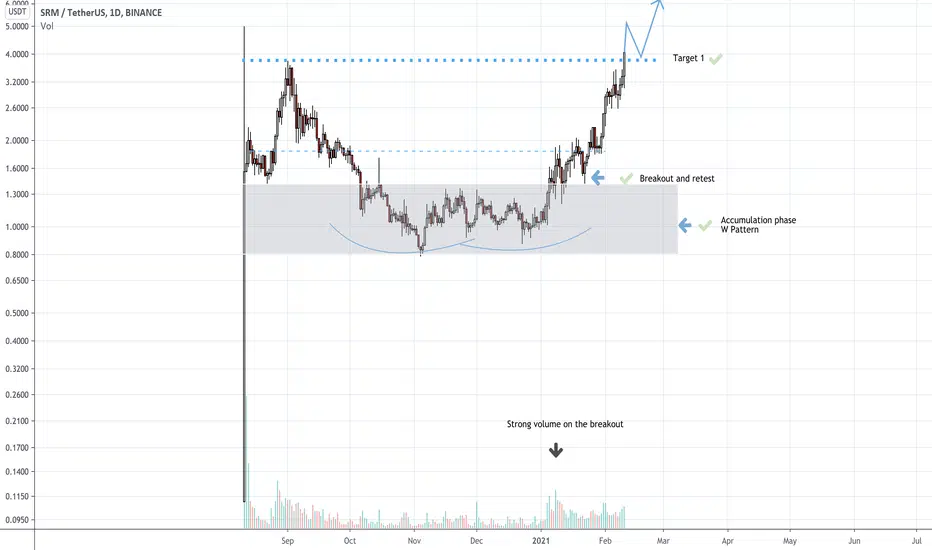
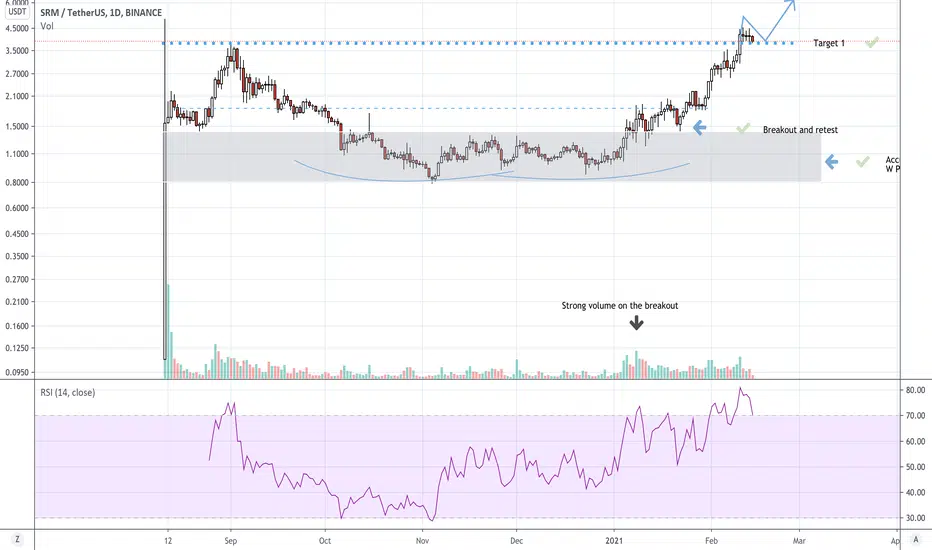
SRM Just smashed our Target 1! Only 3 weeks since we saw that SRM broke out from it's accumulation phase!
We were saying that a strong expansion phase leading to a parabolic move were coming, here we are !
(previous analysis)
Now that we successfully touched our Target 1, we would like to see a daily closure above our target 1 and a retest of it as a support in order to see further continuation. This flip from resistance to support of this zone would lead us to price discovery.
Enjoy the ride and congratulation to those who bought at the breakout from it's accumulation phase
Thank you all,
If you enjoyed this analysis please mark a thumbs up and do not hesitate to share your point of view in the comment section.
Have a Good day and Safe trade
Butterfly .D
/Metamorphose your portfolio/