Stacks

STXUSD is about to turn parabolic to $10.Stacks (STXUSD) has been trading within a Channel Up pattern since the December 26 2022 bottom. It is currently consolidating around the 1W MA50 (blue trend-line), coming off a Higher Low rebound at the bottom of the pattern and on the 1W MA200 (orange trend-line).
This current sideways trading is highly symmetric with the start of the previous Bullish Leg, as it is trading just below the 0.5 Fibonacci retracement level. At the same time, the 1W MACD has been on a Bullish Cross for a month now and the last time it formed a Bullish Cross (October 16 2023), was right after the previous Higher Low and before the 0.5 Fib consolidation.
Once the 0.5 Fib broke, the price aggressively rose on the Bullish Leg and formed a Higher High at the top of the Channel Up, right below the 2.0 Fib extension. As a result, we expect STX to reach at least $10.00 by the end of Q1 2025.
-------------------------------------------------------------------------------
** Please LIKE 👍, FOLLOW ✅, SHARE 🙌 and COMMENT ✍ if you enjoy this idea! Also share your ideas and charts in the comments section below! This is best way to keep it relevant, support us, keep the content here free and allow the idea to reach as many people as possible. **
-------------------------------------------------------------------------------
💸💸💸💸💸💸
👇 👇 👇 👇 👇 👇

S&P 500 Daily Chart Analysis For Week of Oct 11, 2024Technical Analysis and Outlook:
In the previous week's Daily Chart Analysis for the Week of October 4, it was observed that the index maintained considerable strength at the Mean Sup 5700 on Monday. The remaining days of the weekly trading sessions have demonstrated substantial and vigorous progress, surpassing the previously completed Inner Index Rally at 5763 and its progress towards the Outer Index Rally at 5840. The upcoming trading session will demonstrate further sentiment regarding the bullish sentiment to hit the 5840 target. However, recognizing that achieving the 5840 mark will incite a volatile downward price action is crucial.

Stacks (STX), LONG opportunity🟢 Here is a LONG opportunity on STX/USDT:
Potential Buy Zones:
1- 1.80 $
2- 1.65 $
3- 1.50 $
Potential Sell Zones:
1- 2.17 $ (20%)
2- 2.39 $ (32%)
3- 3.00 $ (66%)
4- 3.46 $ (93%)
About Stacks (STX):
Stacks (STX) enhances Bitcoin by enabling smart contracts and decentralized applications (DApps) without altering Bitcoin’s core protocol. Using Proof-of-Transfer (PoX), Stacks leverages Bitcoin’s security, enabling scalable and efficient transaction processing. STX tokens are essential for executing smart contracts, processing transactions, and rewarding network participants. The Stacks project is notable for being the first SEC-qualified token offering in the U.S., highlighting its regulatory compliance and potential for wide adoption.
Disclaimer
The information provided here should not be construed as financial advice. Always conduct your own research and consult with a licensed financial advisor before making any investment decisions. The author is not responsible for any losses or gains resulting from investment activities based on the information provided.

5x Potential Gains on STX From Here (Fibs, Channels & More)STX has been looking good and in a nice upward trending parallel channel since Dec 2022.
Just trading that channel would have yielded some great returns, but we can also look to the Fibonacci retracement from the previous high to low, which we can see exactly forecast the next high as shown in the video.
From there, we can run the Fib tool from the most recent high to low, which we seem to be coming out of in the ower edge of the bullish channel, giving us a $10 price target (5x).
This coincides with the fractal I took from the last bullish pump to the previous high, and it looks like this is a viable path to $10, judging from the rounded bottoming pattern and the 50 day EMA turning higher.
Let me know what you think of this video, leave a comment, and if I get 10 likes I'll try to do more of these weekly if not daily!
More information is in my bio, and I'd love to hear your thoughts on this study 🚀

October Picks: Stacks (STX) Gearing Up for new ATHs
📈🔥 October Picks: Stacks (STX) Gearing Up! 💥📊
Kicking off October with a promising setup! Historically a strong month for crypto, and Stacks (STX) is already up by 4% today. The chart reveals an ascending channel, with a rejection at 1.943.
Key Levels to Watch:
Support: 1.789 and 1.735
Breakout Zone: 1.95
Next Target: 2.76 🚀
This month, I’ll be sharing some of my favorite chart setups early on, so stay tuned for more picks coming soon! For more insights on STX, check out my previous analysis .
One Love,
The FXPROFESSOR 💙
Big chart and targets here:

$STX Key levels to watchSTX (Stacks) is breaking out of a 3-month consolidation and is now nearing its horizontal and psychological resistance at $2
A bullish structure is forming, and we have significant upside potential if we can break through the immediate resistance, which has now been tested for the third time.
There's strong support between $1.70 and $1.65. In my view, any dip to this range is a buying opportunity. If this level holds, we could see a move up towards $2.3 to $2.5
STX Looks Ready To 5x By End of 2024With this week's FOMC .50 Bp rate cut -- The Bull is Back Baby.
I've been buying BTC and SOL since last week, but now many of the alts are shaping up nicely.
One I like in particular is STX (Stacks) which essentially makes Bitcoin better.
The weekly chart looks very interesting here, coming out of a Buy Limit Order Block, and holding it's longer term trendline, back above it's 21 and 50 day EMA's.
The last local top was a projection from the prior dip and a 3.618 Fibonacci extension.
The same 3.618 projection points toward $10 which I think is a reasonable target by the end of 2024, which would be a 5x from here.
Plus our weekly Trend Strength Indicator is turning Green for first time since Jan 2023.
Many Alts are looking interesting, but I like this project and have been waiting for the ideal time to start building a position, so I'm going to start building here.
Let me know what you think, and your comments below.
Please 'Like' the analsys if you feel it's warranted (Trying to build a presence here on TV!)
Enjoy the next 3 months, Q4 should be interesting!
PS> I think we get a blow off top and a left-translated cycle. 2025 is a huge wildcard.

Potential Bullish Trend for Stacks (STX/USDT)#STX/USDT #Analysis
Description
---------------------------------------------------------------
+ The chart shows a strong ascending trendline acting as support, originating from the low in mid-2022. This trendline has been respected multiple times, indicating its significance.+
+ The price has broken above the previous resistance zone around $1.90, now acting as a support level.
+ The next major resistance zone is between $3.80 and $4.50, which was previously a strong support zone before the price breakdown in mid-2021.
+ The EMA 100 (blue line) is currently acting as dynamic support, aligning with the ascending trendline and providing additional support to the bullish case.
+ If the price holds above the ascending trendline and the $1.90 support zone, we can expect a retest of the $3.80 - $4.50 resistance zone.
+ A successful breakout above this resistance could see the price targeting the next psychological level around $6.00 and potentially higher to $7.50
+ The RSI is currently at 46.92, which is neutral but showing signs of potential reversal from the oversold region. If the RSI moves above 50, it would support the bullish momentum.
---------------------------------------------------------------
VectorAlgo Trade Details
------------------------------
Entry Price: $1.587
Stop Loss: around $1.20
------------------------------
Target 1: 2.660
Target 2: 4.050
Target 3: 6.00
Target 4: 7.5
------------------------------
Timeframe: 1W
Capital Risk: 1-2% of trading amount
Leverage: 5-10x
---------------------------------------------------------------
Enhance, Trade, Grow
---------------------------------------------------------------
Feel free to share your thoughts and insights.
Don't forget to like and follow us for more trading ideas and discussions.
Best Regards,
VectorAlgo

$stx Stacks over 60% retracement ...NASDAQ:STX Stacks has retraced by over 60% from an all time high of $3.8. Low Risk Buy!
Current Price: $1.60
Stacks current price action is currently in a huge falling wedge!
Up resistances: 1.8, 2.4, 2.9, 3.3, 3.6 then possibly new price discovery at 4.0, 4.4, 4.7, 5.1

Stacks bullish scenarioStacks could be forming a bull flag. a technical chart pattern that indicates a potential continuation of an uptrend.
Bulls managed to bounce off the ~$1.25 zone, previously respected by both buyers and sellers.
Now in a tight spot, facing diagonal resistance, potentially being a key zone to break out of a bull flag.
When prices a tightly compressed, a breakout is often more powerful.
A successful breakout could test the March highs of the ~$3.7 zone.

STXUSDT 1DSTX ~ 1D
#STX Make purchases gradually in this pattern. it is only a matter of time until this pattern is successfully broken and the bulls will dominate again.

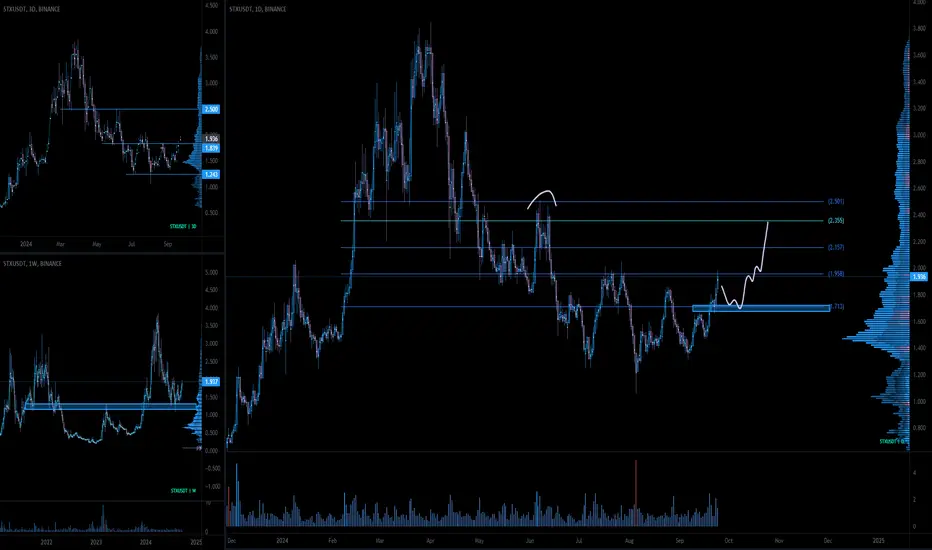
STXUSD Bottomed is in. Expect $10.00 by early 2025.Stacks (STXUSD) has been trading within a long-term Channel Up pattern since the December 30 2022 Low and is currently on the 2nd Bearish Leg of this pattern. Being below the 1D MA50 (blue trend-line), it is approaching the Channel's bottom.
The previous Bearish Leg formed the Higher Low sideways, so it is possible to replicate this structure and confirmed the new Bullish Leg after it broke above the 1D MA100 (green trend-line). Note that STX priced its Higher Low on the first decline after the formation of a 1D Death Cross and we are currently past that on the new Bearish Leg.
As a result, with the 1D MACD also printing the same bottom sequence as the previous Leg, we turn bullish again, targeting 10.00, which just below the 2.0 Fibonacci extension (similar to the previous Bullish Leg) exactly at the top of the Channel Up.
-------------------------------------------------------------------------------
** Please LIKE 👍, FOLLOW ✅, SHARE 🙌 and COMMENT ✍ if you enjoy this idea! Also share your ideas and charts in the comments section below! This is best way to keep it relevant, support us, keep the content here free and allow the idea to reach as many people as possible. **
-------------------------------------------------------------------------------
💸💸💸💸💸💸
👇 👇 👇 👇 👇 👇

Stacks Crypto Breakout: Must-Watch Resistance and Support LevelsBINANCE:STXUSDT has shown notable upward momentum in recent trading sessions, with closing prices rising consistently. Closing prices have progressed from $1.508 to $1.65, indicating a strong bullish trend. Meanwhile, the 9 Exponential Moving Average (EMA) is currently at $1.5437, while the 20 EMA stands at $1.4816. The positioning of these EMAs suggests that the shorter-term trend is outpacing the longer-term trend, reinforcing the bullish sentiment.
Concurrently, the Moving Average Convergence Divergence (MACD) further supports this bullish outlook. The MACD line has remained above the signal line, with the histogram displaying positive values, highlighting strong upward momentum. Currently, the MACD histogram is at 0.0316, reflecting increasing buying pressure.
Relative Strength Index (RSI) values have surged from 64.65 to 77.09, indicating that STX is approaching overbought territory. This suggests that while the bullish trend is strong, traders should be cautious of potential pullbacks or consolidation phases.
Key levels to watch include immediate resistance at $1.657. A breakout above this level could propel the Stacks crypto price towards the next resistance points at $1.675 and $1.69. These levels are critical, as a successful breach could signal continued upward movement and potentially attract more buyers.
On the downside, support levels are observed at $1.635 and $1.621. Should the price retrace, these levels could provide strong buying opportunities. A further drop might see support at $1.605, which could be crucial in maintaining the overall bullish structure.
For traders looking to capitalize on this trend, potential entry points for long positions could be around the support levels at $1.635 and $1.621, with exit targets set near the resistance levels at $1.675 and $1.69. Conversely, short traders might consider entries near the resistance levels, with exit targets at the immediate support zones to capture potential pullbacks.
In conclusion, the technical indicators for STX on the 4-hour chart exhibit a predominantly bullish outlook. Traders should monitor key resistance and support levels for potential entry and exit points to maximize their trading strategies.

STX ANALYSISSTX's bearish structure is well visible
We have liquidity pools at the bottom of the chart.
We have a supply range that we considered as a POI.
If the price reaches this supply, we will look for sell/short positions
We will also look for buy/long positions in the demand range.
Closing a daily candle above the invalidation level will violate the analysis
Note that the financial market is risky, so:
Do not enter a position without setting a stop and capital management and confirmation and trigger.
When we reach the first TP, save some profit and try to move the stop continuously in the direction of your profit.
If you have any comments please post them, comments will help us improve our performance
Thanks

STX: Approaching ResistanceTrade setup : Price is in a downtrend, trading below its 200-day moving average. It's also broke below $2.00 support and made a Lower Low, which is also a sign of a downtrend. Price needs to break back above those key levels to resume it's uptrend. Stacks (STX) is a platform for scaling and building on top of Bitcoin. Read our research report.
Pattern : Price is Approaching Support , which is a level where it could pause or reverse its recent decline, at least temporarily. Support is often a level where price has bounced up in the past, or potentially prior Resistance level that was broken. (concept known as polarity). Once price breaks below support, it can move lower to the next support level. Learn to trade key levels in Lesson 7.
Trend : Short-term trend is Down, Medium-term trend is Strong Down and Long-term trend is Strong Down.
Momentum : Price is neither overbought nor oversold currently, based on RSI-14 levels (RSI > 30 and RSI < 70).
Support and Resistance : Nearest Support Zone is $1.50, then $1.30. Nearest Resistance Zone is $2.00, then $2.50.

Moving towards the top of the channelThe trend is bullish in the current timeframe, but overall it is ranging. There is an ascending channel where STX is fluctuating, showing good volatility.
The scenario involves moving towards the top of the channel, and we can aim for this movement with strong confirmations.

Potential for another decline towards the lower boundarySTX is currently in a ranging trend, though it exhibits a tendency towards more downward movements. The price action is confined within a large descending channel. Recently, STX reached the upper boundary of this channel after an extended period of consolidation near the lower boundary.

(STX) Stacks "long running trend"The trend lines on Stacks have not crossed for a long time, about a half a year. Image indicator offers a view of no red line connecting the moving average lines. blue dotted lines representing time on a floating axis to replicate those pesky triangles people draw only these triangles are based on the information inside the chart. I draw the dashed lines previously and have those lines matched up with the indicator.

Opportunity to buy in STXFrom where we put the red arrow on the chart, STX correction has started.
According to STX correction, it is a symmetrical or double.
The green range is a good support.
By maintaining the green range, it can have an upward return towards the targets specified on the chart.
Closing a daily candle below the invalidation level will violate the analysis
For risk management, please don't forget stop loss and capital management
When we reach the first target, save some profit and then change the stop to entry
Comment if you have any questions
Thank You

$STX Stacks after over 50% retracement... What Next?NASDAQ:STX STACKS has recently done over a 50% retracement from an all time high of about $3.8
Current Price: $2.2
Stacks current price action is currently trying to break out of its falling channel for higher prices
Up resistances: 2.4, 2.9, 3.3, 3.6 then possibly new price discovery at 4.0, 4.4, 4.7, 5.1
A failed breakout of channel will lead to retest of support at 1.8

STX: Falling Wedge BreakoutTrade setup : Bullish breakout from Falling Wedge could signal resumption of uptrend, with +25% potential upside to $2.50 thereafter. Breakout was confirmed as price broke above $2.00 horizontal resistance and above 200-day moving average ($2.06). Stacks (STX) is a platform for scaling and building on top of Bitcoin. Read our research report.
Patterns : Falling Wedge Usually results in a bullish breakout . When price breaks the upper trend line the price is expected to trend higher. Emerging patterns (before a breakout occurs) can be traded by swing traders between the convergence lines; however, most traders should wait for a completed pattern with a breakout and then place a BUY order. Learn to trade chart patterns in Lesson 8.
Trend : Short-term trend is Neutral, Medium-term trend is Strong Down and Long-term trend is Down.
Momentum : Price is neither overbought nor oversold currently, based on RSI-14 levels (RSI > 30 and RSI < 70).
Support and Resistance : Nearest Support Zone is $2.00, then $1.30. Nearest Resistance Zone is $2.50, then $3.50.

Stacks / STX The price of Stacks is $0.76 today with a 24hour trading volume of 250 million dollars. This represents a 12% price increase in the last 24 hours and a 160% price increase in the past 14 days
Stacks is a layer1 blockchain solution that is designed to bring smart contracts and decentralized applications to Bitcoin. These smart contracts are brought to Bitcoin without changing any of the features that make it so powerful, including its security and stability. Stacks was initially funded by a range of prominent venture capital funds, including Y Combinator, Digital Currency Group and Winklevoss Capital. It was developed by Blockstack PBC, which has its headquarters in New York.
Next Stacks upgrade is slated for March 20th, with the larger Nakamoto upgrade planned for later this year. Stacks 2.1 can enable more efficient Bitcoin yield via Stacking, make bridges to other networks more robust, simplify the ways developers can link and trigger interactions between Stacks and Bitcoin, and lay some helpful groundwork for Subnets which can bring additional speed and scalability to the network when launched.
if you are scalper be careful because as you can see those shadows are huge and STX whales are ruthless , 0.65 is good support and opportunity for buying the dip or long
STX next targets are 0.81, 0.85 and 0.89$
