$STX/USDT 2h (#Bybit) Rising wedge breakdown and retestStacks seems locally topped here and a retracement down to 100EMA would make sense.
⚡️⚡️ #STX/USDT ⚡️⚡️
Exchanges: ByBit USDT
Signal Type: Regular (Short)
Leverage: Isolated (3.0X)
Amount: 5.0%
Current Price:
0.94020
Entry Targets:
1) 0.95080
Take-Profit Targets:
1) 0.76145
Stop Targets:
1) 1.07745
Published By: @Zblaba
$STX #STXUSDT #Stacks #PoX
Risk/Reward= 1:1.5
Expected Profit= +59.7%
Possible Loss= -40.0%
www.stacks.co
Stacks

STX: Approaching SupportTrade setup : After sizeable gains (~400% YTD 2023), price was met with selling pressure around $1.05 resistance area. Now we wait for price to find support level and for momentum to inflect bullish again (MACD Histogram rising). Fibonacci retracement levels (potential support) are $0.73 (38.2%), $0.63 (50%), and $0.63 (78.6%).
Trend : Neutral on Short-Term basis and Uptrend on Medium- and Long-Term basis.
Momentum is Mixed as MACD Line is below MACD Signal Line (Bearish) but RSI > 55 (Bullish).
Support and Resistance : Nearest Support Zone is $0.80, which it broke, then $0.60, and $0.40. The nearest Resistance Zone is $1.05.

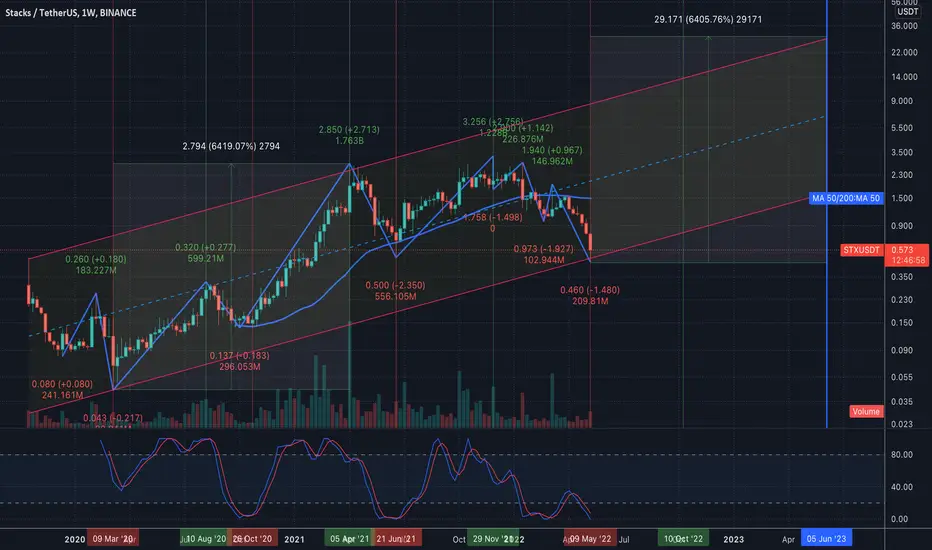
✴️ This Isn't Over... 425% Is Just The Beginning!Let's go back to Stacks because I already showed you literally hundreds of different charts and there is no point in looking for new ones, more opportunities available than the ones that we can take.
This will give further strength to our bullish position.
First, notice the ultra-high volume.
This tells us that things are only getting started.
The RSI goes super high just as it happened in August 2020.
The MACD enters the bullish moving north for the first time ever.
We have a long-term higher low.
A higher high is possible next.
Above $4 is the potential... More or less!
Projection for new All-Time Highs in 2024 for the Altcoins or 2025.
And 2025 for Bitcoin.
We are still early even after 425% of growth.
People will be joining months for now, years from now...
By the time retail buying, traders will be selling.
That's the great advantage of reading this, of being here, now!
Namaste.

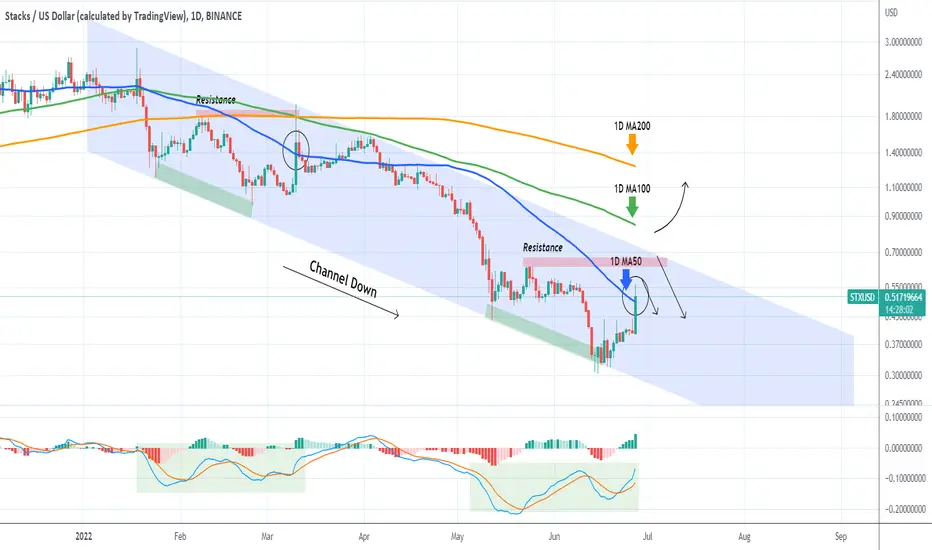
STXUSD Extremely high potential after 1D Golden Cross.Stacks (STXUSD) is on an amazing parabolic rally, having broken above its 1W MA50 (red trend-line). On top of that, the 1D MA50 (blue trend-line) and the 1D MA200 (orange trend-line) formed the Golden Cross, a technically very bullish formation for the long-term.
With the 1D RSI though hitting 90.00 (extremely overbought levels) and the price filling the 0.5 Fibonacci retracement level, it is more probable technically to witness a pull-back and medium-term sideways trading until the 1D MA50 at least makes contact. We are buying either on this pull-back or if the price breaks above the 0.618 Fibonacci first. The Channel Fibs draw an additional Channel framework to work within. Our target by the end of June is the 0.786 Channel Fib, at at least 2.5500.
-------------------------------------------------------------------------------
** Please LIKE 👍, FOLLOW ✅, SHARE 🙌 and COMMENT ✍ if you enjoy this idea! Also share your ideas and charts in the comments section below! **
-------------------------------------------------------------------------------
💸💸💸💸💸💸
👇 👇 👇 👇 👇 👇

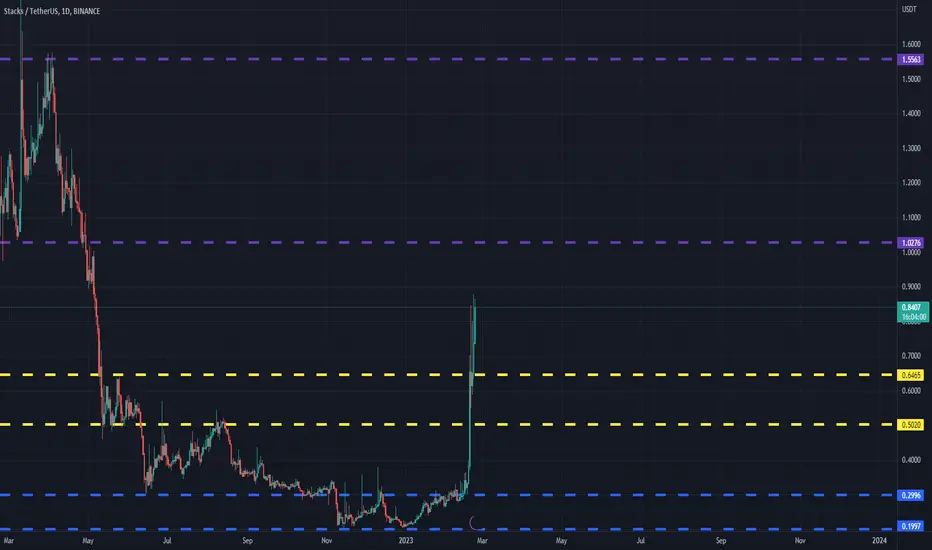
STXUSDT(Stacks) Daily tf Range Updated till 23-02-23STXUSDT(Stacks) Daily timeframe range. from its local low it retraced back to 320%+ thats actually quite insane. it needs little bit more volume to push toward 1.0276#. after that it got midrange which is 1.300#.but that depends how retail interest keeps up.
STXUSDT CHART- 23/2/23 WHERE TO TAKE PROFITWhere to enter and exit on stx trade
enter 0.835
stop loss 0.74
take profit 1.12

✳️ Mapping A 125% Bullish Wave for StacksWe have a neat and clear downtrend starting June 2022 for STXBTC but as November approaches we can see lots of bullish action.
This action is supported by high bull volume on green days but as prices decrease the bear volume is low.
This signals we belief is saying that the downtrend is coming to an end and the bullish action that became evident in November was due to some purchase being made by whales.
Are we early to the party?
We will know soon enough...
We see a 44% jump once the breakout happens and the bullish wave can reach 125% initial within 1-2 months.
There is higher potential long-term.... But we have to start somewhere, we go step by step.
Additional details on the chart.
Namaste.

✳️ Stacks 113-293% Potential Supported by Strong SignalsSometimes we see a chart and spot some signals and even while reading the signals as bullish and seeing them confirmed some small doubt remains... This happens when the signals are not strong enough.
In fact, we can go through the whole analysis and at the end just STOP! and visit that doubt again... With STXBTC, this is not the case.
Now, the signals here are very strong.
The volume is absolutely high and it has been growing day after day which is better than it showing up by surprise in a single day.
Today STXBTC has the highest volume Since November 2022 and if we ignore this day, today has the highest volume since January 2022... That's a very strong bullish confirmation as this volumes comes as STXBTC moves above MA200, telling us it is getting ready to grow long-term.
The low/bottom here happened in 22-January 2023, while Cryptocurrency grows together, ALTSBTC + ALTSUSDT, they have a slight delay between each set, when one moves forward, the other one is going sideways or correcting but when the group that is more advanced takes a break, the other group jumps up with massive force to catch up.
- The RSI at 77 is super strong.
- The MACD just entered the bullish zone, with plenty of room available for additional growth.
Everything is pointing higher.
The conservative target is 113%.
The mid-term target is set at 293%.
We see Altcoins growing by 100% and 200% in a single day.
While I share these numbers conservatively, remember that the cryptocurrency market is wild and growth can be many times higher than what I am sharing everyday.
Since we are not greedy, we are grateful and happy with any and all positive results, we keep the numbers tight but when trading, we aim high up.
Namaste.

STXUSDT is preparing for an impulsive wave 3 It appears that STXUSDT is preparing for an impulsive wave 3. Support has been found at the 0.618 Fibonacci level, and by using Fibonacci extension, the following resistance points have been identified. Although it's just a possibility at this point, $STXUSDT could be quite intriguing.


STXUSD Rebound contained below the 1D MA100Stacks (STCUSD) has had a +50% rebound on today's peak but we see the effect retracing as it almost hit the 1D MA100 (green trend-line). As long as it fails to close a candle above it, expect a Lower Low within the Channel Down pattern that it has been trading in since May 31. A break above the 1D MA100 targets the 1D MA200 (orange trend-line) which has been unbroken since January 21. A closing above it would still be limited to the top (Lower Highs trend-line) of the Channel Down but still a major bullish development for the long-term nonetheless. In order to sustain an uptrend in this case, the 1D MA50 (blue trend-line) has to be tested and hold as a Support.
-------------------------------------------------------------------------------
** Please LIKE 👍, SUBSCRIBE ✅, SHARE 🙌 and COMMENT ✍ if you enjoy this idea! Also share your ideas and charts in the comments section below! This is best way to keep it relevant, support me, keep the content here free and allow the idea to reach as many people as possible. **
-------------------------------------------------------------------------------
You may also TELL ME 🙋♀️🙋♂️ in the comments section which symbol you want me to analyze next and on which time-frame. The one with the most posts will be published tomorrow! 👏🎁
-------------------------------------------------------------------------------
👇 👇 👇 👇 👇 👇
💸💸💸💸💸💸
👇 👇 👇 👇 👇 👇

$STX/BTC is about to explodeBuying volume is increasing and Bollinger Bands are really tight, and that means it's getting volatile.
STX is currently trading in my buying zone for 3 months. It's the 0.618 en 0.65 Fibonacci retracement from the last impulsive wave 1.
From Stacks' market history, it can be seen that stacks has a habit of showing explosive price rises.
As Bitcoin continues to move between 20k-24k and loses market dominance, it seems that this will give room for sats to rise significantly in value.
My expectation is that the 0.382 Fib will be a first point of resistance (2764 sats). Seen from the current price, this is a 45% increase in sats value.

$STXBTC huge break-out about to occurStacks is on a breakout. As previously mentioned in my analysis of last May 30, found at this link: Stacks is very interesting to take a long position in.
On the hourly chart, the Bollinger bands are hugely compressed. This shows that there will be a huge breakout, and in my opinion, upwards. I'm expecting an upward move because stxbtc has set a very nice bottom at the 0.618 Fibonacci retracement.

STXUSD First time above the 1D MA50 since April!Stacks (STCUSD) hit today and broke above its 1D MA50 (blue trend-line) for the first time since April 18 2022. The coin has been trading within a Channel Down pattern since the January 18 High. The long-term trend remains bearish as despite today's impressive 1D candle, the price remains both below the previous Resistance level and the Lower Highs trend-line (top) of the Channel Down.
Both in candles and in 1D MACD terms, today's formation resembles the 1D MA50 test of March 10. This candle not onl broke above the 1D MA50 but also marginally above its prior Resistance Zone and the 1D MA100 (green) and 1D MA200 (orange trend-line) periods (which at the time converged and transitioned into the bearish trend), but still got rejected at the top of the Channel Down.
As a result, we can only take a short-term buy here towards the Resistance and top of the Channel but not a long-term one. In order to buy comfortably on a medium-term horizon, the price needs to break and close above the 1D MA100 (green trend-line). In that case the target will be the 1D MA200.
--------------------------------------------------------------------------------------------------------
Please like, subscribe and share your ideas and charts with the community!
--------------------------------------------------------------------------------------------------------
Stacks has bottomed at the 0.618 Fibonacci retracementSTXUSDT has put down a textbook 0.618 Fibonacci retracement correction on the weekly chart.
In my Elliott Wave count, the last impulsive wave was a truncated fifth. In a new wave count, the retracement to the 0.618 Fibonacci is a corrective wave 2. Such a correction is not unusual for a corrective Wave 2.
The Tom Demark (TD) Sequential Indicator indicates a 9-candle count. This usually means that a bottom has been reached and a trend reversal will occur. It indicates a set-up to take a position in the market.
I have additionally used the Chris Moody Indicator "RSI Strategy Lower". This indicates by means of the RSI that a bottom has been reached. This can also be seen by the formed horizontal green line; this is now starting to move upwards.
If STXUSDT is preparing for an impulsive wave 3, interesting times are coming...

STX/BTC currently trading in the golden pocket rangeSTX/BTC is STX/BTC is currently trading in the golden pocket range on the weekly chart.
The divergence script for many indicators indicates two clear bullish divergences.
Chris Moody's script 'CM Williams VIX' which finds market bottoms, flashes obvious green.
LazyBear's Squeeze Momentum Indicator indicates a momentum change due to the first colour change from red to dark red.
The sell volume has been decreasing for months.
RSI is below 40.
MACD is a lagging indicator but when you switch to a 2/3day timeframe there is already crossover. My expectation is that this will soon follow on the weekly chart.

Long STX\USDTlooking at a longer period …
Stacks is a layer-1 blockchain solution that is designed to bring smart contracts and decentralized applications (DApps) to Bitcoin (BTC). These smart contracts are brought to Bitcoin without changing any of the features that make it so powerful — including its security and stability.
🆓Stacks (STX) Mar-17 #STX $STX
After being rejected at 1.8$, STX fell sharply to 1.2$ to retest this zone. The selling has decreased a lot when approaching this $1.2 zone so in the next few days we could see a rally at least to the $1.4 and $ 1.6 zones. STX can also increase sharply to retest the 1.8$ zone but to overcome this zone will be very difficult with the current trend.
📈RED PLAN
♻️Condition : If 1-Day closes ABOVE 1.2$ zone
🔴Buy : 1.2
🔴Sell : 1.4 - 1.6 - 1.8
📉BLUE PLAN
♻️Condition : If 1-Day closes BELOW 1.2$ zone
🔵Sell : 1.2
🔵Buy : 1.05 - 0.9
❓Details
🚫Stoploss for Long : 10%
🚫Stoploss for Short : 5%
📈Red Arrow : Main Direction as RED PLAN
📉Blue Arrow : Back-Up Direction as BLUE PLAN
🟩Green zone : Support zone as BUY section
🟥Red zone : Resistance zone as SELL section

Bag🎒 your STACKS once again! Stacks broke up this triangle 📐 and I think there is chance for run to 3.55 and even higher. Setting BUY LIMIT order to catch the pullback. STX just pamp eet! ⛽
ENTRY : local high @ 2.19
STOPLOSS (SL) : local low @ 1.94
TARGETS (TP) : TP1 - resistance @ 2.70 | TP2 - resistance @ 3.09 | TP3 - height of the triangle projected from midpoint of the local range (BUY LIMIT - SL) @ 3.55
REWARD RISK RATIO (RRR) : TARGET1 - 2.0 | TARGET2 - 3.6 | TARGET3 - 5.5
INVALIDATION : when SL level hit
My previous STX ideas 👇
Check my other stuff in related ideas.
Please like👍, comment🗣️, follow me✒️, enjoy📺!
⚠️Disclaimer: I'm not financial advisor. This is not a financial advice. Do your own due dilingence.

STXUSD Last dump before a multi-month rally.Stacks has been trading within a long-term Channel Up since the start of 2020 and is about to form a 1D MA50/ MA100 Bearish Cross. This is similar to the Bearish Cross of October 10 2020, which was the cross that paved the way for a 3 month rally. The 1D LMACD sequence between the two fractals is also identical. We should be expecting a bullish break-out by the first week of February.
--------------------------------------------------------------------------------------------------------
** Please support this idea with your likes and comments, it is the best way to keep it relevant and support me. **
--------------------------------------------------------------------------------------------------------

Stacks (STX) Hits New High Compared To April 2021 - Great News We are technical analysts and we love the charts.
We love the candles and the amazing tool that this is.
Since you can get everything from the charts, hardly ever we take the fundamentals into account.
Here is one exception though, we love Stacks as a project and we have been trading this pair for long.
STXBTC (Stacks) hits a new high today compared to April 2021.
Like most Altcoins vs Bitcoin pairs;
The bullish action started after the low set late 2020 early 2021, prices started to grow.
A peak was hit in April (others peaked in March/May) and then we had a correction that ended in a higher low.
Higher lows lead to higher highs...
And now we grow.
After almost 8 longs months, we have a new high which is extremely bullish for this pair and the rest of the Altcoins market as a whole.
Remember, they are all connected.
What one pair those, the rest is sure to follow.
We are set for at least 1 more year of higher highs and higher lows.
Thanks for reading.
Always hit LIKE to support my work and for more.
Namaste.

BTC plus DEFI - Smart Contracts - Next catalyst? STX Starting to become more confident that 40K will be the floor here with upside to 54K in the next 2-3 months.
Fundamentals- I believe defi on BTC will be the next catalyst.. Very small right now, STX is leading the way. A great article i came across today
www.hiro.so
Chart wise risk to reward seems to favor the bulls at this point.. upside to 54K vs 40K downside.. If btc breaks though 46K things become a lot more bullish.

