Stacks (STXUSD) to break some resistancesStacks (STXUSD) to break some resistances.
Those are at current price level for a new ATH.
But also in the OBV and later at the critical RSI-level.
But specifically the OBV is rising in a stable way.
And still some space until the above mentioned RSI "danger zone" 😎
Drop me a nice comment if you'd like me to analyze any other cryptocurrency or do another comparison.
*no financial advice
do your own research before investing
Stacks

Short and Long - STX/BTCShort and Long - STX/BTC
Interesting situation, where do you think the price is heading?

Stacks (STX) - November 25Hello?
Welcome, traders.
If you "follow", you can always get new information quickly.
Please also click "Like".
Have a nice day.
-------------------------------------
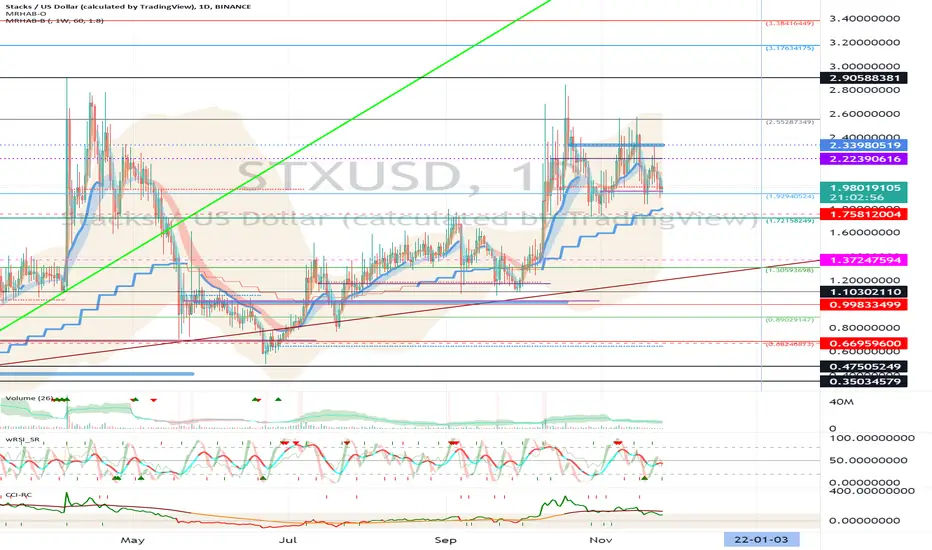
(STXUSD 1W Chart) - Mid-Long-Term Perspective
Above 0.35034579-0.47505249 section: expected to continue upward trend
0.99833499-1.10302110 or higher: Expected to create a new wave.
(1D chart)
First resistance section: near the 2.55287349 point
Second resistance section: 3.17634175-3.38416449
Support section: 1.72158249-1.92940524
If the price is maintained in the range of 1.92940524-2.55287349, it is expected to renew ATH.
It should rise above the 2.33980519-2.55287349 section to accelerate the uptrend.
If the price declines from the support zone, it may move towards the 1.10302110 point, so trade cautiously.
------------------------------------------
(STXBTC 1W chart)
Above the 2735 Satoshi point, we need to see if we can continue the uptrend along the uptrend line.
------------------------------------------
We recommend that you trade with your average unit price.
This is because, if the price is below your average unit price, whether it is in an uptrend or in a downtrend, there is a high possibility that you will not be able to get a big profit due to the psychological burden.
The center of all trading starts with the average unit price at which you start trading.
If you ignore this, you may be trading in the wrong direction.
Therefore, it is important to find a way to lower the average unit price and adjust the proportion of the investment, ultimately allowing the funds corresponding to the profits to regenerate themselves.
------------------------------------------------------------ -----------------------------------------------------
** All indicators are lagging indicators.
Therefore, it is important to be aware that the indicator moves accordingly as price and volume move.
However, for the sake of convenience, we are talking in reverse for the interpretation of the indicator.
** The MRHAB-O and MRHAB-B indicators used in the chart are indicators of our channel that have not yet been released.
(Since it was not disclosed, you can use this chart without any restrictions by sharing this chart and copying and pasting the indicators.)
** The wRSI_SR indicator is an indicator created by adding settings and options to the existing Stochastic RSI indicator.
Therefore, the interpretation is the same as the traditional Stochastic RSI indicator. (K, D line -> R, S line)
** The OBV indicator was re-created by applying the formula to the DepthHouse Trading indicator, an indicator disclosed by oh92. (Thanks for this.)
** Support or resistance is based on the closing price of the 1D chart.
** All descriptions are for reference only and do not guarantee a profit or loss in investment.
(Short-term Stop Loss can be said to be a point where profit and loss can be preserved or additional entry can be made through split trading. It is a short-term investment perspective.)
---------------------------------
🆓Stacks (STX) Nov-10 #STX $STXThe buying power is continuing to push on STX at the $2.2 zone and it can increase strongly to the $2.6 and $3.6 zones in the near future. But if it loses the $2.2 zone, it will fall back to the $1.9 or even $1.6 zone
📈RED PLAN
♻️Condition : If 1-Day closes ABOVE 2.2$ zone
🔴Buy : 2.2
🔴Sell : 2.6 - 3.6
📉BLUE PLAN
♻️Condition : If 1-Day closes BELOW 2.2$ zone
🔵Sell : 2.2
🔵Buy : 1.9 - 1.6
❓Details
🚫Stoploss for Long : 10%
🚫Stoploss for Short : 5%
📈Red Arrow : Main Direction as RED PLAN
📉Blue Arrow : Back-Up Direction as BLUE PLAN
🟩Green zone : Support zone as BUY section
🟥Red zone : Resistance zone as SELL section

Bag your STACKS again!Stacks recently pumped as predicted in the idea below:
After hitting my target it's consolidating in another triangle and now it seems to be ready to break up also this new triangle 📐. If successful I think there is chance for run to 2.94 and even higher. STX , just do it again! ✔️
ENTRY : local high @ 2.24
SL : local low @ 2.04
TARGET : height of the triangle projected from midpoint of the local range (BUY STOP-LIMIT - SL) @ 2.94
RRR : 3.4
INVALIDATION : when SL level hit
Check my other stuff in related ideas.
Please like👍, comment🗣️, follow me✒️, enjoy📺!
⚠️Disclaimer: I'm not financial advisor. This is not a financial advice. Do your own due dilingence.


Bag your STACKS!Stacks broke up this triangle 📐 and I think there is chance for run to 2 and even higher. Setting BUY LIMIT order to catch the pullback and add to my stack. Check the other triangle breakouts in related ideas STX just do it! ✔️
ENTRY : local high @ 1.377
SL : local low @ 1.277
TARGET : height of the triangle projected from midpoint of the local range (BUY LIMIT - SL) @ 1.99
RRR : 6.1
INVALIDATION : when SL level hit
Please like👍, comment🗣️, follow me✒️, enjoy📺!
⚠️Disclaimer: I'm not financial advisor. This is not a financial advice. Do your own due dilingence.


Stacks' Is Consolidating in a Symmetrical Triangle For NowStacks' (STX) rally has paused, and a very volatile consolidation seems to be taking place in the form of a symmetrical triangle. While the symmetrical triangle is a neutral chart pattern, when it appears within an established trend, it tends to break in the direction of the prevailing trend.
Symmetrical Triangle Pattern
The symmetrical triangle is in the early stage of development, and it might take a while before it is concluded. If the price remains contained within the current upward and downward sloping trendlines, we will have a valid symmetrical triangle.
On the upside, a break above the downward sloping trendline will open the door for a retest of the short-term resistance level of $2.44.
The current swing high of $2.61 is another technical level that the bulls need to overcome. However, the most important resistance level remains the recent all-time high of $2.90 established on April 5.
The 50-period simple moving average aligns perfectly with the upward sloping trendline to provide more confluence. This means it will be harder for the bears to take charge. However, a downside break will open the door for a retest of support level $1.83.


Stacks STXUSDT - Head and shoulders + NEW ATH + 600%!- STX is forming an inverse head and shoulders pattern on the daily candles, which is a bullish reversal pattern.
- Volume favors bulls, as there is not any selling pressure.
- All time high resistance 2.85 can act as a resistance.
- The price is above a trendline from 2020.
- For expected duration of the trade, probability, stop loss, profit target, entry price and risk to reward ratio (RRR) - please check my signature below ↓
- If you want to see more of these ideas, hit "Like" & "Follow"!

Stacks (STX) formed bullish Gartley pattern for upto 14% moveHi friends, hope you are well and welcome to the new update on the Stacks ( STX ) coin.
Previously we had a nice trade of STX coin:
On a 4-hourly chart, the price line of AMB has formed a bullish Gartley pattern.

STACKS STXUSD Massive Breakout Potential1.618 is the target
0.618 is a strong support
Provided a channel for the uptrend run
This looks really good and could run massively

Stacks coming out of massive accumulation. Big prospects!1. Mainnet lauched a few months ago. You can stake to earn BTC
2. Was one of the biggest laggards early on. Also one of the projects that got talked about a lot in the past and people slowly forgot, but it is one with pretty big goals
3. Largest and cleanest triple bottom / accumulation, with a gigantic breakout and retest. 1+ year long and looks super clean
4. The first cryptocurrency to receive SEC qualification for a sale in the United States
5. Not many listings yet and I think many will come but slowly more and more are coming. Especially Coinbase. The gigantic breakout came because of its listing on Upbit and everybody knows how big of a role demand in Korea plays

STX all-time high is imminent price bouncing from 4 hours Support multiple times. we will see a clear all-time high once the daily resistance is broken. The idea is only for educational purposes. please do your own reach before making any trade
cheers


STXUSDT LONG ?Its making a flag pattern ready to explode, what do you guys think? wanna get your opinions on this one, my prediction is at 3 or more. any thoughts are welcomed since im new :)

Stacks - STX will bring us HUGE profits in thi bullrun.STX is innovative project. This coin looks promising, holders will be rewarded. This coin is on our golden altcoins list and we are holding it. If you are Stacks holder you can use stacking (no staking) on their official wallet - Stacks wallet. You can earn free BTC by this method.
If you want to know our golden list of altcoins for this bullrun and play with us on short term signals feel free to join us on our website!
