Standardandpoor500


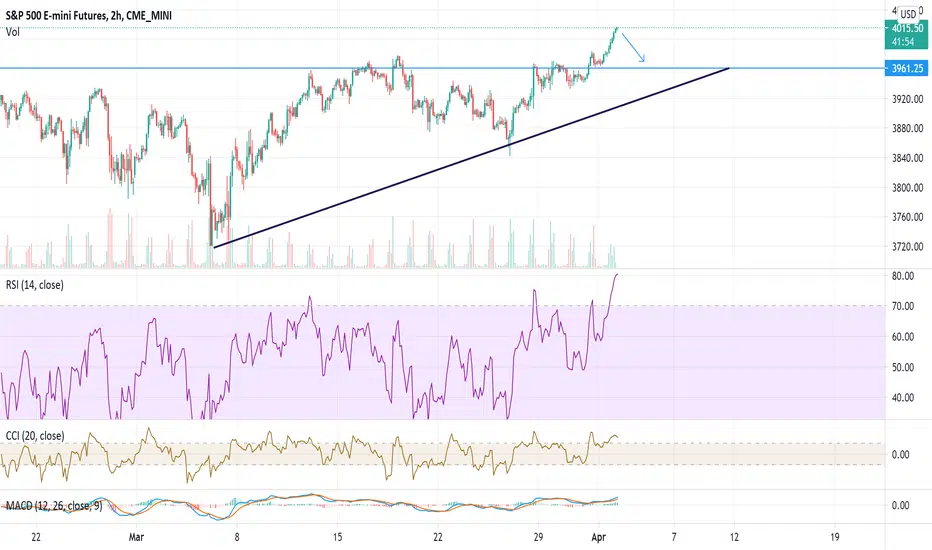
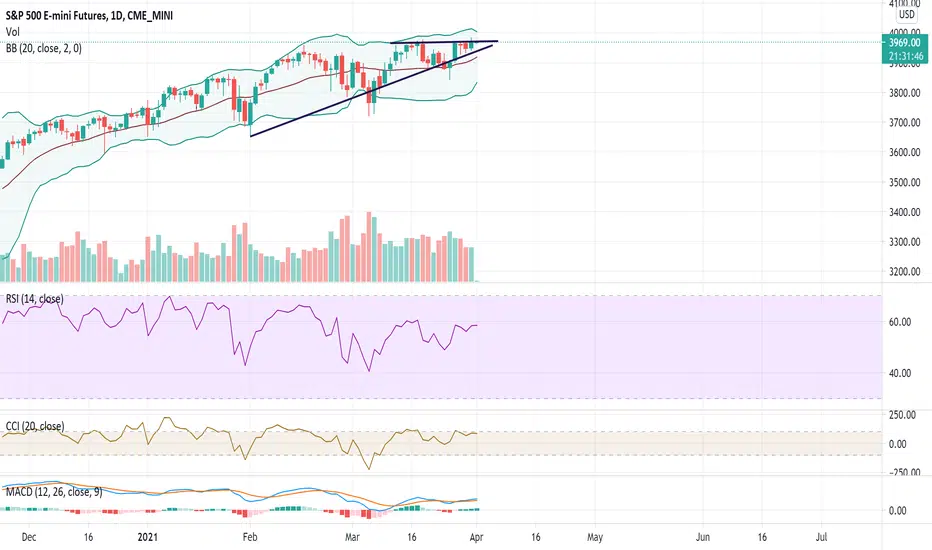
SP500 for a new ATH? 🦐SP500 after last weeks retracement is now back pushing at the resistance level near to the market all-time high.
According to Plancton's strategy of the market will break above we will set a nice long order.
––––
Follow the Shrimp 🦐
Keep in mind.
• 🟣 Purple structure -> Monthly structure.
• 🔴 Red structure -> Weekly structure.
• 🔵 Blue structure -> Daily structure.
• 🟡 Yellow structure -> 4h structure.
• ⚫️ Black structure -> >4h structure.
Here is the Plancton0618 technical analysis , please comment below if you have any question.
The ENTRY in the market will be taken only if the condition of the Plancton0618 strategy will trigger.


S&P500:TRADING ANALYSIS - BULLISH CHANNEL WAITING NEW IMPULSE🔥Wall Street's major stock indices rose in early Wednesday trading as comments from Federal Reserve officials eased concerns about accelerating inflation and a decline in government bond yields supported big tech stocks. The S&P 500 Index rose 0.25% to 4,198.7 points.

SPX500 S&P 500 Index | Pin Bar + EMA 10 + EMA 20 + TrendSPX500 S&P 500 Index | Pin Bar Entry At Close Price; RMultiple 3/1

S&P 500 in 1 d. 07 April 2021Probability 1. Consolidation between $3700 to $ 3900 to break the resistance of $4120 in the next months after June
Probability 2. break the last resistance of $ 4150 and go up to $ 4588 - $ 4700 while maintaining the price
Probability 3. Fall sharply and quickly to $ 3380 and if SPX 500 fails to consolidate at this price, the next drop is to $ 3180

spx---> stay caution, hold tight stay rightToday SPX formed a very bullish candle , usually these type of candle with out any wick are dangerous, dangerous because it doesnt tell anything much. This can be a bear trap or a short covering , but whatever the candle is i am expecting a pull back to the support level as mentioned in chart. This pull back can happen next week probably, we can see a green Monday but i believe Monday will be red . Market has got a good run this week and last week, so a pull back is expected
Remember there is a saying bulls dont last more than 3 days and bears 4 than 4 days, so be ready for few red days ahead
I think the best strategy will be to cover the longs and some stock will also provide buy the dip opportunity
I hope you are enjoying my analysis, ideas here are for entertainment and education these are not trading advice. Dont forget to like , follow me and check my other ideas
SPX--> did i told u all the future yesterday (check my charts)As you can see today SPX formed a engulfing green candle in beside red one. However nothing can be said as per now. If we look at technicals then spx is forming an ascending triangle pattern which if broken will lead to rally. I feel that market will consolidate around this level but asending triangle breakout will happen soon, . Market today went to 3997 and then selling started but overall it eneded in bullish candle which indicate bulls are still in control
There are 2 ways market can go either consolidate at this level and a bullish triangle breakout or a lillte bit advance each day till approx 4000 level.
Dont forget to check my other charts
Ideas are for education and entertainment not a trading advice
SPX--> bull should comeSPX today showed a hammer with gap down opening but in the end bull were able to take the market up. SPX is sitting on a support and since past 4 trading days it was tested. Today there was decreased volume but fall in price. I believe from here market should go up and we should see some few green candles. Also most of the big caps are waking up this should support upward movement.
Ideas for entertainment, they are not a trading advice

SPX---> watch the levelsSPX has shown a green doji today which ended near yesterday high, this is a bullish setup. I believe that today bears tried to bring market down but were not able to do it and bull has taken the control. Also there is good momentum as per momentum indicator . I believe market is ready to run to approx 4010.
Idea is for education and entertainment not a trading advice.
Best trading strategy can be a call credit around 4050 level with very recent expiration date.


4459 in Time . SP 500 3910 SP
4459 is first fib extension. Assuming the bounce from the .7 was enough to drive it there. Otherwise a retest of 3598 to 3398 is possible, with or without 4459.
Fundamentally, what the hell is going on in this world? Nothing makes sense. We're living in San Cliche. Up is down and left is right. Water still runs, follow the water. Looking at this as if it was a penny stonk, this looks bullish to me. So I'd be looking to hold and sell calls when nervous.

The last Upside Tasuki Gap ended with the 1987 crashSince January 1950 last week's weekly candle an Upside Tasuki Gap has only occurred 4 times. The last ended with the 1987 crash. Big whale just dumped hope it was not me having published this stat! CAVEAT EMPTOR. NOT ADVICE. DYOR.


What can we learn from World War II & a mix of todays VIX & SPXNOT ADVICE DYOR
See posting 27th August 2020 for bigger picture, and construction details.
Notice rise from low to high near same. Not Advice. DYOR.

Will the S&P500 churn out three Crazy Ivans next?Based on the experience of late 2018, some shit of this kind could come up next. Three Crazy Ivans in a row at least. Just an idea to check upon later. What do you think?

3200 are coming! The fear of a new corona wave swept through Wall Street on Monday, and the S&P500 fell back to levels from early August. The downward trend that has been going on for weeks since the high in the 3600-point range is thus continuing and reached our target zone.
However, further turbulence must still be taken into consideration. On the one hand, expectations regarding the resilience of the US economy are partially too high. On the other hand, the risks posed by the turmoil through the upcoming presidential election in early November are often underestimated. Further, the dispute over the successor to the late Constitutional Court judge Ruth Bader Ginsburg (aka Notorious RBG) could occupy the Senate so much that an agreement on a new economic stimulus program that has long been hoped for could be delayed for weeks.
Even though the Market reached the first target box, a lower level in the 3200 points range still needs to be expected before the S&P500 climbs back up. In both scenarios, we anticipate a bounce to at least 3440 points. Should the bulls not push through the resistance between 3434 – 3501 points, significantly lower quotations in the range of 2800 points become the next target.
In summary, we expect the S&P500 to bounce back toward 3430 points. Should the bulls not push through 3434 – 3501 points, a significant downward move towards 2800 points must be anticipated, bevor the decline since the highs is completed.
What do you think? Are you a buyer or a seller? Feel free to share your work and let us know in the comments section!
Wishing you all successful trades.


S&P 500 - Republican vs Democrat Win PredictionWith the US elections on the way, here is my predicted outcome by EOY for where S&P 500 is headed.
The assumptions proposed are based on a combined historical analysis of presidential elections, along with the oddities of the current "circus" of a market. This analysis has NO bias sentiment leaning toward either party, an is strictly based on historic trends of election years and election party switch years.
Note: This document is for information and illustrative purposes only. It is not, and should not be regarded as “investment advice” or as a “recommendation” regarding a course of action, including without limitation as those terms are used in any applicable law or regulation.

SnP500 Update. Where the heck is this train rocketing to? SPXThought I'd give you guys an update on SPX. Look, I don't think we are at the end of the train ride here. Choo-Choo!
This appears to me as a beginning of Wave 4 of 5, meaning that there is one more impulse at least before the roller coaster ends. RSI with no daily, weekly divergences. Fear and Greed Index is greedy but not extremely so. Now targets are fib trend extensions. The two targets are in ?dark blue/green. Invalidation in red. Expecting to reach either target at the two ?purple verticals. Let's see what Monday has in store for us.
