S&P500: Channel Down bottom and HL Support cluster. Buy?S&P500 hit today the HL trendline from the August 18th Low, while approaching the bottom of the Channel Down pattern. Despite this short term weakness, the 1D timeframe remains on neutral technicals (RSI = 46.932, MACD = 8.582, ADX = 32.119). This indicates that it may be an opportunity for sideways trading until we see a clear long term trend.
Consequently, we are buyers on this level, expecting a rebound to the top of the Channel Down and the 0.786 Fibonacci level (TP = 4,490).
Prior idea:
## If you like our free content follow our profile to get more daily ideas. ##
## Comments and likes are greatly appreciated. ##
Standardandpoor500

S&P 500, Ascending-Wedge-Formation, Crucial Determination!Hello,
Welcome to this analysis about the SPX 500 index and the 2-hour timeframe perspective. In recent times the index moved into a crucial determination as it is already overbought on the higher timeframes I also detected this main formation here that is likely to indicate a decisive reversal in this whole structure. Therefore as when looking at my chart, we can watch there how the Index is building this main ascending-wedge-formation marked with the boundaries in black and the coherent wave-count within. In the ascending-wedge the Index has already completed the waves A to C and is now about to complete the wave-D on which the wave-E follows up, when this wave-E has been completed in the upper resistance-cluster marked in red this will be the setup for this whole wedge-formation to complete which will happen with a pullback and when the Index then finally marked below the lower boundary of the wedge it will be the origin for further bearish continuations to the downside and appointing of the lower target zone between the 4525 and 4540 zones, once this has been reached it has to be elevated if the S&P 500 manages to reverse in the structure or just sets up for further continuations to the downside.
In this manner, thank you for watching the analysis, it will be great when you support it with a like, follow and comment for more upcoming market analysis, all the best!
"The high destiny of the market is to explicate, rather than to speculate."
Information provided is only educational and should not be used to take action in the markets.

The relief fizzles outThis week, we saw SPX move slightly lower. In addition to that, VIX gapped up on Tuesday and continued to move higher without filling the gap. Meanwhile, the relief fizzled out in China, leading to a rollover in the stock market indices like CSI 300 and Hang Seng. Considering American and Chinese markets are highly intertwined, we raise a word of caution over more weakness in the U.S. market.
Illustration 1.01
Illustration 1.01 shows the daily chart of VIX. The yellow arrow indicates an opening gap on Tuesday.
Illustration 1.02
Illustration 1.02 displays the daily chart of CSI 300. The yellow arrow indicates the initial spike after the regulator’s intervention in the market about two weeks ago.
Technical analysis gauge
Daily time frame = Neutral
Weekly time frame = Neutral
*The gauge does not necessarily indicate where the market will head. Instead, it reflects the constellation of RSI, MACD, Stochastic, DM+-, ADX, and moving averages.
Please feel free to express your ideas and thoughts in the comment section.
DISCLAIMER: This analysis is not intended to encourage any buying or selling of any particular securities. Furthermore, it should not be a basis for taking any trade action by an individual investor. Therefore, your own due diligence is highly advised before entering a trade.

S&P500: Last chance to hold this level and rise.S&P500 has turned neutral on the 1D timeframe (RSI = 46.008, MACD = 1.700, ADX = 33.340) after today's 1D candle crossed under the 1D MA50. To make matters worse, the 1D MACD is reversing and if the price doesn't rise, it will form the first Bearish Cross on such low level since June 10th 2022.
On the brightside, the 0.382 Fibonacci level is still holding, and if it continues to close candle over it, this correction will turn out to be just a minor pullback similar to January 19th. So until the bearish conditions emerge, we will be bullish, targeting the 1.236 Fibonacci extension (TP = 4,670).
## If you like our free content follow our profile to get more daily ideas. ##
## Comments and likes are greatly appreciated. ##

China's relief stagnates. Before the turnaround in SPX in July 2023, we pointed out to the roll over in the Chinese stock market and its implications for the U.S. market. Then more recently, we saw how these markets continue to be intertwined when Chinese regulator stepped in and calmed down the market, resulting in both American and Chinese stocks enjoying a relief (or perhaps even reversing). However, in the past three days, we started to notice that the momentum began to decrease in the Chinese indices. Therefore, we think it would be proper to wait a little bit more time before committing to the bullish outlook.
Illustration 1.01
The picture above shows the daily chart of MACD, which hovers just slightly below the midpoint. If it breaks above this level, it will bolster the bullish case in the short term. However, the failure will be strongly bearish.
Illustration 1.02
Illustration 1.02 shows the daily chart of the Hang Seng Index. The yellow arrows indicates the past three days, with each having a lower low than the prior one.
Illustration 1.03
Illustration 1.03 displays the daily chart of CSI 300. The yellow arrow highlights the initial spike in CSI 300 after the regulator’s intervention.
Technical analysis gauge
Daily time frame = Slightly bullish
Weekly time frame = Neutral
*The gauge does not necessarily indicate where the market will head. Instead, it reflects the constellation of RSI, MACD, Stochastic, DM+-, ADX, and moving averages.
Please feel free to express your ideas and thoughts in the comment section.
DISCLAIMER: This analysis is not intended to encourage any buying or selling of any particular securities. Furthermore, it should not be a basis for taking any trade action by an individual investor. Therefore, your own due diligence is highly advised before entering a trade.

S&P500:US Economic Indicators Reflect Growing Concerns Amidst...US Economic Indicators Reflect Growing Concerns Amidst Ongoing Challenges
As economic indicators unfold, the US economy grapples with a myriad of challenges, leaving forex traders and market participants in a state of heightened uncertainty. The week ahead presents a series of key data releases that shed light on the current economic landscape.
The latest predictions for the US Initial Jobless Claims for the week ending August 19th point to a figure of 240K, with Continuing Claims for the week ending August 12th anticipated at 1,708K. This comes after Initial Jobless Claims for the previous week were reported at 239K, and Continuing Claims for the week before at 1,716K. These figures provide insights into the ongoing dynamics of the job market, highlighting the impact of the economic challenges faced in recent weeks.
A significant concern is reflected in the forecast for US Preliminary Durable Goods Orders for July, which are expected to plummet by 4.0% on a monthly basis. Additionally, Durables Excluding Transportation are predicted to rise by a modest 0.2% monthly. This is in stark contrast to the strong performance observed in June, where Durable Goods Orders surged by 4.7% monthly, and Durables Excluding Transportation rose by 0.6%. Furthermore, Capital Goods Orders Non-Defense Excluding Aircraft for July are anticipated to inch up by only 0.1%, following a slightly stronger 0.2% increase in June.
The energy sector also remains in focus, with US Natural Gas Inventories for the week ending August 18th expected to stand at 33B cubic feet. This comes after a previous report indicated inventories of 35B cubic feet for the week ending August 11th.
These indicators collectively paint a picture of an economy grappling with challenges on multiple fronts. The US economy has been plagued by disappointing data, coupled with consumer debt levels reaching record highs. Sticky core inflation and positive surprises from other countries only add to the complexity. The US Federal Reserve has acknowledged the possibility of higher rates, even if a pause wouldn't indicate a reversal. Amidst this backdrop, the threat of stagflation looms large, a possibility that the markets may be underestimating.
As the forecast for the SP500 remains cautiously bearish, with consideration of the 38.2% Fibonacci levels, dynamic trendline, and support area, traders and investors find themselves at a critical juncture. Despite recent upward movement, the presence of these technical factors suggests the potential for a rebound in the nexts session, implying that the current phase might be a retracement rather than a complete reversal. The overall sentiment points toward ongoing challenges in the US equity markets, with potential implications for the foreseeable future.
✅ Please share your thoughts on S&P500 in the section below.
Don't Forget to LIKE this Idea and FOLLOW me !

VIX is not dropping yet, more panic is possibleSince our last update, the SPX has largely remained below the resistance near $4,527. Concurrently, the VIX has not shown a notable decrease, hinting at the possibility of more market panic and weakness in the SPX. That, combined with the fact that Chinese stocks continue to roll over, leaves us on high alert, and we are growing increasingly bearish in the short term. To bolster the bearish odds, we want to see the SPX break below the support near $4,458. Furthermore, we would like to see another spike in VIX. Contrarily, to support a bullish thesis, we would like to see SPX move above the resistance at $4,527 and hold there (ideally, being accompanied by a drop in VIX below $14.30).
Illustration 1.01
Illustration 1.01 shows the daily chart of VIX.
Technical analysis gauge
Daily time frame = Slightly bearish
Weekly time frame = Bullish
*The gauge does not necessarily indicate where the market will head. Instead, it reflects the constellation of RSI, MACD, Stochastic, DM+-, ADX, and moving averages.
Please feel free to express your ideas and thoughts in the comment section.
DISCLAIMER: This analysis is not intended to encourage any buying or selling of any particular securities. Furthermore, it should not be a basis for taking any trade action by an individual investor. Therefore, your own due diligence is highly advised before entering a trade.

FED's rate hike looms overToday's focal point rests on the Federal Reserve's (FED) highly anticipated Federal Open Market Committee (FOMC) meeting, which is widely expected to increase interest rates by 25 basis points. This decision would mark the 11th rate hike since inflation started to go rampant in the United States as a result of unprecedented quantitative easing following the outbreak of the Covid-19 pandemic, when the FED decided to nearly double its balance sheet in a matter of months, causing inflation to spike above 9% in June 2022. However, the consistent efforts of central bankers to fight inflation have brought down the inflation rate to merely 3% last month. That is a huge improvement, which puts the latest inflation print only 1% away from the FED’s desired target of 2%. Therefore, now is an unlikely time for the FED to stop and risk losing credibility in front of the entire world. Consequently, that will unleash more pressure on the U.S. economy, which has shown signs of contraction in the manufacturing sector for most of 2023 (only in April 2023, the S&P Global US Manufacturing PMI printed above 50 points). As a result, the chances of something snapping in the economy will continue to grow.
Illustration 1.01
Illustration 1.01 displays the daily chart of VIX, which can be seen making higher lows since 22nd June 2023.
Technical analysis gauge
Daily time frame = Bullish
Weekly time frame = Bullish
*The gauge does not necessarily indicate where the market will head. Instead, it reflects the constellation of RSI, MACD, Stochastic, DM+-, ADX, and moving averages.
Please feel free to express your ideas and thoughts in the comment section.
DISCLAIMER: This analysis is not intended to encourage any buying or selling of any particular securities. Furthermore, it should not be a basis for taking any trade action by an individual investor. Therefore, your own due diligence is highly advised before entering a trade.

SPX eyes $4,600. But can it make there?Yesterday, after the market close, International Business Machines, Netflix, and Tesla unveiled their earnings for the second quarter of 2023. Investors did not take this news positively, and shares of all three companies slumped in response. Today, in the pre-market, Netflix is down more than 8%, Tesla more than 4%, and IBM approximately 1%. More U.S. corporations are scheduled to report their earnings today, including Abbott Laboratories, Johnson & Johnson, and Philip Morris. In addition to that, today, we can anticipate crucial economic data, including updates on initial jobless claims and the Philadelphia FED Manufacturing Index. In regard to technical indicators, RSI traveled into the overbought territory on the daily chart while MACD and Stochastic continued to develop bullish structures. The price deviated too far from the 20-day SMA, which makes a case for a slight pullback before SPX continues higher. We will update our thoughts as the earnings season progresses further.
Illustration 1.01
Illustration 1.01 shows the daily chart of SPX and RSI. Yellow arrows indicate the first divergence between the price and RSI. Now, we will watch whether RSI can overtake its peak on 15th June 2023. If RSI crosses below 70 points, it will be bearish.
Technical analysis gauge
Daily time frame = Bullish
Weekly time frame = Bullish
*The gauge does not necessarily indicate where the market will head. Instead, it reflects the constellation of RSI, MACD, Stochastic, DM+-, ADX, and moving averages.
Please feel free to express your ideas and thoughts in the comment section.
DISCLAIMER: This analysis is not intended to encourage any buying or selling of any particular securities. Furthermore, it should not be a basis for taking any trade action by an individual investor. Therefore, your own due diligence is highly advised before entering a trade.

USA S&P 500 (US500) Index Analysis 05/01/2022Fundamental Analysis:
As we can see the Index has shown a very strong come back after the Covid-19 pandemic of March 2021 which caused the market to fall and create a panic to the world.
Since then there are lots of changes to the world and the way companies are operating, such as releasing of their premises and offices as they should have discharge lots of their employees and the work from home schemes was the main reason to cut the expenditure of these companies drastically down.
From the other hand, the market administration and governments including Banks has injected lots of funds and so called Rescue Packages and the market stimulant's packages to protect the Market from its Hard and Drastically fall to the lower levels and prevent a gigantic Global Markets Crises.
These funds and injection of the cash to these companies along side of cost deduction due to their risk measurement policies, forced these companies to invest the receiving funds in to the companies assets to protect themselves from the Pandemic Crises and hedged their exposed risks instead of investing these funds to the new Projects or renovations which could Couse their Share prices to appreciate intrinsically but instead these investments in the assets made an inflation to the prices of the assets and created a bobble in their share value and Prices without having any inheritance or intrinsic values.
so we can easily have a decision derived from the current situation that there has to be an other market fall and crises soon so the Price and its relevant intrinsic values get converged and market comes to its correct values.
we can observe the same situation in many different centralized markets such as Dow Jones and even other Stock Exchanges around the world like London and rest European market places to be in the same inflated status.
there exist a huge chance of an other Global Market Crises coming soon which has the domino effect and Couse the entire markets to fall for some times .
This fall of the market shall remove off the liquidity from the equity and debt market and streamflow them to some green heaven Asset classes including Gold and silver or even newly invented Technologies such as decentralized markets and Cryptocurrencies and DeFi.
if we have a look at the Current crypto's Total Crypto Market Capitalization we can see it has a very good chances of Rally Continuation to some very high levels such as 5 to 6 Trillion dollars or even much higher.
Gold even can see higher Prices such as 2500 USD per ounce which is currently ranging at 1800 USD.
we even can some how speculate a 3 world War to be the initiator of this Market fall which is even not so far from the reality as the situation in middle east is not very stable due to the Iran and Israel disputes and new anti-covid's restriction social movements in Europe and America continent.
we shall analyze few other markets and indices and ultimately Propose some Assets which are at their low Points Currently and can be counted as under values at present times.
Technical Analysis:
we have used the Fibonacci retracement and Expansion from the low to the Highest point before the Covid pandemic to have a better vision of the Higher expansion levels for the post retracement's rallies and identify the Potential Price levels and resistance zones. where the market can show some stagnation and starts its retracement and price correction to the lower levels.
There exist a Bearish Divergence of Price and MACD where Price has made higher high levels but MACD made lower Highs which is the most significant and strong Bullish Trend Reversal and start of Market fall and Price retracement and Value corrections.
there are total of 3 Targets defined which have a very strong Support tendencies which can be interpreted as the maximum retracements points.
there are few Resistance levels are also defined to have a better vision incase of Current Rally Continuation which eventually can be counted as the Trend reversal points

S&P500: Small pullback will provide the new buy entry.S&P500 reached the top of the four month Channel Up, remaining on heavily overbought technical indicators on the 1D timeframe (RSI = 75.225, MACD = 61.680, ADX = 45.310). As the 1D RSI is close to hitting the HH trendline that goes as back as November 2022, we expect a pullback, at least on the short term inside the Channel Up, first to drop the overbought indicators back to a balanced stated and secondly to form a HL on the Channel Up.
We are opening a sell on closing, aiming at a -2.60% (TP = 4,460) pull back which was the decline of the last correction. That will be a low risk buy opportunity (as long as the 1D MA50 holds) to target R1 (TP = 4,640).
If the candle closes under the 1D MA50 and S1, we will short and target the 1D MA200 on S3 (TP = 4,165), a potential correction that will neutralize finally the overbought 1D RSI.
Prior idea:
## If you like our free content follow our profile to get more daily ideas. ##
## Comments and likes are greatly appreciated. ##

S&P500 Last push before a 10 day correctionS&P500 / US500 is trading inside multiple Channel Up patterns, the shortest of them started on June 08.
Based on the first bullish wave of this pattern, the current leg is on the last spike before a correction.
You may buy now and target 4560, before the next short term buy opportunity emerges again in around 10 days on the 4hour MA100.
Follow us, like the idea and leave a comment below!!

S&P500: Targeting 4,570 but may take a while.S&P500 made a new yearly High today after the U.S. CPI report and solidified the 1D bullish technicals (RSI = 66.131, MACD = 48.400, ADX = 25.681). The MACD indicator if it makes a bearish cross, it will form a similar pattern to the start of May where it turned the index into a 2 week consolidation before making a new High.
We will wait for a pullback near the 1D MA100 before buying or will make a breakout buy if the price crosses over the R1. In either occassion, we will target near the top of the four month Channel Up (TP = 4,570).
Prior idea:
## If you like our free content follow our profile to get more daily ideas. ##
## Comments and likes are greatly appreciated. ##

Double-top on SPX?The previous week was filled with numerous data disclosures that provided deeper insights into the U.S. economy. Most notably, we saw the first month-over-month decline of the S&P Global Services PMI in 2023 (negatively affecting the S&P Global Composite PMI), a continuation of contraction in the manufacturing sector, and a slight decrease in the unemployment rate (from 3.7% in May 2023 to 3.6% in June 2023). Overall, the data has not proved recessionary yet. But with services slowing down, it would be appropriate to stay cautious and wait for more data to reveal underlying trends in the economy.
In our opinion, the current valuations for stocks seem overstretched (especially in the tech sector), and the replacement of fear and calls for a recession by the narrative dismissive of any danger to the U.S. economy could lead to a volatile concoction in the stock market. As a result, we are monitoring multiple technical indicators on a daily time frame, including RSI, MACD, and Stochastic. All three of these indicators show divergence with the price and point to the downside, which is not particularly bullish. In addition to that, SPX appears to be forming a double top, giving rise to an interesting setup if the pattern becomes valid.
Illustration 1.01
The picture above shows the mentioned setup. The bearish trigger becomes activated once the price breaks below Support 1.
Illustration 1.02
Illustration 1.02 shows nearly the perfect harmony between the decline from January 2022 until October 2022 and the rise from October 2022 until July 2022.
Technical analysis gauge
Daily time frame = Bullish (with signs of weakness)
Weekly time frame = Bullish
*The gauge does not necessarily indicate where the market will head. Instead, it reflects the constellation of RSI, MACD, Stochastic, DM+-, ADX, and moving averages.
Please feel free to express your ideas and thoughts in the comment section.
DISCLAIMER: This analysis is not intended to encourage any buying or selling of any particular securities. Furthermore, it should not be a basis for taking any trade action by an individual investor. Therefore, your own due diligence is highly advised before entering a trade.

S&P500 Will attempt to find Support near the 1day MA50S&P500 is so far on a flat 1day candle after a series of 3 red.
That keeps the price inside a Channel Up since March 13th and of course inside the longer term Channel Up since the October 13th market bottom.
The index should seek support on the 1day MA50 as it has done since March 30th, so that's a short term sell opportunity to 4330.
Consequently that will be the new Higher Low (bottom) on the Rising Support of the narrow Channel Up, hence a buy opportunity targeting Resistance A at 4500.
If the 1day candle gets closed under the 1day MA50 though, sell and target the bottom of the wide Channel Up and the 1day MA200 at 4150.
Follow us, like the idea and leave a comment below!!

Lots of data coming, questions over unemployment and servicesThis week, a barrage of U.S. data releases will help to shape investor sentiment. ISM Manufacturing PMI, ISM Manufacturing Employment, and S&P Global Manufacturing PMI are on today's schedule. Factory orders, FOMC minutes, and API crude oil stock change will follow on Wednesday. Then, on Thursday, imports, exports, ADP employment change, initial jobless claims, S&P Global Composite PMI, S&P Global Services PMI, ISM Services Employment, ISM Services PMI, and JOLTs job openings will be in focus. Finally, on Friday, average hourly earnings, non-farm payrolls, unemployment rate, and participation rate will be revealed (remember, we named only the most important data releases and not all that are scheduled for this week).
As the unemployment rate rose from 3.4% in April 2023 to 3.7% in May 2023, we are interested to see whether there was further growth in the metric. If yes, that will be a negative sign for the U.S. economy. The same will apply if there is any weakness in the services sector, which has been (so far) holding fairly strong compared to manufacturing. However, if the data will come in as expected (or better), it will likely provide more lift for the market. We will update our thoughts after today’s release.
Illustration 1.01
Illustration 1.01 displays the daily chart of SPX, two simple moving averages, and horizontal support/resistance levels. If SPX manages to hold above Resistance 1, it will be bullish. But if it fails, it will raise our concern about the rally’s breakdown.
Illustration 1.02
The picture above shows the unemployment rate in the United States since September 1998.
Technical analysis gauge
Daily time frame = Bullish
Weekly time frame = Bullish
*The gauge does not necessarily indicate where the market will head. Instead, it reflects the constellation of RSI, MACD, Stochastic, DM+-, ADX, and moving averages.
Please feel free to express your ideas and thoughts in the comment section.
DISCLAIMER: This analysis is not intended to encourage any buying or selling of any particular securities. Furthermore, it should not be a basis for taking any trade action by an individual investor. Therefore, your own due diligence is highly advised before entering a trade.

S&P500: One last pull back is possible before a new High.The S&P500 is pulling back following yesterday's July 4th holiday and seems to have reached a temporary top similar to May 1st. That was nearly a 1 month consolidation phase, which after testing the 1D MA50, it initiated the new bullish phase. Technically that was also the Higher Low of the four month Channel Up pattern.
The 1D technicals remain bullish (RSI = 67.005, MACD = 54.870, ADX = 30.096) and as long as they do, buying is favored. We expect this short term correction to test the S1 (4,330) and then rebound, which we will buy, to the R1 (TP = 4,500), which was the April 21st 2022 High.
Prior idea:
## If you like our free content follow our profile to get more daily ideas. ##
## Comments and likes are greatly appreciated. ##

S&P500 Holding the 4hour MA50 is criticalS&P500 / US500 crossed back over the 4hour MA50 and so far today is holding it.
For this level to stay as Support is critical as a 4hour candle close under it can delay the uptrend and send it to the 4hour MA200, 1day MA50 near the Rising Support.
In that case sell and target 4300.
As long as the 4hour MA50 holds, be bullish and target Resistance A at 4500.
The 4hour MACD is on a Bullish Cross, favoring a buy.
Previous chart:
Follow us, like the idea and leave a comment below!!

S&P500: First buy conditions following the top are emerging.The S&P500 is close to a -2.89% pull back, same as the April 26th, with the 1D technicals turning neutral (RSI = 56.566, MACD = 43.450, ADX = 27.595) for the first time since June 1st. This is a standard technical pull back inside the March Channel Up that is aiming at the bottom of the Channel and the 1D MA50, which is untouched since May 4th.
We will use both 4,330 and 4,270 for a double buy entry, targeting the R1 (TP = 4,500). Pay attention also at how the 1D RSI is on the HL trendline since March, an additional buy signal.
Prior idea:
## If you like our free content follow our profile to get more daily ideas. ##
## Comments and likes are greatly appreciated. ##

S&P500 Buy opportunity approachingThe S&P500 crossed under the MA50 (4h) and is approaching the bottom of the 1 month Channel Up.
That would complete a -2.60% decline from the top, which is consistent with the pull backs of late April and May.
Trading Plan:
1. Buy at 4340.
Targets:
1. 4515 (Resistance 1).
Tips:
1. The RSI (4h) gives the most optimal buy entry when it crosses under the 30.00 oversold level. If that happens near the bottom of the Channel Up, it will be an additional reason to buy.
Please like, follow and comment!!
Notes:
Past trading plan:

S&P500 On the 4hour MA50. Sell if this breaks.S&P500 / US500 almost touched today the 4hour MA50 for the first time since June 1st.
This is a Support and as long as it holds (along with the Channel Up), buy and target Resistance A at 4500.
If the price crosses under the Channel Up, sell and target the 1day MA50 at 4235.
If the 4hour RSI makes a Bullish Cross before 4235 gets hit, then book the profit on the short earlier and switch to buying again.
Previous chart:
Follow us, like the idea and leave a comment below!!

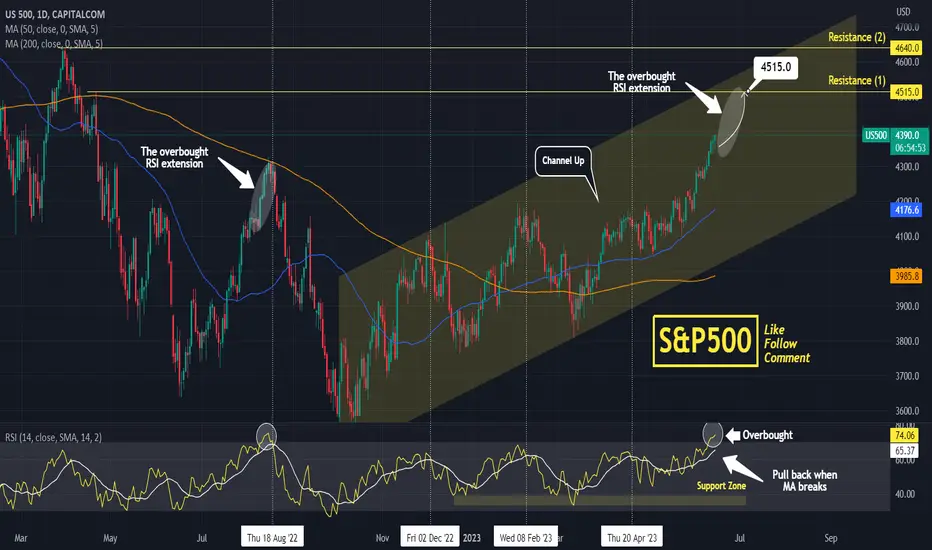
S&P500 RSI overbought but can give one last pushThe S&P500 is extending the rally inside the long term Channel Up.
The MA50 (1d) has been supporting and is untested since March 30th.
Such a strong rally undeniably created an overbought RSI (1d).
Last time the index gave a similar RSI pattern (August 10th 2022), the price gave a few more days of upside and one last push before a correction.
Trading Plan:
1. Buy on the current market price and as long as the RSI (1d) remains above its MA level.
Targets:
1. 4515 (Resistance 1 and April 21st 2022 top, near the top of the long term Channel Up).
Tips:
1. The RSI (1d) technically gives a signal that the uptrend is coming to a stop and a correction is starting, when it crosses under its MA level. Use this to your advantage in order to book the profit earlier if needed.
Please like, follow and comment!!
Notes:
Past trading plan:
S&P500 extending the Channel Up to 4390.The S&P500 index / US500 is extending the uptrend after crossing today over the 4330 Resistance of August 16th 2022.
The May Channel Up pattern may be transitioning to a more aggressive June Channel Up pattern supported by the 4hour MA50.
Our long term target is still a +8.90% rise from the last bottom on March 13th but are slightly downgrading it to 4390.
The 4hour RSI is also inside a Channel Up, with the current rise being similar to May 24th/28th.
Previous chart:
Follow us, like the idea and leave a comment below!!
