S&P500 This is why every CORRECTION is a GIFT.The S&P500 index (SPX) has been steadily rising since the April bottom to new All Time Highs (ATH). On the grand 100 year scale, the February - March tariff fueled correction, has been nothing significant. The last true technical correction has been the 2022 Inflation Crisis because it touched, and instantly rebounded on, the 1M MA50 (blue trend-line).
This is not the first time we bring forward our multi-decade perspective on stock and in particular this chart. But it serves well, keeping us into the meaningful long-term outlook of the market. This suggests that since the Great Depression and the first signs of recovery after the 1935 - 1941 Bear Cycle, the market has entered a multi-decade Channel Up, which is divided into long-term aggressive expansion periods (Bull Cycles) and shorter term depressions (Bear Cycles).
During a Bull Cycle, every test of the 1M MA50 is a instant cyclical buy opportunity and in fact that isn't presented very often. During a Bear Cycle, the market makes an initial aggressive correction below the 1M MA50, turns increasingly volatile for 5-7 years, trading sideways within the Channel Up with its second peak resulting into a 2nd correction that eventually breaks below the 1M MA200 (orange trend-line).
That is what we call a 'generational buy opportunity' as in the past 80 years, it has only been taken place 2 times.
Right now (again this is not something we mention for the first time), the market is at the start of the A.I. Bubble, with incredibly strong similarities with the Internet Bubble of the 1990s.
In fact, relative to the Internet Bubble, it appears that we are on a stage similar to 1993 - 1994, before the market turned parabolic to the eventual Dotcom Bust of 2000.
As a result, from a technical perspective, every 'small' correction such as the one we had this year, is a blessing in disguise (buy opportunity). As the index grew by 5 times during the Internet Bubble (300 to 1500), it is also very possible to see it approach this feat going from roughly 3500 (late 2022) to 14000 (by late 2032) and touch the top of the multi-decade Channel Up.
Are you willing to miss out on this generational wealth creation opportunity?
-------------------------------------------------------------------------------
** Please LIKE 👍, FOLLOW ✅, SHARE 🙌 and COMMENT ✍ if you enjoy this idea! Also share your ideas and charts in the comments section below! This is best way to keep it relevant, support us, keep the content here free and allow the idea to reach as many people as possible. **
-------------------------------------------------------------------------------
💸💸💸💸💸💸
👇 👇 👇 👇 👇 👇
Standardandpoors500

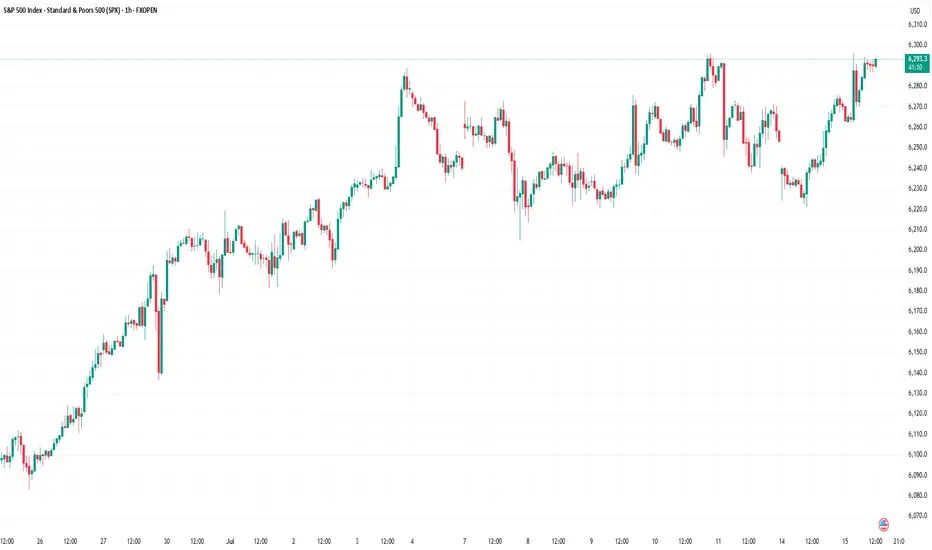
S&P500 Critical short-term crossroads.The S&P500 index (SPX) has been trading within a Channel Up since for the entirety of July and right now is ahead of important crossroads. It either breaks out above the pattern or pulls back to price a new Higher Low.
Based on the 4H CCI and the similarities with the June 24 - 25 consolidation, there are higher probabilities to break upwards. That fractal reached the 2.0 Fibonacci extension after it broke out. We will wait for confirmation and if it's delivered, we will buy the break-out and target 6460 (just below Fib 2.0 ext).
Until then, being so close to the Channel Up top, makes a solid short opportunity targeting a Higher Low (bottom). The previous one was priced exactly on the 4H MA100 (green trend-line) so that's our target or 6250 if it comes earlier.
-------------------------------------------------------------------------------
** Please LIKE 👍, FOLLOW ✅, SHARE 🙌 and COMMENT ✍ if you enjoy this idea! Also share your ideas and charts in the comments section below! This is best way to keep it relevant, support us, keep the content here free and allow the idea to reach as many people as possible. **
-------------------------------------------------------------------------------
Disclosure: I am part of Trade Nation's Influencer program and receive a monthly fee for using their TradingView charts in my analysis.
💸💸💸💸💸💸
👇 👇 👇 👇 👇 👇

Equity Markets Ahead of the US Inflation ReportEquity Markets Ahead of the US Inflation Report
Today at 15:30 GMT+3, the US inflation report (Consumer Price Index, or CPI) is scheduled for release. According to ForexFactory, analysts expect the inflation rate to rise from 2.4% to 2.6%.
The actual figures will provide market participants with grounds to debate not only the likelihood of a Federal Reserve rate cut, but also the evolving tensions between Donald Trump and Jerome Powell.
Should the report deliver any surprises, it will almost certainly trigger heightened volatility across the equity markets. For now, however, investors are seemingly optimistic about the upcoming fundamental data — especially given the commencement of Q2 earnings season, which lends additional weight to today’s macroeconomic indicators.
Technical Analysis of the S&P 500 Chart
The S&P 500 chart (US SPX 500 mini on FXOpen) shows the index fluctuating within a range defined by support at 6,222 and resistance at 6,290.
The upward impulses (as indicated by arrows) suggest that:
→ current market optimism, combined with the CPI release, may lead to a bullish breakout above resistance and the establishment of a new all-time high;
→ in a broader context, such a breakout could be interpreted as a continuation of the rally that began in April, following a period of consolidation between the aforementioned levels.
This article represents the opinion of the Companies operating under the FXOpen brand only. It is not to be construed as an offer, solicitation, or recommendation with respect to products and services provided by the Companies operating under the FXOpen brand, nor is it to be considered financial advice.
S&P500 Strong Buy Signal flashed for the 3rd time in 2 years!The S&500 index (SPX) is comfortably trading above its previous All Time High (ATH) and shows no signs of stopping here. Coming off a 1D MA50/ 100 Bullish Cross, we expect the 1D MA50 (blue trend-line) to turn now into the first long-term Support going towards the end of the year.
The last 1D MA50/ 100 Bullish Cross (December 15 2023) was nothing but a bullish continuation signal, which extended the uptrend all the way to the 2.0 Fibonacci extension, before a pull-back test of the 1D MA100 (green trend-line) again.
The 1W RSI is now on the same level (63.30) it was then. In fact it is also on the same level it was on June 05 2023, which was another such bullish continuation signal that peaked on the 2.0 Fib ext.
This suggests that we have a rare long-term Buy Signal in our hands, only the 3rd time in 2 years that has emerged. Based on that, we should be expecting to see 7600 as the next Target before it hits the 2.0 Fib ext and pulls back to the 1D MA100 again and there is certainly enough time to do this by the end of the year, assuming the macroeconomic environment favors (trade deals, potential Fed Rate cuts etc).
-------------------------------------------------------------------------------
** Please LIKE 👍, FOLLOW ✅, SHARE 🙌 and COMMENT ✍ if you enjoy this idea! Also share your ideas and charts in the comments section below! This is best way to keep it relevant, support us, keep the content here free and allow the idea to reach as many people as possible. **
-------------------------------------------------------------------------------
Disclosure: I am part of Trade Nation's Influencer program and receive a monthly fee for using their TradingView charts in my analysis.
💸💸💸💸💸💸
👇 👇 👇 👇 👇 👇

S&P500 Bullish Leg not over yet.The S&P500 index (SPX) has been trading within a Channel Up since the May 07 Low and is currently unfolding the latest Bullish Leg.
As you can see, it is far from having topped, not just by a plain trend-line (Higher Highs) perspective but also based on the Fibonacci and % rise terms relative to the previous Bullish Leg.
That peaked after a +7.10% rise, a little above the 3.0 Fibonacci extension. As a result, a 6330 Target on the short-term is more than fitting.
-------------------------------------------------------------------------------
** Please LIKE 👍, FOLLOW ✅, SHARE 🙌 and COMMENT ✍ if you enjoy this idea! Also share your ideas and charts in the comments section below! This is best way to keep it relevant, support us, keep the content here free and allow the idea to reach as many people as possible. **
-------------------------------------------------------------------------------
Disclosure: I am part of Trade Nation's Influencer program and receive a monthly fee for using their TradingView charts in my analysis.
💸💸💸💸💸💸
👇 👇 👇 👇 👇 👇

S&P 500 Sets New All-Time High, Surges Above 6200S&P 500 Sets New All-Time High, Surges Above 6200
The S&P 500 index (US SPX 500 mini on FXOpen) started the week by reaching a fresh all-time high. As shown on the chart, the index hit 6,210 points earlier this morning.
In addition to a reduced risk of US involvement in a large-scale war in the Middle East, market optimism has been fuelled by:
→ Tariff-related news. Last week, the US President announced the signing of a trade deal with China, while Treasury Secretary Scott Bessent expressed hope that the US would conclude trade negotiations with over a dozen countries by early September.
→ Strong corporate performance. On Friday, Nike (NKE) shares led the stock market, rising by more than 15% following an earnings report that exceeded analysts’ expectations. This could be boosting investor sentiment ahead of the upcoming earnings season.
Technical Analysis of the S&P 500 Chart
Evaluating the 4-hour chart of the S&P 500 index (US SPX 500 mini on FXOpen) in the context of June’s price movements reveals key reference points (marked on the chart) that outline an ascending channel. A consolidation zone, marked with an arrow, highlights a temporary equilibrium between supply and demand—after which buyers gained the upper hand, pushing the price upward.
It is possible that the ongoing bullish momentum could carry the price toward the upper boundary of the channel. However, attention should be paid to the RSI indicator, which suggests the market is heavily overbought; in fact, Friday’s reading marked the highest level of the year. In such conditions, a price correction cannot be ruled out—potentially back toward the local ascending trendline (shown in orange).
This article represents the opinion of the Companies operating under the FXOpen brand only. It is not to be construed as an offer, solicitation, or recommendation with respect to products and services provided by the Companies operating under the FXOpen brand, nor is it to be considered financial advice.

S&P500: Target Zone DeactivatedThe S&P 500 extended its bullish trend yesterday, moving beyond our now-deactivated (formerly magenta) Target Zone. Existing positions remain intact, as the stop set 1% above the upper boundary has not been triggered. In our updated primary scenario, we anticipate continued upward movement within magenta wave (B), potentially reaching the resistance at 6675 points. Once this peak is established, we expect a corrective decline to begin in the form of wave (C), which should guide the index into the green Long Target Zone between 4988 and 4763 points. There, the larger green wave is expected to complete. A sustained breakout above the 6675-point level would shift the outlook in favor of the alternative scenario. In that case, green wave alt. would be considered complete—a trajectory we currently assign a probability of 40%.
📈 Over 190 precise analyses, clear entry points, and defined Target Zones - that's what we do.

S&P500 1D Golden Cross, middle of 3y Channel, much upside to go!The S&P500 index (SPX) has been trading within a Channel Up since the final sell-off of the 2022 Inflation Crisis. The only time this pattern broke was for 4 days during the bottom formation (April 2025) of the recent Trade War.
Ahead of the first 1D Golden Cross since January 26 2023, the market looks more bullish than ever as it is trading within the 0.5 - 0.618 Fibonacci range of this Channel Up, suggesting that there is considerable upside before it tops.
The last Bullish Leg that started on the Channel Up bottom and peaked before a 1D MA50 (blue trend-line) test grew by +28.30%. Expecting a repeat of that, we may see the price targeting the 0.786 Fibonacci level at 6550 before the next 1D MA50 pull-back.
-------------------------------------------------------------------------------
** Please LIKE 👍, FOLLOW ✅, SHARE 🙌 and COMMENT ✍ if you enjoy this idea! Also share your ideas and charts in the comments section below! This is best way to keep it relevant, support us, keep the content here free and allow the idea to reach as many people as possible. **
-------------------------------------------------------------------------------
Disclosure: I am part of Trade Nation's Influencer program and receive a monthly fee for using their TradingView charts in my analysis.
💸💸💸💸💸💸
👇 👇 👇 👇 👇 👇

Stock Markets Rebound Following Trump’s Ceasefire AnnouncementStock Markets Rebound Following Trump’s Ceasefire Announcement
Last night, U.S. President Donald Trump made a social media post announcing a ceasefire agreement between Iran and Israel. According to his own words, the ceasefire is set to last “forever.” This announcement triggered a sharp bullish impulse (indicated by the blue arrow) on the S&P 500 index chart (US SPX 500 mini on FXOpen), pushing the price to a new high above the 6074 level.
Just yesterday, traders feared that the United States could be drawn into yet another costly war following bomber strikes on Iran’s nuclear facilities. However, today the stock markets are recovering, signalling growing optimism and a waning of fears over a major escalation of the conflict.
Technical Analysis of the S&P 500 Chart
When analysing the S&P 500 index chart (US SPX 500 mini on FXOpen) seven days ago, we identified an ascending channel. The angle of the trend remains relevant, while the width of the channel has expanded due to the downward movement caused by tensions in the Middle East.
Notably:
→ the price marked the lower boundary of the channel as well as the internal lines (shown by black dots) dividing the channel into quarters;
→ the latest bullish impulse suggests that the upward trend is resuming after breaking out of the correction phase (indicated by red lines).
It is possible that in the near future, the S&P 500 index (US SPX 500 mini on FXOpen) could reach the median line of the channel. There, the price may consolidate, reflecting a balance between buyers and sellers—particularly if the peace in the Middle East proves to be lasting.
This article represents the opinion of the Companies operating under the FXOpen brand only. It is not to be construed as an offer, solicitation, or recommendation with respect to products and services provided by the Companies operating under the FXOpen brand, nor is it to be considered financial advice.

S&P500 Channel Up buy opportunity.The S&P500 index (SPX) has been trading within a Channel Up and is now on a count (5) pull-back, breaking below its 4H MA50 (blue trend-line). As long as the 4H MA100 (green trend-line) holds, we expect the index to resume the uptrend, similar to the previous Bullish Leg of the Channel Up.
That Leg almost reached the 1.5 Fibonacci extension and made a Higher High. Our Target is marginally below the new 1.5 Fib ext at 6130.
-------------------------------------------------------------------------------
** Please LIKE 👍, FOLLOW ✅, SHARE 🙌 and COMMENT ✍ if you enjoy this idea! Also share your ideas and charts in the comments section below! This is best way to keep it relevant, support us, keep the content here free and allow the idea to reach as many people as possible. **
-------------------------------------------------------------------------------
Disclosure: I am part of Trade Nation's Influencer program and receive a monthly fee for using their TradingView charts in my analysis.
💸💸💸💸💸💸
👇 👇 👇 👇 👇 👇

S&P500 Giant Inverse Head and Shoulders waiting for its breakoutThe S&P500 index (SPX) appears to be forming the Right Shoulder of a long-term Inverse Head and Shoulders (IH&S), the pattern that made the April 07 bottom of the Tariff War correction.
Currently supported by both its 1D MA50 (blue trend-line) and 1D MA200 (orange trend-line), once the overhead Resistance/ neckline breaks, we expect a +24.55% rise to the 2.0 Fibonacci extension, the equivalent of the rise it made from the April bottom up until now.
The target given is 7400.
-------------------------------------------------------------------------------
** Please LIKE 👍, FOLLOW ✅, SHARE 🙌 and COMMENT ✍ if you enjoy this idea! Also share your ideas and charts in the comments section below! This is best way to keep it relevant, support us, keep the content here free and allow the idea to reach as many people as possible. **
-------------------------------------------------------------------------------
Disclosure: I am part of Trade Nation's Influencer program and receive a monthly fee for using their TradingView charts in my analysis.
💸💸💸💸💸💸
👇 👇 👇 👇 👇 👇

S&P500 6300 is the minimum short-term Target right now.The S&P500 index (SPX) is extending Friday's rebound on the 1D MA200 (orange trend-line) following an impressive rally after the April 07 bottom. That is technically the pattern's new Bullish Leg.
This quick consolidation technically resembles all 4 short-term pull-backs (blue circles) that took place since April 2023. The minimum % rise on those before they pulled back to the 1D MA50 (blue trend-line) again was +10%.
As a result, we expect 6300 to be the minimum Target by the end of July, which of course will be an All Time High.
-------------------------------------------------------------------------------
** Please LIKE 👍, FOLLOW ✅, SHARE 🙌 and COMMENT ✍ if you enjoy this idea! Also share your ideas and charts in the comments section below! This is best way to keep it relevant, support us, keep the content here free and allow the idea to reach as many people as possible. **
-------------------------------------------------------------------------------
Disclosure: I am part of Trade Nation's Influencer program and receive a monthly fee for using their TradingView charts in my analysis.
💸💸💸💸💸💸
👇 👇 👇 👇 👇 👇

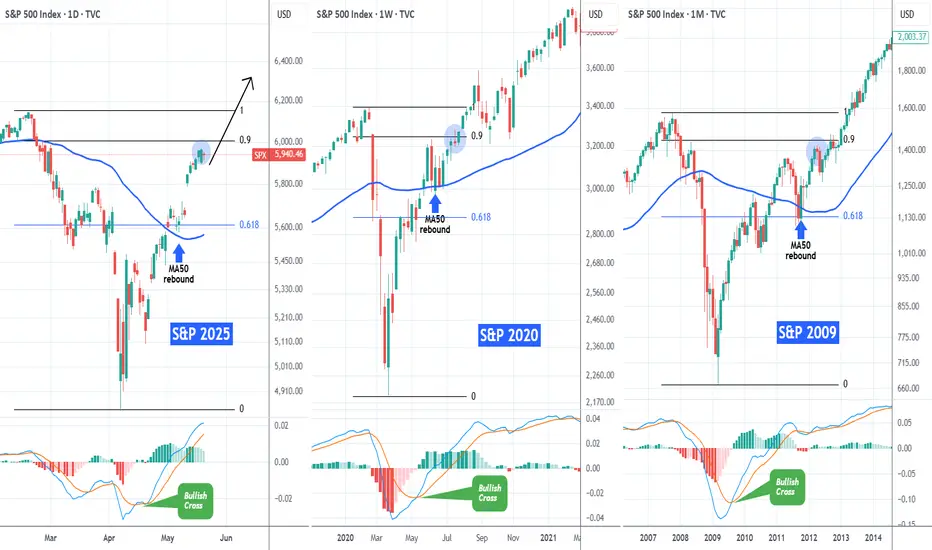
S&P500 Same recovery path with 2020 and 2009The S&P500 index (SPX) has recovered almost 90% of its losses since the February 19 2025 All Time High (ATH) and many have already started calling for a technical correction.
If we compare however this 2025 Tariff fueled correction with the recent most aggressive ones (COVID crash in 2020 and Housing Crisis 2008/2009) we see a different picture.
On their respective 0.9 Fibonacci levels (close to which we are today), both of those market recoveries went straight to new ATHs, without testing their MA50 (blue trend-line) until the next Cycle peak. They had that tested before when the price was trading near (or on)the 0.618 Fib. Notice also how a MACD Bullish on all three charts, confirmed the aggressive recovery pattern straight after the bottom.
Instead of a correction, history shows that we might be looking at new ATH soon.
-------------------------------------------------------------------------------
** Please LIKE 👍, FOLLOW ✅, SHARE 🙌 and COMMENT ✍ if you enjoy this idea! Also share your ideas and charts in the comments section below! This is best way to keep it relevant, support us, keep the content here free and allow the idea to reach as many people as possible. **
-------------------------------------------------------------------------------
💸💸💸💸💸💸
👇 👇 👇 👇 👇 👇
S&P500 Steady Channel Up to 6100The S&P500 index (SPX) has been trading within a Channel Up pattern from the moment (April 22) it broke above the 4H MA50 (blue trend-line). For that 1 month period, it has held the 4H MA50 and that maintains the bullish trend, generating Bullish Legs to High after High.
The last two Bullish Legs have increased by +4.92%, so as long as the 4H MA50 holds, we expect the current Leg to be completed at 6100.
-------------------------------------------------------------------------------
** Please LIKE 👍, FOLLOW ✅, SHARE 🙌 and COMMENT ✍ if you enjoy this idea! Also share your ideas and charts in the comments section below! This is best way to keep it relevant, support us, keep the content here free and allow the idea to reach as many people as possible. **
-------------------------------------------------------------------------------
Disclosure: I am part of Trade Nation's Influencer program and receive a monthly fee for using their TradingView charts in my analysis.
💸💸💸💸💸💸
👇 👇 👇 👇 👇 👇

S&P 500 Falls Following Downgrade of US Credit RatingS&P 500 Falls Following Downgrade of US Credit Rating
On Friday, 16 May, after markets had closed, Moody’s Ratings announced a downgrade of the long-term sovereign credit rating of the United States from the highest level of Aaa to Aa1. The key reasons cited by Moody’s were the rising national debt and interest payments, as well as expectations of a further increase in the budget deficit. Notably:
→ The downgrade was hardly a surprise. A similar move was made by Standard & Poor’s back in 2011, while Fitch Ratings followed suit in August 2023.
→ The official response may be seen as reassuring for market participants. US Treasury Secretary Scott Bessent played down concerns about the downgrade in an interview with NBC News, calling credit ratings “lagging indicators” and placing the blame on the previous administration.
→ Despite the downgrade, Moody’s acknowledged the US dollar’s role as the world’s reserve currency and stated that the United States “retains exceptional credit strengths, such as the size, resilience, and dynamism of its economy.”
Stock Market Reaction
The announcement triggered a negative market reaction, reflected in falling prices during Monday morning’s opening session. E-mini S&P 500 futures (US SPX 500 mini on FXOpen) retreated, as indicated by the arrow on the chart, pulling back from the highs reached by Friday’s close.
Last week, we pointed out signs of slowing momentum in the S&P 500 rally. Could the decline continue further?
Technical Analysis of the S&P 500 Chart
By drawing lines A, B, and C through the May rally peaks, we can observe a gradual flattening of the slope — suggesting that the bulls are losing momentum and confidence.
The price is currently trading between local lines C and C1, but it is reasonable to assume that the opening of the US session may bring renewed bearish pressure — potentially pushing the price lower, towards the bottom boundary of the broader upward channel (marked in blue).
This article represents the opinion of the Companies operating under the FXOpen brand only. It is not to be construed as an offer, solicitation, or recommendation with respect to products and services provided by the Companies operating under the FXOpen brand, nor is it to be considered financial advice.

S&P500 Historic reversals like this delivered even +100% gains!The S&P500 (SPX) is making a remarkable bullish reversal and on the monthly (1M) chart is even more evident due to April's candle, which almost closed flat leaving a huge wick under it, a feat we've never seen in recent history.
What we have seen however since the 2008 Housing Crisis, is every time the index hits (or approaches) its 1M MA50 (blue trend-line), it reverses to an incredible rally, technically a new Bull Cycle.
This is what happened in April, the index came a breath away from the 1M MA50 and delivered the strongest monthly bullish reversal of our time. On top of that, it hit and rebounded exactly on the former All Time High Resistance, which held and turned into Support. All such Resistance levels since 2008 have held. Also note that the only time the 1M MA50 really broke (closed the month below it), was during the March 2020 COVID flash-crash, which is a non-technical event/ irregularity and still it rebounded on the 1M MA100 (green trend-line).
The minimum long-term rise that SPX had after such correction was +76.20% and the maximum +104.17%. Assuming the minimum price increase for the current emerging rise, we expect the index to hit 8300 by late 2027.
-------------------------------------------------------------------------------
** Please LIKE 👍, FOLLOW ✅, SHARE 🙌 and COMMENT ✍ if you enjoy this idea! Also share your ideas and charts in the comments section below! This is best way to keep it relevant, support us, keep the content here free and allow the idea to reach as many people as possible. **
-------------------------------------------------------------------------------
💸💸💸💸💸💸
👇 👇 👇 👇 👇 👇

S&P 500 Index May Lose Upward MomentumS&P 500 Index May Lose Upward Momentum
Yesterday’s inflation data release held no major surprises, as the actual Consumer Price Index (CPI) figures came in close to analysts’ forecasts.
According to Forex Factory:
→ Annual CPI: actual = 2.3%, forecast = 2.4%, previous = 2.4%;
→ Monthly Core CPI: actual = 0.2%, forecast = 0.3%, previous = 0.1%.
Overall, stock indices rose yesterday, but according to media reports, this momentum may begin to slow in the near future:
→ UBS analysts downgraded their rating on US equities from “attractive” to “neutral” following the recovery from early April lows;
→ Goldman Sachs analysts believe that the US stock market rally could stall at current levels. In their view, the S&P 500 (US SPX 500 mini on FXOpen) is likely to reach 5900 over the next three months.
Technical Analysis of the E-Mini S&P 500 Chart
The chart provides more reasons to suggest that the current pace of growth may begin to slow.
Firstly, the index has entered a broad range between 5800 and 6120, where it spent a prolonged period during late 2024 and early 2025. This is a zone (highlighted in purple) where supply and demand previously reached a stable equilibrium — and similar balance could potentially emerge again.
Secondly:
→ the slope of the current upward channel (marked in black) appears excessively steep;
→ the RSI indicator points to a divergence;
→ the psychological level of 6000 may act as resistance.
Given the above, special attention should be paid to the scenario in which the S&P 500 (US SPX 500 mini on FXOpen) forms a short-term correction before the end of the month.
This article represents the opinion of the Companies operating under the FXOpen brand only. It is not to be construed as an offer, solicitation, or recommendation with respect to products and services provided by the Companies operating under the FXOpen brand, nor is it to be considered financial advice.

S&P500 Alert! Entering a medium-term SELL ZONE!The S&P500 index (SPX) has recovered the 0.786 Fibonacci retracement level, limiting the Trade War losses considerably. Trading this week above its 1W MA50 (blue trend-line), the index has confirmed that it resumed its long-term bullish trend.
On he medium-term though attention is needed as we're headed towards a range, which in the past 10 years has historically been an interim Sell Zone. That's the 0.786 - 0.9 Fibonacci range, which since the 2016 correction, it has always rejected the uptrend of a 1W MA200 (orange trend-line) led recovery.
On 3 out of 3 occasions so far (April 2016, June 2020, July 2023), every time the price tested the 0.9 Fib, it got rejected back to its 1W MA50 (blue trend-line). In 2023 the pull-back bottomed in 3 months but in 2020 and 2016 it took considerably less.
As a result, we call for caution near the 0.9 Fib for a potential medium-term pull-back but on the long-term the bullish trend is intact and historically it targets a minimum +27.74% from the All Time High (ATH), which is translated into a 7800 Target.
-------------------------------------------------------------------------------
** Please LIKE 👍, FOLLOW ✅, SHARE 🙌 and COMMENT ✍ if you enjoy this idea! Also share your ideas and charts in the comments section below! This is best way to keep it relevant, support us, keep the content here free and allow the idea to reach as many people as possible. **
-------------------------------------------------------------------------------
💸💸💸💸💸💸
👇 👇 👇 👇 👇 👇

S&P500 Stuck between the 1D MA50 and 1D MA200.The S&P500 index (SPX) is now on a short-term correction following the impressive recovery of the last 30 days that made it almost test its 1D MA200 (orange trend-line). This is a technical rejection but the fact that the 1D MA50 (blue trend-line) is now the Support can be encouraging.
The reason is that since January 2023, every time the index broke above its 1D MA50 it turned into a Support that held and produced an immediate bullish extension on every occasion except for one time (Sep 2024), which still recovered 1 week after.
As a result, it is more likely for SPX to test its All Time High (ATH) by July than entering a long-term correction again.
-------------------------------------------------------------------------------
** Please LIKE 👍, FOLLOW ✅, SHARE 🙌 and COMMENT ✍ if you enjoy this idea! Also share your ideas and charts in the comments section below! This is best way to keep it relevant, support us, keep the content here free and allow the idea to reach as many people as possible. **
-------------------------------------------------------------------------------
Disclosure: I am part of Trade Nation's Influencer program and receive a monthly fee for using their TradingView charts in my analysis.
💸💸💸💸💸💸
👇 👇 👇 👇 👇 👇

S&P500 1st 4H Golden Cross since Jan could be a TRAP!S&P500 (SPX) completed yearly today its first Golden Cross on the 4H time-frame since January 23. That formation issued an immediate pull-back but technically it's not very similar to the today's as that was formed after an All Time High (ATH) while now we are on the recovery phase after March's massive Trade War fueled correction.
The 4H Golden Cross however that looks more similar to the current is the one before January's, the August 21 2024. That was formed after a substantial market pull-back, though again not as strong as March's. Still, the 1D RSI patterns are also more similar and that again should keep us on high alert as 2 weeks later the index pulled back to the 0.5 Fibonacci retracement level from its previous High Resistance.
As a result, if we see the price now turning sideways for a week or so, we will give higher probabilities for a short-term pull-back, maybe not as low as the 0.5 Fib but at least to the 5450 region, before the market takes off to 6000.
-------------------------------------------------------------------------------
** Please LIKE 👍, FOLLOW ✅, SHARE 🙌 and COMMENT ✍ if you enjoy this idea! Also share your ideas and charts in the comments section below! This is best way to keep it relevant, support us, keep the content here free and allow the idea to reach as many people as possible. **
-------------------------------------------------------------------------------
Disclosure: I am part of Trade Nation's Influencer program and receive a monthly fee for using their TradingView charts in my analysis.
💸💸💸💸💸💸
👇 👇 👇 👇 👇 👇

S&P500 repeating the 2019 recovery-Can hit 7000.The S&P500 index (SPX) is making a remarkable recovery as it completed yet another strong 1W green candle last week following the rebound on its Higher Lows Zone, near the 1W MA200 (orange trend-line).
This is a mirror price action with the last 1W MA200 rebound of the 2016 - 2019 Bullish Megaphone pattern, which not only recovered its previous All Time High (ATH) but also peaked on the 1.618 Fibonacci extension before the eventual 2020 COVID crash.
As a result, we believe that a 7000 Target is a very plausible one on the long-term.
-------------------------------------------------------------------------------
** Please LIKE 👍, FOLLOW ✅, SHARE 🙌 and COMMENT ✍ if you enjoy this idea! Also share your ideas and charts in the comments section below! This is best way to keep it relevant, support us, keep the content here free and allow the idea to reach as many people as possible. **
-------------------------------------------------------------------------------
Disclosure: I am part of Trade Nation's Influencer program and receive a monthly fee for using their TradingView charts in my analysis.
💸💸💸💸💸💸
👇 👇 👇 👇 👇 👇

S&P 500 Analysis Ahead of the Busiest Week of Earnings SeasonS&P 500 Chart Analysis Ahead of the Busiest Week of Earnings Season
Despite the fact that President Trump’s earlier decision to impose tariffs (at higher rates than expected) shook the stock markets, the S&P 500 index (US SPX 500 mini on FXOpen) could still end April without significant losses (currently trading less than 2% below the month’s opening level) or even achieve a positive result.
According to media reports, around 180 S&P 500 companies are expected to release their quarterly earnings this week, including Apple (AAPL), Amazon (AMZN), Coca-Cola (KO), Eli Lilly (LLY), Meta (META), Microsoft (MSFT), and Chevron (CVX).
The share prices of these major companies — some of the largest by market capitalisation — could have a substantial impact on the S&P 500 index chart (US SPX 500 mini on FXOpen), given that their combined weight accounts for approximately a quarter of the index calculation.
Technical Analysis of the S&P 500 Chart
Based on the key price actions marked on the chart, we can identify a descending trend channel for the US stock market, which has been in effect since mid-February.
At the same time, the price has:
→ moved into the upper half of this channel, reaching its upper boundary;
→ found support around the median line (as evidenced by the price action on 21 April).
These are bullish signs, reinforced by the aggressive nature of the rebound from the psychological 5,000-point level, which acted as significant support in the first few days following the tariff announcement. Bears may still see an attractive opportunity to attempt to resume the downward momentum of the S&P 500 index (US SPX 500 mini on FXOpen), but will the fundamental backdrop support such a move?
From an optimistic perspective, sharp impulses driven by corporate news could lead to a breakout above the upper boundary of the red channel. This would likely be facilitated by important announcements (particularly from senior officials in the US, China, and Europe) regarding de-escalation of the tariff situation.
This article represents the opinion of the Companies operating under the FXOpen brand only. It is not to be construed as an offer, solicitation, or recommendation with respect to products and services provided by the Companies operating under the FXOpen brand, nor is it to be considered financial advice.

S&P500 Long and painful but necessary bottom formation.The S&P500 index (SPX) has been trading within a 2-year Bullish Megaphone pattern and the recent 2-month correction completed its latest Bearish Leg, as it reached the Higher Lows trend-line.
The massive rebound that took place there on April 07 may have turned out to be a highly volatile one but as mentioned on the title, it might be long and painful, but a necessary process nonetheless. That's mainly because it is the strongest correction since 2022 and the longest Bearish Leg of the pattern.
The market remains highly volatile until it gets a clear signal, bearish below the current Support of the 1W MA200 (red trend-line) or bullish above the 1D MA50 (blue trend-line). Despite the rather short-term uncertainty, the similarities with the Megaphone's previous bottom are uncanny, both having formed their Low on 1D RSI Double Bottom patterns.
Given that this previous Low initiated a massive +50% 1 year Bullish Leg/ rally, we expect to see at least 7100 on this next one by mid-2026.
-------------------------------------------------------------------------------
** Please LIKE 👍, FOLLOW ✅, SHARE 🙌 and COMMENT ✍ if you enjoy this idea! Also share your ideas and charts in the comments section below! This is best way to keep it relevant, support us, keep the content here free and allow the idea to reach as many people as possible. **
-------------------------------------------------------------------------------
Disclosure: I am part of Trade Nation's Influencer program and receive a monthly fee for using their TradingView charts in my analysis.
💸💸💸💸💸💸
👇 👇 👇 👇 👇 👇
