This signal on VIX can sustain the S&P500 rally.We don't often look at VIX but the times we do, it never fails to offer valuable insight regarding the long-term factors on stock indices trends. Since March, may have left wondered why the S&P500 (blue trend-line) has took off so considerably without any meaningful pull-back. Well despite the prevailing fundamentals surrounding the market overall, VIX (candles) has considerably calmed down, meaning that the market volatility has decreased, something that accelerated in early April when it broke below a Higher Lows trend-line that was holding for 5 years (since the November 2017 bottom).
This is a strong reason that keep adding fuel to this S&P500 rally and can continue to sustain it for as long as VIX declines. In fact the last time we saw VIX breaking below such a strong long-term Higher Lows trend-line was in July 2009, four months after the bottom of the 2008 Housing Crisis. The index has started its long-term recovery into a historically long and strong Bull Cycle and every spike on VIX was a medium-term pull-back on the S&P500 and a buy opportunity.
This fractal similarities is additional proof that the index is decisively past its 2022 Bear Cycle and is most likely starting a new multi-year Bull Cycle. If you are a long-term investor, pay attention to VIX's spikes in order to take advantage of medium-term buy opportunities.
-------------------------------------------------------------------------------
** Please LIKE 👍, FOLLOW ✅, SHARE 🙌 and COMMENT ✍ if you enjoy this idea! Also share your ideas and charts in the comments section below! **
-------------------------------------------------------------------------------
💸💸💸💸💸💸
👇 👇 👇 👇 👇 👇
Standardandpoors500

S&P500 could start a 1 month correction.The S&P500 hit both targets we set two weeks ago as it reached the top of the 7 month Channel Up pattern:
This is the first major sell signal that we get on the 1D time-frame since the previous Higher High on February 02 2023. Unless the price closes a 1D candle above the August 16 2022 High (4327), we expect a short-term pull-back towards the 1D MA50 (blue trend-line) and Inner Higher Lows 1. Our Target is 4200. This sell signal will be invalidated if we close above 4327.
If we close a 1D candle below the Inner Higher Lows 2, we will re-sell and target the 1D MA200 (orange trend-line) and bottom of the Channel Up at 4000.
-------------------------------------------------------------------------------
** Please LIKE 👍, FOLLOW ✅, SHARE 🙌 and COMMENT ✍ if you enjoy this idea! Also share your ideas and charts in the comments section below! **
-------------------------------------------------------------------------------
💸💸💸💸💸💸
👇 👇 👇 👇 👇 👇

$spx back to 3k?note: the CBOE:SPX avwap from the previous financial crash in 2008 has been a buy whenever the retrace has aligned with the golden pocket.
Could be a nice HKEX:1000 move coming if the short setup comes into play

S&P500 Closed above the 1W MA100 after almost 300 days.Major bullish signal for the S&P500 (SPX) as it closed a 1W (weekly) candle above the 1W MA100 (green trend-line) for the first time since the week of August 15 2022. That was the weekly candle that formed the next Resistance 1 in line, the 4330 level (Aug 16 High).
The 1W RSI has already broken above its Rising Wedge since two weeks ago and the 4330 Resistance 1 test seems inevitable. That will be the final barrier before testing the 4640 level of Resistance 2 (March 28 2022 High).
Needless to say, the index is long past the Bear Cycle, having broken above the Lower Highs trend-line, with the 1W MA50 (blue trend-line) in Support. The target of the Inverse Head and Shoulders pattern (Fibonacci 2.0) is marginally above Resistance 2.
-------------------------------------------------------------------------------
** Please LIKE 👍, FOLLOW ✅, SHARE 🙌 and COMMENT ✍ if you enjoy this idea! Also share your ideas and charts in the comments section below! **
-------------------------------------------------------------------------------
💸💸💸💸💸💸
👇 👇 👇 👇 👇 👇

S&P500 Rising Wedge's short-term pull-back to the 1D MA50The S&P500 index (SPX) gave us the expected pull-back and buy entry within the Rising Wedge as per our last week analysis (chart below):
The long-term structure is a Channel Up, so plan your trades in case of a Rising Wedge break-out. On the short-term, we expect the price to pull-back to the 1D MA50 (blue trend-line) and the bottom of the Rising Wedge at 4140. As long as the pattern holds, buy and target the top at 4250. If the top of the Wedge breaks, target 4295m just shy off the long-term Resistance of 4327 (August 15 2022 High).
We will sell on the medium-term only if the price breaks below Support Zone 1 and target the 1D MA200 (orange trend-line), above Support Zone 2 and at the bottom of the long-term Channel Up. The 1D RSI Triangle pattern can give an early signal with regards to the direction in case of a break-out.
-------------------------------------------------------------------------------
** Please LIKE 👍, FOLLOW ✅, SHARE 🙌 and COMMENT ✍ if you enjoy this idea! Also share your ideas and charts in the comments section below! **
-------------------------------------------------------------------------------
💸💸💸💸💸💸
👇 👇 👇 👇 👇 👇

S&P500 New Bullish Cross can take it higher.The S&P500 index (SPX) hit last week our long awaited 4190 target, a level we set 2 months ago (see idea below):
That trade was taken right before the 1D MACD formed a Bullish Cross, the 2nd within the long-term Channel Up pattern. Last Thursday, the index completed the 3rd Bullish Cross of the Channel Up and continues to rise within a shorter term Rising Wedge.
With the 1D MA50 (blue trend-line) intact as a Support since March 29, and the price breaking above the (former) 4195 Resistance, we remain bullish and will buy again: a) if the price pulls back near the bottom of the Rising Wedge and target 4250 or b) if it closes a 1D candle above the Rising Wedge and target 4280 (top of Channel Up).
Similarly, we will sell the break-out if it closes below the 1D MA50 and target the bottom of Support Zone 2 and the Channel Up (Higher Lows trend-line) at 3950.
-------------------------------------------------------------------------------
** Please LIKE 👍, FOLLOW ✅, SHARE 🙌 and COMMENT ✍ if you enjoy this idea! Also share your ideas and charts in the comments section below! **
-------------------------------------------------------------------------------
💸💸💸💸💸💸
👇 👇 👇 👇 👇 👇

S&P500 The Cup pattern that nobody notices!We have been so focused on the short-term Channel Up on the S&P500 (SPX) since March (see idea below) that we didn't publish any analysis on the longer term dynamics:
This analysis offers critical insight on where we are with regards to the long-term/ Cyclical trend. One parameter that stands out is that the S&P500 index has failed on two occasions to break the 1W MA50 (red trend-line) since August 26 2022. It just so happens now that the 1W MA100 is exactly on Resistance 1 (February 02 High). A break above it is a buy break-out signal targeting Resistance 2 (4330).
However, it is equally probable to see a medium-term pull-back since, as you see on the chart, the curved Support Zone (dotted) that is connecting all the Lower Lows since December 2021 and provided all counter-trend rallies so far goes through th 1D MA200 (orange trend-line). A bounce there (could be within 3980 - 4000), confirms the pattern and would make the Channel's new Higher Low. If it breaks though, expect the 3810 Support 1 to be tested.
Notice also that the RSI on the 1W time-frame is approaching its own Higher Lows Zone, which has been a Buy Zone for exactly 1 year!
-------------------------------------------------------------------------------
** Please LIKE 👍, FOLLOW ✅, SHARE 🙌 and COMMENT ✍ if you enjoy this idea! Also share your ideas and charts in the comments section below! **
-------------------------------------------------------------------------------
💸💸💸💸💸💸
👇 👇 👇 👇 👇 👇

S&P500 The weekly chart puts everything into perspectiveAlmost 2 months ago and the S&P500 (SPX) hasn't diverged from our original idea, after buying the bottom of the 6-month Channel Up:
We believe that looking into the 1W (weekly) time-frame again will help at giving a fresh outlook and technically the best illustration of the current situation. First we narrowed the Channel Up to the candle bodies and treat the wicks as pressure points only.
As you see, the 1W MA100 (green trend-line) is the key element here as it has been the Resistance since the 1W candle of August 22 2022. The price came very close to breaking it on three 1W candles: September 12 2022, January 30 2023 and last week (May 01 2023).
Our trading plan is simple. If SPX closes a candle above the 1W MA100, we will buy the break-out and target the 4327 Resistance (August 16 High). Until then, we will wait for 4020 and buy at the bottom of the 1 month Megaphone pattern, approximately near the 1D MA200. In that case the bullish target will be the 4195 Resistance.
-------------------------------------------------------------------------------
** Please LIKE 👍, FOLLOW ✅, SHARE 🙌 and COMMENT ✍ if you enjoy this idea! Also share your ideas and charts in the comments section below! **
-------------------------------------------------------------------------------
💸💸💸💸💸💸
👇 👇 👇 👇 👇 👇

S&P500 Megaphone pattern on 4H.The S&P500 (SPX) has had an excellent run following our buy call more than one month ago:
Right now we see a Megaphone pattern in formation on the 4H time-frame and with the price above the 4H MA50 (blue trend-line) and with the 4H MA200 (orange trend-line) holding since March 29, we are targeting the top (Higher Highs trend-line) at 4200.
If the price closes above the Megaphone we will buy again, targeting the top of the long-term Channel Up at 4270. Similarly we will go short if we close below the 4H MA200 and target 4040. If the price breaks below the Megaphone we will sell again, targeting the bottom of the long-term Channel Up at 3930.
-------------------------------------------------------------------------------
** Please LIKE 👍, FOLLOW ✅, SHARE 🙌 and COMMENT ✍ if you enjoy this idea! Also share your ideas and charts in the comments section below! **
-------------------------------------------------------------------------------
💸💸💸💸💸💸
👇 👇 👇 👇 👇 👇

S&P500 Sell signal confirmedThe S&P500 (SPX) has had an excellent run following our buy call more than one month ago:
Yesterday though it flashed a sell confirmation as the price broke and closed below the Higher Lows trend-line of the recent Channel Up bottom. Both previous times this happened (December 06 2022 and February 17 2023, it was a major sell signal towards a new Channel Up (Higher) Low. Additionally, the 1D MACD has made a Bearish Cross.
The Support Zone 1 that is currently being tested, has on those previous fractals provided the first layer of accumulation that later broke and targeted both the 1D MA50 (blue trend-line) and 1D MA200 (orange trend-line).
Our target is 3915, just above Support Zone 2, which was hit during both previous corrections.
Invalidation of this pattern will happen if a 1D candle closes above the Lower Highs trend-line, in which case the 4195 Resistance will be targeted.
-------------------------------------------------------------------------------
** Please LIKE 👍, FOLLOW ✅, SHARE 🙌 and COMMENT ✍ if you enjoy this idea! Also share your ideas and charts in the comments section below! **
-------------------------------------------------------------------------------
💸💸💸💸💸💸
👇 👇 👇 👇 👇 👇

S&P500 Cyclical buy signal starting next monthThis analysis is basically an extension of the study we published last week, explaining how the index is starting an aggressive expansion:
Based purely on the 3W time-frame, now we have incorporated the Sine Waves to clearly display the cyclical buy/ sell pattern inside the long-term Channel Up that started at the bottom of the Housing Crisis (March 2009).
As this shows, for the past 10 years, the bottom of the Cycles is where investors should consider to start buying, while the top is where they should consider to start selling. The last sell signal was given on October 25 2021 and the next buy signal will be flashed on May 30 (2023).
With the index trading around the 3W MA50 (blue trend-line) since it rebounded off the market bottom (October 2022), this price action may imply that the market is in anticipation of the big move. This cyclical buy signal may just be the trigger it needs.
-------------------------------------------------------------------------------
** Please LIKE 👍, FOLLOW ✅, SHARE 🙌 and COMMENT ✍ if you enjoy this idea! Also share your ideas and charts in the comments section below! **
-------------------------------------------------------------------------------
💸💸💸💸💸💸
👇 👇 👇 👇 👇 👇

S&P500 Don't sell before this line breaksThe S&P500 (SPX) has had an excellent run following our buy call exactly one month ago:
The confirmation for the buy was given by the 1D RSI Bullish Cross. As the price is approaching the top of the Channel Up, which is projected to be within 4230 - 4250, we start looking for signals to sell. Naturally the 1D RSI giving the opposite signal (Bearish Cross) will be a confirmation. As you see, the previous two RSI Bearish Crosses have been the two major sell signals within this 6-month Channel Up and have been formed straight after the price broke below the Higher Lows trend-line from the previous Higher Low.
Right now the price as supported by the Higher Lows trend-line and as long as it does, we will continue taking small buys towards the top. We will sell after its breaks below the Higher Lows and the RSI makes the Bearish Cross. Potential target 3930.
-------------------------------------------------------------------------------
** Please LIKE 👍, FOLLOW ✅, SHARE 🙌 and COMMENT ✍ if you enjoy this idea! Also share your ideas and charts in the comments section below! **
-------------------------------------------------------------------------------
💸💸💸💸💸💸
👇 👇 👇 👇 👇 👇

S&P500 starting an expansion the likes of which we've never seenThe S&P500 index (SPX) is trading on a multi-year Channel Up pattern that started on the March 2009 bottom of the Housing (subprime mortgage) Crisis. With all the talk lately on whether or not the index is out of its Bear Phase, this chart can offer great insight on the long-term trend.
As you see, it shows that the Bear Market's bottom was priced in September 2022 exactly on the 1M MA50 (blue trend-line), which has served as a Support both on December 2018 (peak of U.S. - China trade war) and January 2016 (China's slowdown, VW scandal, Oil crash). As we are all aware March 2020 was an exception (black swan event) that happens once in a hundred years. Still the 1M MA100 (green trend-line) supported.
The key here is the 3W RSI. It is trading within a Channel Down and every time the price hit its bottom, a multi-month rally started. The last two times that rally peaked on the 3.0 Fibonacci extension. Calculating the new 3.0 Fib from the 4840 top to the 3500 bottom, it gives roughly a 9000 projection. So since this is only the start on this Expansion Phase within the multi-year Channel Up pattern, it is not at all unlikely to expect steady growth from the current levels and a rough 9000 peak by 2027.
-------------------------------------------------------------------------------
** Please LIKE 👍, FOLLOW ✅, SHARE 🙌 and COMMENT ✍ if you enjoy this idea! Also share your ideas and charts in the comments section below! **
-------------------------------------------------------------------------------
💸💸💸💸💸💸
👇 👇 👇 👇 👇 👇

S&P500 FIrst time in 2 weeks to hit the 4H MA50The S&P500 index (SPX) has extended its rise since our buy call 21 days ago:
The price is at the moment on the 4H MA50 (blue trend-line) for the first time since March 28. The Higher Lows trend-line below offers an additional Support level, with the last resort being the 4H MA200 (orange trend-line) below, in case the 4H RSI breaks towards the Green Zone. Regardless of this minor technical pull-back, our Target remains 4190 just below the Resistance (February 02 High), with the Higher High extension of the Channel Up showing potential for even 4250.
-------------------------------------------------------------------------------
** Please LIKE 👍, FOLLOW ✅, SHARE 🙌 and COMMENT ✍ if you enjoy this idea! Also share your ideas and charts in the comments section below! **
-------------------------------------------------------------------------------
💸💸💸💸💸💸
👇 👇 👇 👇 👇 👇

S&P500 Short-term pull-back possible but bullish target intactThe S&P500 has extended its rise since our buy call 11 days ago:
We are slightly modifying the technical parameters within this Channel Up that started back in November as the 1D RSI broke above its 3-week Resistance and on the previous bottom fractal of late December/ early January that translated into a price Resistance rejection and pull-back short-term to the 0.5 Fibonacci retracement level. From the current 4080 Resistance, the 0.5 Fib is at 3945.
This doesn't negate our long-term outlook, which is bullish towards a new Higher High within this Channel Up. Our target is for safety at 4190 (below the 4195 Resistance), but the technical wave can extend as high as +11.00% from the bottom (as the previous two Higher High waves did) and hit 4230.
-------------------------------------------------------------------------------
** Please LIKE 👍, FOLLOW ✅, SHARE 🙌 and COMMENT ✍ if you enjoy this idea! Also share your ideas and charts in the comments section below! **
-------------------------------------------------------------------------------
💸💸💸💸💸💸
👇 👇 👇 👇 👇 👇

S&P500 Buy without fear. Bull not over until 2030.This is not the first time we look into the S&P500 (SPX) from a multi-decade perspective. Every time we look into the Cycles since the Great Depression we bring an additional element to the table. This time we break down parts of those Cycles even more and look into the RSI as well. This analysis will attempt to shed light into the doubt of, perhaps the majority of the market, whether or not stocks are out of the 2022 correction.
** Bear and Bull Cycles **
As you see since 2029 and the Great Depression, the index has formed three Bear and three Bull Cycles. We are currently on Bull Cycle 3. When the price breaks above the Bear Cycle Top, the Phase 1 of the Bull Cycle starts and has historically lasted 85-89 months (ends with the first major correction). Phase 2 (orange Rectangle) which starts straight after and ends on the second major correction, lasts within 31 - 35 months. Phase 2 typically ends around the middle of the Bull Cycle.
** The RSI recurring patterns **
Besides the above Cyclical symmetry, the 1M RSI has been extremely consistent throughout these Cycles. As shown, the Bear Cycle Bottom breaks well below the 30.00 barrier and touches 20.00 (extremely oversold conditions). The Bull Phases 1 and 2 are formed while the RSI is on Lower Lows.
** Conclusion **
From the above characteristics and parameters, we can easily draw the conclusion that the 2022 correction was Phase 2 of the Bull Cycle and we won't be seeing its bottom in a very long time. More specifically not before 2031, as Bull Cycles 1 and 2 formed their Tops a little after Fibonacci 2.5 time extension. On Bull Cycle 3 (current) this is on January 2031.
This is in our opinion the ultimate S&P500 cheat-sheet and the reason you may invest with no fear. What do you think?
-------------------------------------------------------------------------------
** Please LIKE 👍, FOLLOW ✅, SHARE 🙌 and COMMENT ✍ if you enjoy this idea! Also share your ideas and charts in the comments section below! **
-------------------------------------------------------------------------------
💸💸💸💸💸💸
👇 👇 👇 👇 👇 👇

S&P500 is pricing the new Low of the bullish leg.The S&P500 (SPX) hit today the 4H MA50 (blue trend-line) again and the Higher Lows since the March 13 bottom. That was a bottom on the 5-month Channel Up and the best buy opportunity on a 1 month time-frame.
With the 4H RSI sequence similar to the Higher Lows of the previous bullish leg in late December/ early January, we see SPX attempting to price the new Low. This is a new buy opportunity. Our long-term target of 4190 is intact.
-------------------------------------------------------------------------------
** Please LIKE 👍, FOLLOW ✅, SHARE 🙌 and COMMENT ✍ if you enjoy this idea! Also share your ideas and charts in the comments section below! **
-------------------------------------------------------------------------------
💸💸💸💸💸💸
👇 👇 👇 👇 👇 👇

S&P500 Buy the 4hour MA50 pullbackThe S&P500 failed to close over the 4hour MA200 and is pulling back to the 4hour MA50.
Buy this pull back as it is not only near the 0.5 Fibonacci level but also the Cup pattern's Support.
Target Resistance A at 4080.
Previous chart:
Follow us, like the idea and leave a comment below!!

S&P500 Best buy signal since early January.The S&P500 index (SPX) is on a 1 week rebound following the March 13 Low which was made on Support Zone 2 and is so far on the bottom of the 5-month Channel Up. All candles have closed inside this pattern and as you see so far every bearish and bullish wave follows similar structure as the previous one.
We are near the best buy signal since January 06 as the 1D MACD is above to form a Bullish Cross. Our short-term target is the 1D MA50 (blue trend-line) and medium-term 4190 (near Resistance).
-------------------------------------------------------------------------------
** Please LIKE 👍, FOLLOW ✅, SHARE 🙌 and COMMENT ✍ if you enjoy this idea! Also share your ideas and charts in the comments section below! **
-------------------------------------------------------------------------------
💸💸💸💸💸💸
👇 👇 👇 👇 👇 👇

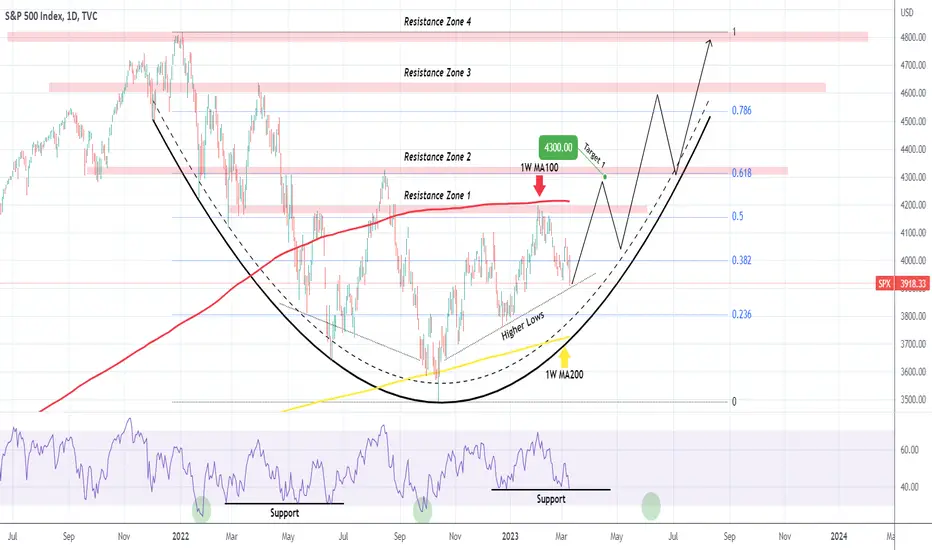
S&P500 is a perfect buy here long-term in this Cup pattern.The S&P500 is on a medium-term correction following the February 02 rejection just below the 1W MA100 (red trend-line). The long-term pattern is a Cup formation and the price is approaching its buy Zone.
Right now though it sits on the Higher Lows trend-line that has formed the medium-term Channel Up and is an ideal buy for the long-term, with limited downside. The 1D RSI is on the December Support and if the perfect symmetry with the downtrend of the Bear Cycle holds, it means it is on an the inverse path of February 22 - June 16 2022.
There are obvious Resistance Zones within the Cup pattern, while also the Fibonacci retracement levels align very well. Buy and target next the 0.618 Fib and the bottom of Resistance Zone 2 at 4300. That is marginally below the August 16 High.
-------------------------------------------------------------------------------
** Please LIKE 👍, FOLLOW ✅, SHARE 🙌 and COMMENT ✍ if you enjoy this idea! Also share your ideas and charts in the comments section below! **
-------------------------------------------------------------------------------
💸💸💸💸💸💸
👇 👇 👇 👇 👇 👇
S&P500 Perfectly following the long-term planIt is more than a week ago that we called the exact bottom buy on the S&P500 (SPX) index:
Our first target (4050) has been hit and the 'Powell pull-back' is giving us a new opportunity to enter. As you seethe 1D RSI rebounded exceptionally on the Support provided by the December 19 Low and what's left now is only for the 1D MACD to make a Bullish Cross and solidify the new bullish wave to the new Higher High of the Channel Up.
The previous rise topped on the 1.618 Fibonacci extension, so Target 1 now is 4170. If then we close above the 4,195 Resistance, we will take one final short-term buy targeting 4250 (Target 2).
-------------------------------------------------------------------------------
** Please LIKE 👍, FOLLOW ✅, SHARE 🙌 and COMMENT ✍ if you enjoy this idea! Also share your ideas and charts in the comments section below! **
-------------------------------------------------------------------------------
💸💸💸💸💸💸
👇 👇 👇 👇 👇 👇

S&P500 The huge Inverse H&S has started and its target is 4700!Last week we have made clear our short/ medium-term view on the S&P500 (SPX), calling a buy on the exact bottom of the Channel Up:
It is time to look again, as we normally do on a monthly basis, on the bigger picture, looking at the 2D time-frame. The Channel Up is clear and so is the Resistance on the 2D MA200 (orange trend-line) which formed the previous High in February. The rebound was achieved exactly on the 2D MA50 (blue trend-line).
The long-term pattern that stands out is the huge Inverse Head and Shoulders (IH&S) whose head was the bottom of the Bear Cycle, which after breaking its Lower Highs trend-line completed the Right Shoulder. Technically this suggests that the price should now begin its rise to its usual target. That is the 2.0 Fibonacci extension level and is exactly on the $4700 mark.
The Fibonacci retracement levels from the Top-Bottom of the Bear Cycle have so far matched Support and Resistance levels with high accuracy, so keep those in mind for the next immediate High, e.g. on the 0.618 Fib at 4315, which is also almost the August 15 2022 High.
The STOCH RSI is just coming off a Bullish Cross, indicating that we are just at the start of a new rally.
-------------------------------------------------------------------------------
** Please LIKE 👍, FOLLOW ✅, SHARE 🙌 and COMMENT ✍ if you enjoy this idea! Also share your ideas and charts in the comments section below! **
-------------------------------------------------------------------------------
💸💸💸💸💸💸
👇 👇 👇 👇 👇 👇

S&P500 bouncing on the Bear-Bull market separator. Strong buy.The S&P500 isn't only supported this week on the 1day MA200 but also hit the Pivot line that separates the Bear from the Bull market.
During the 2022 Bear market it was a Resistance, keeping all price action below it, having it total 6 rejections.
This is the first time it is being tested from above as a Support.
With a Channel Up having emerged as the pattern that is guiding the S&P500 into the new Bull Cycle, the RSI is on a flat Support, similar to what it did on June 16th 2022. A massive rally followed.
Our Target is 4300 (under Resistance A).
Follow us, like the idea and leave a comment below!!
