Statebankofindia
SBIN upside target 840, 850State Bank of India may see good bullish momentum this week, the stock is on a bullish breakout on the daily chart, breaking which could show the stock a good rally. This stock can also see targets up to 840. The stock has also closed with a gain of five percent in today's session. The stock has also seen a bullish engulfing candlestick pattern on the daily chart indicating a good uptrend in the stock.
SBI Analysis - Continuous, Just as the Markets !This is a Thread, so Follow for Technical Analysis performed with TrapZone Pro & UMVD Indicators.
* Trend is Based on TrapZone Color
* Bar Colors give us Momentum Green from strong Up Moves. Red Bars point to strong Down Moves.
* Red UMVD = Selling Pressure & Green UMVD = Buying Pressure. Purple is for Divergence = Battle of Supply & Demand
--------------------
1-17-2024
RED TrapZone with Divergence after Green UMVD. Lets see what shows up after the divergence on UMVD.
The Bank that India banks on SBI, looking towards an uptrend.State Bank of India is an Indian multinational public sector bank and financial services. SBI is one of premier Indian bank which is also a Public Sector bank.
The positive aspect of the company is Zero Promoter pledge, Book value of the share increasing, FIIs increasing stake in the bank, Annual net profits are increasing, revenue of the bank is also increasing. The negative aspect of SBI is Mutual Funds are decreasing and there is a noted decrease in net cash flow of the company.
Entry in the stock can be taken after closing above 636. Targets for SBI will be 646 and 659. Long term targets in SBI will be 671 and 688. Stop loss in SBI can be maintained at a weekly closing below 588.
The above information is provided for educational purpose, analysis and paper trading only. Please don't treat this as a buy or sell recommendation for the stock. We do not guarantee any success in highly volatile market or otherwise. Stock market investment is subject to market risks which include global and regional risks. We will not be responsible for any Profit or loss that may occur due to any financial decision taken based on any data provided in this message.
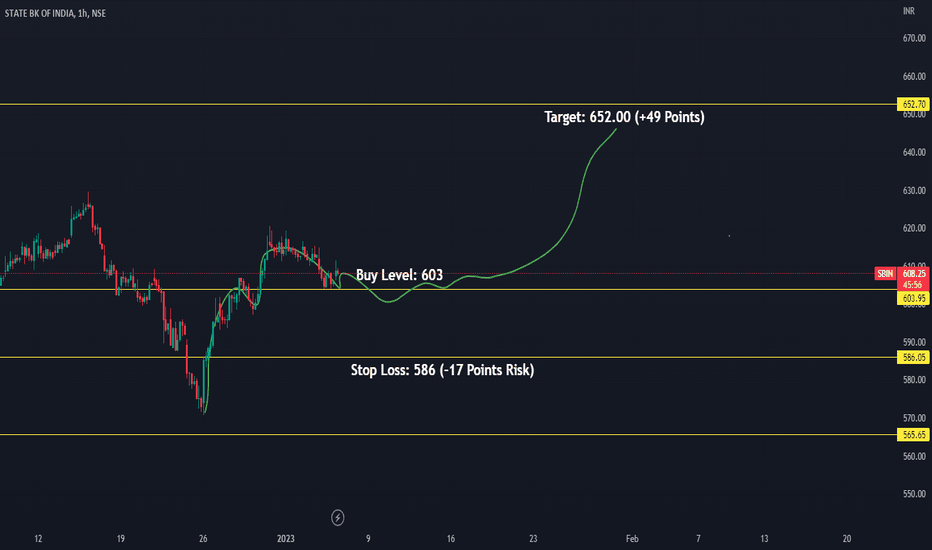
SBIN Conditional Buy levels 28.03.2023This is conditional buy view on NSE:SBIN . If 45min candle closed above 515, we can make a entry with stop loss of 507. My expected upside target will be 528.00. It would be positional trade for 1-2 days.
Note: This is my personal analysis, only to learn stock market behavior. Thanks.
SBINHello and welcome to this analysis on STATE BANK OF INDIA
On FEB 15, it showed a very strong reversal after 5 days of steady decline from 550 to sub 500.
Currently on the hourly time frame it is completing a bullish flag and pole pattern suggesting upside levels of 535-540 as long as it does not break below 510.
Good Risk Reward set up here
SBIN - LONG setupThis has been my fav stock in the PSU banks space.
Chart looks great on both Weekly and Daily charts. At a very critical stage right now and at resistance zone. Nice strong candle for closing and firmly up at the resistance zone, but RSI on both Weekly and Daily charts bullish and no where near overbought zones.
200 daily MA below should be strong support and positive trending stock.
Keep an eye on the whole PSU space for action.
SBIN - BULL FLAG BREAKOUT - Medium/Long Term SwingThe above analysis is done purely on basis of Price Action & Chart Patterns.
The analysis is done on weekly TF hence price may take few weeks to few months in order to reach the targets.
For understanding how to trade a Bullish Flag Structure, refer to the ideas linked below.
The above analysis is purely for educational purpose. Traders must do their own study before entering into any trade. Traders must trade as per their own risk taking capacity and money management.
Feel Free to comment or message me for any query or suggestion regarding this stock or Price Action Analysis.
Checkout my other ideas to understand how one can earn from stock markets with simple trade setups.


