🔥 Bitcoin: Statistical Analysis Of Q4-2021With the fourth quarter of the year starting tomorrow, I'd like to give a short overview of the historical returns of the fourth quarter.
Quarter / Returns
4-2010 / 384.7%
4-2011-8.1%
4-2012 / 9.0%
4-2013 / 421.0%
4-2014 / -16.7%
4-2015 / 81.4%
4-2016 / 59.2%
4-2017 / 220.4%
4-2018 / -43.8%
4-2019 / -13.7%
4-2020 / 168.9%
Average results per quarter:
1 / 68.5%
2 / 216.9%
3 / 9.2%
4 / 114.7%
Looking at the data, we can deduce a couple of interesting things.
Over the last 11 fourth quarters, only 4 ended up with negative returns. This means that, historically, 63.6% of all fourth quarters ended up green.
Another interesting find is that the average fourth quarter loss is equal to -20.6%, whereas the average forth quarter gain is equal to an immense +192.1%.
Assuming that historical data can be indicative of the future, we can safely say that the fourth quarter will be, at the very least, better than the third quarter.
Where do you think that the fourth quarter of 2021 will bring us?
Statistics

🚨💡BTC: 'Hidden' Death Cross 100% Probability of Correction💡🚨Remove the Noise!! This is pure mathematics, statistics and probability.
The 'Hidden' Death Cross & 'True' Golden Cross are the cross of the weekly 50 SMA & 50 EMA, which with 8/8 historical cross cycles completed, consistently (100% of cross cycles) result in a significant market contraction or expansion.
Note: I am bullish on BTC, but these macro economic cycles must complete and ignoring statistical probability because of over bullish dreams, sentiment or "conviction" is likely the no. 1 fallacy of most traders in all markets.
In the following historical analysis, I identify each cross,
For contractions, I use the price at the date of the Hidden Death Cross, to the lowest price to determine the price drop percentage.
5 Hidden Death Cross (HDC);
1. 26-Sep-2011: -60%
2. 07-Jul-2014: -73%
3. 28-May-2018: -62%
4. 24-Feb-2020: -61%
5. 30-Aug-2021: -....
- 100% Probability of Market Contraction
- Average contraction: 64%
Standard Deviation (Confidence);
- SD 1 (90%): Max 68% / Min 60% Correction
- SD 2 (95%) Max 69% / Min 59% Correction
- SD 3 (99%): Max 71% / Min 57% Correction
Market expansions are identified from the price at the date of the True Golden Cross, to the highest price to determine the price increase percentage.
4 True Golden Cross (TGC);
1. 16-Jul-2012: +16'890%
2. 20-Jul-2015: +7'192%
3. 29-Apr-2019: +179%
4. 03-Aug-2020: +531%
5. ......
- 100% Probability of Market Expansion
Expansion values too variable for significant deviation estimation
Conclusion:
I am a TA traditionalist, I believe that the price reflects all known / unknown information and that price action reflects human behaviour in reaction to the changing nature of the information to establish the best possible price at that moment in time.
Based upon the mathematical analysis of the price action, for example tracking moving averages, we can identify the trends in human behaviour and apply statistical probability to these trends.
As can be observed above, the statistical probability of this trend is considerably strong, with a 99% confidence of a drop in the range of 57% to 71% after the Hidden Death Cross that happened the 30th of August 2021.
What do you think?
yemala

HOW-TO: Drawdown RangeHi All,
Please go through the HOW-TO guide for statistical study created based on drawdown from ATH.
I will be using this in coming videos on Fundamental strategies.
Thanks

A look into my monthly performance In this video I show off some Oanda tools that allow me to track my trading performance Oanda isnt the best but something is better than nothing

What Does the Ichimoku Cloud Tell You?The technical indicator shows relevant information at a glance by using averages.
The overall trend is up when the price is above the cloud, down when the price is below the cloud, and trendless or transitioning when the price is in the cloud.
When Leading Span A is rising and above Leading Span B, this helps to confirm the uptrend and the space between the lines is typically colored green. When Leading Span A is falling and below Leading Span B, this helps confirm the downtrend. The space between the lines is typically colored red in this case.
Traders will often use the Ichimoku Cloud as an area of support and resistance depending on the relative location of the price. The cloud provides support/resistance levels that can be projected into the future. This sets the Ichimoku Cloud apart from many other technical indicators that only provide support and resistance levels for the current date and time.
Traders should use the Ichimoku Cloud in conjunction with other technical indicators to maximize their risk-adjusted returns. For example, the indicator is often paired with the relative strength index (RSI), which can be used to confirm momentum in a certain direction. It’s also important to look at the bigger trends to see how the smaller trends fit within them. For example, during a very strong downtrend, the price may push into the cloud or slightly above it, temporarily, before falling again. Only focusing on the indicator would mean missing the bigger picture that the price was under strong longer-term selling pressure.
Crossovers are another way that the indicator can be used. Watch for the conversion line to move above the base line, especially when the price is above the cloud. This can be a powerful buy signal. One option is to hold the trade until the conversion line drops back below the base line. Any of the other lines could be used as exit points as well.

BTCUSD - STATISTICAL ANALYSISTaking into account that the price is driven by orders proportional to its growth since 2018, this correlation could occur in 2021 between order volumes and the expected dips.
Remember that Bitcoin is part of a developing market, comparable to the dot-com bubble.
What's your opinion? Stay tuned on our updates!

Statistical approach to risk management - Python scriptThis script can be used to approximate a strategy, and find optimal leverage.
The output will consist of two columns, one for the median account size at end of trading, and one for the share of accounts liquidated.
The script assumes a 100% position size for the account.
This does not take into account size deviations for earnings and losses, so use with a grain of salt if your positions vary greatly in that aspect.
Code preview
cdn.discordapp.com/attachments/592684708551327764/848701541766529034/carbon.png
TradingView does not allow posting external links until you've reached a specific reputation, so i can't use the url feature
Input explanation
WINRATE : chance of winning trade
AVGWIN : average earning per winning trade
AVGLOSS : average loss per losing trade
MAX_LEVERAGE : maximum leverage available to you
TRADES : how many trades per account you want to simulate
ACCOUNTS : how many accounts you want to simulate
the inputs used in the source code are from one of my older strategies, change them to suit your algorithm
Source code
pastebin.com/69EKdVFC
Good luck, Have fun
-Vin

Presidential Stock Market PerformanceEvery day it seems that the media puts out the best of reasons... from the smartest of experts... as to why the stock market and economy is going to CRASH soon! This has gone on for as long as I can remember. Why do they continue to publish this misinformation? Because it get's ATTENTION!
What does history ACTUALLY tell us about stock market performance following Presidential elections with the same political makeup we have today?

Support and ResistanceThere is no magical tactic or indicator to "see" the support levels on a chart, but how do astronomers know a black hole is around without seeing it? They use their brain.
There are several types of support/resistance, the obvious ones, and the less obvious ones, and which ones do you think separate the bottom 95% from the top?:
- Horizontal price level (Bitcoin 9000, 6000, 3000)
- Diagonal price level (trendline)
- Moving averages self fulfilling prophecy
- Constant flow of positive news
- Sovereign fund buying or selling (CCP bags) program
- There is more, up to us to find it, good luck
In my weight gain & weight loss example what supports the increase and decrease?
You cannot predict what exactly that person will eat everyday, if someone will drop them home or not,
how much they will walk, if they hear in the media about a "science" paper claiming chocolate is super healthy.
Those are all random factors (to us puny humans), they are part of the normal day to day fluctuations.
Mere mortals including the best know those fluctuations happen but do not trade them, only daytraders do.
The weight has some support during the visible uptrend. This support is the regularly added calories from the weekly pizza.
Exact same as an institution running an algo to buy shares by increments every week at the same hour (that you could scalp).
On the weight loss period, there is a resistance, which is made up of the every other day walk home and the lack of pizza.
Yes mostly the resistance here is not something but the absence of this something!
So while predicting with precision is not possible we can enter on what we consider 2-sigma oscillations for example.
If we bet on the early "reversal" being just noise with a stop at 3 or 4 sigma we get an asymmetric risk to reward.
The average casual investors (and Bill Ackman) are the ones betting on the 4-sigma "never give up! strong hands! we will win! the power of love!".
4 sigma is human nature (for most people), also not understanding probabilities intuitively is. But I'll make a separate idea about that.
Skilled investors not only exit but even if a trend starts with good support (fundamentals + visible with technicals) they will join the new trend.
But careful not mixing everything. "4 sigma" meaning very low p of being noise in the original trend does not mean high odds of opposite trend.
So this is it, to estimate what supports the price the smart market speculator has to work as a detective, find clues, and as a statistician, put these clues together with p weights,
add potential clues with their own p weights.
How can novices possibly imagine they can use "TA" to magically find these supports, they really expect some big red flashy arrows on the chart that anyone can see?
It's so delusional. As detectives they'd expect the killer to scream "I DID IT! I AM HERE!"?
And of course get a big paycheck for their work as a detective. This is not a video game.

Curvy Mayhem, Stock-to-Flow, and a Critique of Pure SimplicityDisclaimer: This is not financial advice. I am not a statistician. I am not a trading/investing expert. I am a wildlife biologist. This is just a regurgitation of my research, thoughts, and opinions, along with my attempt at having fun with numbers to create an incredibly speculative model for Bitcoin’s future price action. Hang in there folks, this is a long one.
Since I entered the crypto realm in 2017 (I know, such a newbie), I have been obsessed with Bitcoin’s historical logarithmic price chart. Something about the way it smoothly sweeps across the orders of magnitude separating its former obscurity from its financial relevance has drawn me into a fantasy of elegant mathematics, an illusion of design, and a tempting allure for fate. The hindsight is heavy, and it all seems so simple, but it rarely ever is. I often see BTC log charts with curves that march atop the market cycle peaks or support the lengthy slumber of the prices below. I’ve fallen into this habit myself, but these curves are all equally vapid. You can fit infinite curves to any three points after all. (Which of the twelve curves above is the correct one? I personally like light green.) When we create models, we mustn’t be arbitrary for the sake of beauty. What feels right is usually not what ends up being right. Any experienced day-trader will tell you this. We need objectivity.
Financial models are hard to create. For centuries, humans have struggled to keep up with the emergent complexity of the markets they formed. The intricacies of our systems tend to outpace us, and some things forever elude our understanding. However, we desire simple answers to complex questions. We see patterns in everything; it’s just an evolutionary heuristic that our prehistoric ancestors utilized for hunting, gathering, and not dying. But in our hyper-complex modern world, this feature of pattern recognition is usually used to a fault. In the following paragraphs, I outline some issues with models created by others and myself. On the surface, these models appear elegant and well-fit, but when we delve into the assumptions behind such models we often find that simple answers are woefully insufficient to predict the future of a complex and turbulent world.
BITCOIN STOCK TO FLOW MODEL
While the controversial Stock-to-Flow (S2F) model introduced in 2019 by Plan B has proven to be a good fit for Bitcoin’s early price growth thus far, there are several fundamental problems with the model, like failure to account for demand as an influence of price and the lack of a relationship between price and S2F in other scarce stores of value including cryptocurrencies. But perhaps worst of all, this model fails to address the growth-resistant factors that Bitcoin will soon face. Linear regression models on a log-log plot predict infinite growth when extrapolated. Whether limitations arise from resource depletion, social and political behaviour through competition and regulation, or even the laws of physics, nothing can grow indefinitely.
So what will ultimately limit Bitcoin? Let’s start with the energy consumption problem. Bitcoin already consumes about 0.5% of the world’s energy supply, more than most individual countries on the planet, and this percentage is increasing rapidly. The issue lies with Bitcoin’s proof-of-work architecture, an algorithm used in the Bitcoin blockchain that incentivizes miners to expend computational energy to cryptographically secure others’ transactions. As speculation drives the price of Bitcoin higher and the available minable supply decreases, miners face greater competition and expend more energy. Eventually, and probably sooner than later, Bitcoin’s price will rise to such a level that the hash rate, and subsequent mining cost, will no longer be able to keep up. Even putting human behaviour aside, Bitcoin’s energy consumption would exceed the entire energy supply on Earth by the 2030’s given the unfettered growth predicted by the S2F model. This may be the gravest threat to Bitcoin’s development into an economic juggernaut, though some solutions like proof-of-stake have been proposed to address this crisis.
Two more restrictive factors on Bitcoin’s price are governmental regulation and financial pressure. For the most part, Bitcoin has been allowed to grow naturally without too much interference. However, as it becomes a more significant market force, powerful governmental and financial forces will inevitably attempt to influence, control, or even destroy it. Perhaps the latter is unlikely to happen, if not impossible to do, but market adoption can absolutely be decelerated, leading to a suppression of demand and price.
Finally, assuming relatively tame fiat inflation rates, there’s not even enough money on Earth to support the level of growth predicted by the S2F model for even a couple more decades. Eventually, the market will become saturated, demand will diminish, and the price will stabilize. The only way this model works and gives us bitcoins worth $1 trillion in 2050 is if USD inflation goes nuclear and sends the global economy into abject chaos. Even Plan B has admitted as much. By then, your crypto gains would probably be the last thing on your mind.
I think it’s clear that any models attempting to predict the future price of Bitcoin need to include a factor that limits growth over time or extrapolates from existing decelerating price patterns. So I decided to create two alternative models based solely on Bitcoin’s price history. For simplicity’s sake, I chose the more speculative route of creating a model based on the peaks of each of Bitcoin’s bubbles. (Note: Data used in statistical analysis was monthly high bitcoin prices collected from barchart.com and yahoo finance.)
FOUR-PARAMETER LOGISTIC REGRESSION MODEL
Even a brief glance at the logarithmic chart shows a pattern of price bursts steadily decreasing in intensity, revealing a long-term trend of logistic growth. This is not surprising, considering it gets prohibitively harder to 10x a market cap the second, third, or eighth time around. The best-fitting model for four points following a logistic pattern is, of course, the four-parameter logistic model. This provides a moving target for an end to this bull run. (Note: I made this chart before INDEX:BTCUSD was released, so pre-August 2011 prices were drawn in)
Despite giving a tamer near-term outlook, this model still overestimates long-term prices and runs into many of the same problems as S2F, leveling out at a price of 10^230 USD long after our planet is gone and stars stop forming… but at least it levels out. I would also argue that this model is heavily overfitted, using four parameters given only four data points. Furthermore, it places too much emphasis on the starting price of Bitcoin, which may have had little or no influence on its future price.
MARKET CYCLE RATE-OF-INCREASE POWER REGRESSION MODEL
Instead, I looked to a different measure to predict Bitcoin’s bubble behaviour: price increase over time within each market cycle, extrapolated with a power regression model. I defined market cycles as the time between peaks and calculated the percentage price increase over time (in months) from peak to peak. During the first cycle, when Bitcoin jumped from its first-traded value of $0.09 to about $30, the rate of increase over time was astronomical. The percentage rise of each subsequent bubble has decreased since then while market cycles have lengthened. This gives us three complete market cycles ending in June 2011, November 2013, and December 2017, and three data points describing, as an average monthly percentage, the constant rates of increase in price from one peak to the next. Extrapolated with a power regression (y = 2758x^-4.119; R^2 = 0.994), we are left with a shallower rate of increase between the 2017 peak and the approaching peak. This again provides a linear moving target for an end to the run. On a logarithmic chart, the straight lines between peaks look a little different.
This model proves much more flexible than many others. Instead of a specific date or price level, Bitcoin is free to trade however it wishes until the moving target is hit, whereupon the bubble will deflate and we enter a new cycle with a new sloped upper bound. The slope of this bound is determined by the previous market-cycle peak price and the next rate-of-increase value provided by the power regression. These slopes constantly increase, but by less and less each cycle until the price of Bitcoin plateaus. The price level of this ceiling would be determined by the frequency/length of market cycles. Time itself acts as (or at least tracks) the decelerating force.
So, it’s a fun model, and quite pretty on a logarithmic chart, but how good is it actually? Well…
Problems with this model:
It fails to properly define peaks. One can gain an intuitive sense of when each bubble ended, but without an objective definition of this point, the very parameters on which this model relies can be interpreted differently by others. How are we to know if this current run has ended? Was the spike in April 2013 a peak? (Probably not, but you get the point). This one is easy enough to remedy, but I can’t be bothered.
We have only three data points, hardly enough to make a reliable trend, let alone one we can extrapolate (Counterpoint: The power regression extrapolation of only the first two points predicts the third with a surprisingly reasonable margin of error for these scales – about 0.2 orders of magnitude, suggesting this model may already have some predictive power. In other words, if you had followed this dubious two-point model in 2017, you’d have sold at about $12,000.). Additionally, extrapolation leaves us with a much greater margin of error than interpolation, especially when we’re working with such a small sample size. At this point, we risk falling into the trap of moving the goalposts by adjusting our model to match new data as it comes in, not unlike what has been done with the S2F model. This ad hoc method constantly maintains the fit of a model but proves that the initial version had somewhat poor long-term predictive power to begin with.
This model also places too much emphasis on Bitcoin’s starting price in July 2010. I find it unlikely that this asset’s long-term growth dynamics were heavily influenced by this initial value.
It relies on the assumption that the declining rate-of-increase of market-cycle price peaks can be extrapolated into the future. It might be possible to justify this, but I can’t be bothered. This write-up is already nearing 2,000 words.
The use of a power regression forces the assumption that long-term growth will never be negative; instead, Bitcoin will approach a plateau at some point. While there are any number of black swan events that could deflate Bitcoin’s price, no simple price extrapolation model can predict and incorporate these possibilities with any reliability.
If this model somehow plays out perfectly, I’d be elated. But I wouldn’t have been right. I’d have been lucky. The possibilities for Bitcoin’s behaviour during this cycle and the next are innumerable. All you need is 3 data points and you can make anything happen. Perhaps you remember that colorful, curvy chart a bit further up. However, that doesn’t mean it’s not fun to try. Probing the long-term price action of a novel market with statistical fervor has proven to be a rather entertaining and educational experience. It also shows the difficulty, and perhaps the futility, of finding simple solutions to incredibly complex systems.
CONCLUSION
I recently watched a youtube video posted by an astrophysicist. He discussed whether we should rely on beauty and simplicity when creating models to accurately describe the intricate and incredibly complex details of our physical universe. Take the theory of gravity and planetary motion, for example. As physicists, theoreticians, and thinkers studied the skies for millennia and searched for simple answers, the theories progressed from that of circular orbits, to more complex ellipses, to a law for gravitational attraction, to requiring special and general relativity – a dramatic increase in complexity and certainly a less beautiful solution, even if more accurate. I have noticed the same trend in my own field. The theories describing ecosystem equilibrium and the interactions between species have grown more complex as ecologists learn more about the biosphere at various resolutions. I believe these same principles can be applied to most aspects of reality. Simplicity has its place, but we often take it for granted. As tempting as simplicity and beauty are, we mustn’t fail to respect and embrace the complexity of our world, however we interact with it.


ANDA warrants are all but a certain win right now - SHORT TERMat $0.15 on the chart at time of writing, statistically speaking, this should double in the next week... if not 1st thing Monday morning.
Aside from the obvious problem they face with the merger, this will probably be one of those times where I should have opened a bigger position, but I will still play it smart.

Review of this year: where the money was atJanuary-February:
Not much.
FX some extended arms bouncing on support.
Gold parabolic move inside the early bull market, short lived.
March:
Stocks mega-crash. Fundamentals. Coronavirus, lockdowns, etc.
Gilead super volatile with Remdesivir, airlines & cruise lines die.
Dollar goes up but not interesting to buy.
Bitcoin crash I waited for 1 year finally happens.
April:
Oil month. Easy profit because of a drop in demand & thanks to dumb money, very easy price action to follow as well as biggest contango in history.
Some easy to follow trends with the Pound.
Bitcoin screams "buy me" and then goes up, I only got 2R out there because it did not go very far and I had a wide stop.
May:
I don't know, nothing? Lots of sideways. Nice to note oceanic pairs have been lame all year pretty much. Every single asset sideways / no predictability.
June, July, August:
Trend following summer.
USD pairs & Gold. Straightforward and simple.
September:
Trend following but just a succession of losses.
Forex breakouts & pullbacks have not worked out.
Grains start a mega super extreme trend 3000+.
October-November:
Oceanic pairs reversed and started a new trend, but it was short lived.
Bitcoin is the big mover, close to ath now. Price was going up, couldn't give precise reasons why I bought, t'was just intuition.
So to sum up, what really defined this year for me:
April, July, November best months. March would be there too if I was more involved with stocks like the typical US hedge fund.
OIL in April (1! & 2!-1!)
USDOLLAR in July (USDSEK especially)
GRAINS in September (ZS1!)
BITCOIN in November
The Pound & Australian Dollar had their moments too, but they were not as cool.
Gold got to ath but this entire year gold was summed up for me to 2 small couple of days long moves. So not that interesting actually.
The stock market in march of course, if this was my thing.
Also, 6 months later once again proven right, Gilead expensive drug is now officially garbage. Maybe short sell this fraud in a downtrend now...
And another thing was Tesla going up up up but I just do not care. 1rst FX, 2nd Oil Gold, 3rd grains & natgas & copper, 4rth the seldom BTC or stock indice, and that's it I can do no more.
An extra painful september
Plenty of very difficult tiny wins with forex pairs in autumn, both "reversals" (they're always disappointingly small) and "trend following"
Anything else happen this year that I missed?


eurusd. potential sell.a potential unified gartley is setting up. detailed stats and trading levels are on this screenshot: prnt.sc
Note:
1) The stats are only valid if you find patterns the same way as I do
2) The stats are only valid for this financial asset and this timeframe
3) WIn% = win probability; Loss%=loss probability. Keep in mind the Loss%. It is calculated by the formula: Loss%=100%-Win%. You should read it this way: "In this trade I have a Loss% probability to lose what I am risking. Can I accept this risk?"
4) Unified Gartley variations are distinguished by the B and the C ratios (this is UG68 because the B=0.5-0.6 and the C=0.7-0.8)
5) In the market research I tested 0.6XA, 0.7XA, 0.8XA, 0.9XA entries/0.9XA, 1.0XA, 1.1XA, 1.2XA stops/1RR, 1.5RR, 2RR, 2.5RR, 3RR targets - total num of trading levels combinations = 80. The combination on the chart is the one that has the best RR-expectancy with win% >= 50%
6) The pattern is supposed to be traded with limit orders with pending stops and target orders. If you wait for additional confirmation (like priceaction or indicator confluence) you are adding untested variables to the equation. The result is then becomes unpredictable and you are gambling.

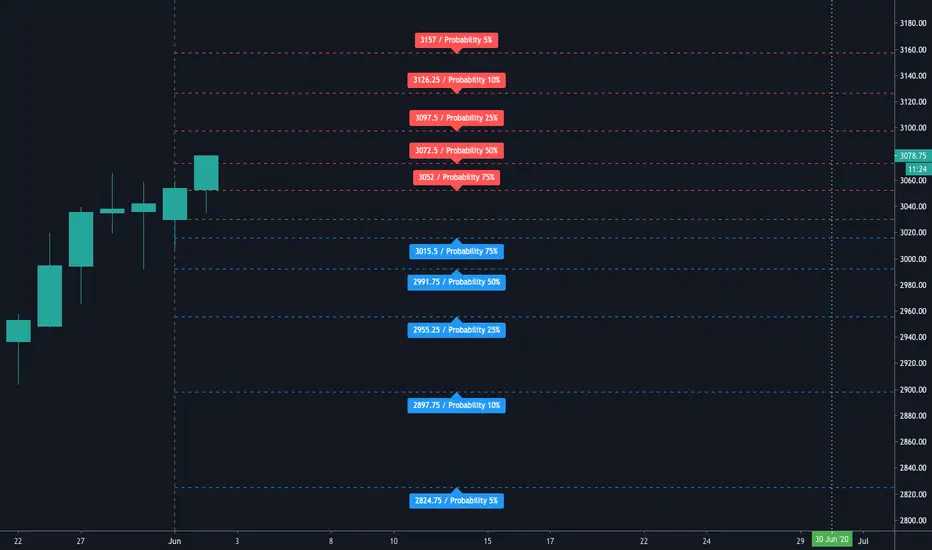
Bitcoin - June 2020 levels and probabilitiesYou can find Bitcoin probabilities for June 2020. Levels are generated using 9 years of data.
Disclaimer: I'm not a professional trader or financial advisor. This is not financial advice.
Trade safe,
Atilla Yurtseven

E-mini SP (SP500) - June 2020 levels and probabilitiesYou can find E-mini SP futures probabilities for June 2020. Levels are generated using 20 years of data.
Disclaimer: I'm not a professional trader or financial advisor. This is not financial advice.
Trade safe,
Atilla Yurtseven
I think I just wrote a book. PF, RR, WR, etc.Intro, you can skip this part but I think it would be interesting for you to take a quick look:
Statistics estimates and formulas? Trading is mostly about emotions, not statistics estimates and formulas.
Most people do not need all of those formulas, they don't need to make plenty of stats and estimates, but just focus on discipline and emotion control.
I got this quote: "The key to trading success is emotional discipline. If intelligence were the key, there would be a lot more people making money trading."
I agree. Analysis of broker data has shown over and over that over a couple of years 90% or more clients lost money, and often all of their money.
So no point doing stats & formulas for 90% of people that will lose anyway.
What they need most is discipline, to not lose all of their money, but rather just some of their money, and emotional control, to not blow their brains out once they lose everything.
I can make a few quotes too:
Checking a thing quickly...
Stanley Druckenmiller was 46 when he did something stupid with the dot com bubble.
George Soros started at 29 and his biggest (known) mistake was Stanley Druckenmiller.
Oh this one is interesting....
Alot of profitable ones that got really confident after a few years of winning and got wiped out or made huge losses or missed on much returns (Buffet says BRK cost him 200 billion, he'd be way above Jeff Besos). I see alot of late 20s to early 30s. But even older than this after decades, it's never safe, never let your guard down. But most typical is the ~30 yo guy that made lots of money for years and laughs hysterically at noobs (retail traders mostly) and was warned of dangers by people trying to scare them away but proved every one wrong, knew he was at the top, one of the best in the world, so got really arrogant, dropped his guard down, and then boom.
By the way, totally unrelated, should I all in short USO? It's losing money over time and already so many idiots "invested" in it. There can't possibly be more morons that would buy this dead crap right? Lmao USO investors, what a bunch of brainlets. I refuse to lose against idiots just by being outnumbered. All in no SL. 😁
How do I start a show so I can do literal pump and dumps legally like Joseph Granville?
Good. Now that we got this out of the way.
1- Winrate
Pretty simple here. All this shows is what percentage of bets are winners. Doesn't really account for breakeven, doesn't differentiate between small wins big wins. Pretty useless on its own. Implicitly means that every win and loss have the same size, like putting rigid entry target SL, and never touching it.
2- Reward/Risk
How big is the average or expected win, compared to the typical loss. How much are you willing to risk and how much do you expect to make?
Most "educators" repeat how important the risk to reward ratio is, and it kinda is, because it is one of the best predictor of success.
FXCM published some data where they show that over the 3/1/2014 to 3/31/2015 period (1 year), 53% of their clients with a RR of 1 or more were in the green, while only 17% of those without were.
47% of RR >= 1 lose money. 83% of RR < 1 lose more. Their typical win % over a quarter is 25%, and the typical global win % over a year is around 20%.
I would be willing to bet that profitability goes up significantly with reward to risk. Some of it would of course be simply because people that end up with a huge win on their hands balloon the high RR stats.
That said, I doubt just flipping a coin, just randomly buying with a tight stop and a far away target would work. Althought...
The top myfxbook systems are almost all automated garbage systems with an average win 0.20 times the average loss, that were really lucky over a long period (3 std dev of a normal statistical distribution = 0.3% 3/1000, just pick any trash system with high WR and run a binomial probability calculator find the odds of it making profit over 100 rolls). Hey I'll do this later in this idea.
And as I was saying, perfect transition, flipping a coin isn't a viable strategy, the reward to risk alone doesn't say it all, even if traders using a high reward to risk ratio greatly outperform those that don't. If you make 10 times what you lose, but you lose 99% of the time, emm how to say...
And this is why we must look at the profit factor.
3- The profit factor. Oh yes
Pf = (W*R)/(1-W)
I have seen reports with a gross PF of almost 3, and net of barely 1.1.
If you design a strategy you count spreads in it... It's obvious.
Day trading sucks and every analysis of day traders data shows about 1% or less make money, and don't make much.
Probably the only ones making anything are level 2 scalpers, and 'experts' selling day trading robots, or signals, or courses.
First a disclaimer! The argument of day trading having terrible profit factors applies to 95% of the time.
When the average move per unit of time goes way way up (spreads & commissions usually don't especially if volume goes up too),
and you get in 5 hours what you usually get in 2 weeks, then obviously it's different.
I focus my argument on 95% of the time, when volatility is "normal" (within 2 st dev basically, and in particular within 1 - ~70% of the time)
And I have been really nice here.
Getting an idea of what good profit factors are...
If I participated I would take a single bet with huge leverage and hope to get lucky, easy win once every couple of events, but I doubt they allow this.
Lol on the worldcupchampionship site (ran by the CME I think), there are categories, Futures traders at the top have massive returns, way above Forex.
Previous year winners with futures have bigger returns than FX, but this year is just stupid. maybe they blow up soon.
Top 5 FX participants as of May 14 have 40% to 97% returns. Top 5 with futures are already at 200-800%!
In 2018 futures winner made 250% FX winner made 200%, sometimes futures traders make huge gains. The gap is already so big lol. Anything to do with NatGas & Oil? 😆
www.worldcupchampionships.com
Looking at a "war of traders" results. 27 days... Not sure what their leaderboard is. Looks like a great way to get suckers to deposit money and pay fees asap.
First place has a PF of 44%, I assume this means 1.44, second place 160% I assume it means 2.6. Followed by 1.3, 1.05, 1.13, 1.26, 6.85, 1.11....
Prob easier to get a higher PF with commodity futures where they are so much hedgers, much fewer care about hedging FX risk, plus central banks use it to manipulate everything, more people trying to make money.
Sometimes the sharpe ratio is mentionned. Quick definition:
The Sharpe ratio measures the performance of an investment compared to a risk-free asset, after adjusting for its risk. It is defined as the difference between the returns of the investment and the risk-free return, divided by the standard deviation of the investment.
I looked at some hedge funds reports a while ago, since they diversify and hedge alot PF isn't as high.
Warren Buffet has a PF of what? 100? He makes one trade every 10 years.
It's basically impossible to find those numbers, unless you work at a brokerage, and apart from your own, with the exception of the few times a broker releases some data.
You have to take into account how many opportunities you get also, and more but alot if implicit.
I would say that a PF too low is bad, because when conditions change you will take long to notice with certainty and you will also lose way faster! If you had a PF of 1.1 you spent 5 years to grow, and that can be lost very fast AND it takes you longer to realize it is not working anyway.
A high PF has a high margin for error, profits grow fast enough so drawdowns don't eliminate years of progress, and going from 2.5 to 0.75 over a period kinda is extreme.
I think typically for operations that target 1 to 5 daily ATR, (days to weeks holding period), and you get more than something like 1 single bet a year, good profit factors are in the 1.5-2.5 range. Lower than this gets a little dangerous, more than this is the holy grail.
A 25% winrate 5R system has a PF of 1.67.
4- Max Drawdown & risk per operation & max risk
Here you use a binomial probability calculator.
Plenty on the internet.
Winrate 25%, Reward/Risk 5, PF 1.67
==> After 60 bets, on average you should get 15 wins 45 losses.
The odds of getting more than 15 wins (P: 16 or more out of 60) are 43%.
The odds of getting less than 5 wins (55 or more losses) are 0,0956%. 1/1000.
10k account. Flat $100 risk per bet.
55 loss 5 wins = $5500 in loss, $2500 in wins, down $3000.
60 loss 0 wins = $6000 in loss, $ZERO in wins, down $6000 (rekt.)
So every 1000 trades you should expect something like this right?
Even with a very decently profitable strategy it will happen.
You have to decide at what point you consider the odds of it just being bad luck to be too high, and you just want to drop it.
Smaller drawdowns are going to happen absolutely all the time.
If you are risking 1% every time and adjusting, 55L 5W would be a 27% rekt, and 60L would be a 46% rekt.
The odds of losing 18 or more out of 20 are greater than 9% (9/100). Will happen ALL THE TIME.
With 1% risk, drawdown of 8 to 18%. Expect it very often.
Some clients use funds to diversify, to get returns with low risk.
Some expect less risk and volatility than the stock market, but expect better returns. Cute.
5- Expected returns after 100 bets
Say you got a system like the one I used in my example (that you backtested + used over a great number, or just used over a greater number of operations).
Winrate 25%, Reward/Risk 5, PF 1.67
If you do not care about eating 20% punches in the face,
and risk 1% per trade, on AVERAGE, after 100 gambles,
then your results will be as such:
75 Losses, 25 wins
(0.99^75)*(1.05^25) = 1.6. Up 60%.
If you risk 1% of your 20 years life saving, you would get 20% drawdowns on a regular basis, meaning you worked for free 4 years.
You can play around with calculators and notepad to estimate how big drawdowns you'll get, how often etc.
With a 2% risk:
(0.98^75)*(1.1^25) = 2.38. Up 138%.
And regular drawdowns not of 8-18% but 23.3%-33.3%.
And once in a while drawdowns of 60% to 70%.
And a few times in a lifetime of 80% to ....
What is the max drawdown before divorce + jump off a cliff?
6- Expected returns after 1 year
And here we are...
Traders should have a vague idea to start with but mostly look at all of this after running a strategy correctly and with some profits, over a "significant" amount of time, kek can't give a number.
First of all what is the amplitude of moves you manage to catch?
So the first limit is obviously the number of waves / moves.
No matter what sytem you have you will not be able to join more waves than they are waves in the first place!
And then... how many you can catch, is much, MUCH, lower than how many there are. Duh!
Anyone with half a brain should be able to understand all of this at some point...
Someone that manages to be profitable and doesn't blow up should make 5 to 40% I guess.
That's that. It's exponentially harder, but also exponentially more profitable.
I think I should build a new income stream writting books...

Bitcoin targets 9973 with 99% probability until 11th March 2020I have done a statistical analysis on BTCUSD chart and looks like there's 99% probability that Bitcoin will hit 9973.40 until 11th March. We can expect a pump anytime sooner. Just watch and get ready.
PS. I think this move will start sooner but for now, i can say until 11th March 2020
Disclaimer: This is not a financial or investment advice.
Remember to follow me for more
Trade safe,
Atilla Yurtseven

Hong Kong as a black swan and its consequences, FOMC protocolThe other day we wrote about the calm prevailing in the financial markets and the absence of “black swans”, which can turn the situation upside down and provoke a sharp surge of volatility.
Judging by how events are developing, Hong Kong could become such a “game-changer”. And the point here is not even the intensification of protest activity in the country and its transition to the bloody phase of the confrontation, but the reaction of the world to these events. In particular, the US Senate passed a bill in support of demonstrators in Hong Kong.
Since the events in Hong Kong are extremely important for China, they view such US actions as extremely hostile and painful. In particular, China said it would retaliate.
All this happens on the eve of the final rounds of the first phase of negotiations between the US and China, the positive outcome of which is already included in current market prices. So the aggravation of the situation may well provoke a breakdown in the negotiation process, and we will return to the situation when countries actively exchange new tariffs, that is, to intensify trade wars.
Although this scenario is relatively unlikely, you should not write it off. Moreover, investors are already trying to discount under a possible negative, and the press is beginning to "disperse" this topic. Accordingly, our recommendations for buying safe-haven assets continue to be relevant.
In general, in which we note that a critical mass of reasons to start a full-fledged financial crisis has already been formed and the whole issue is in the trigger. The conflict between the two largest economies in the world - what could be the best candidate for the role of a catalyst?
The United States yesterday reported good statistics on the real estate market (building permits grew in October by 5% with a forecast of a decline of 0.4%), but the ongoing hearing about the impeachment of Trump does not give traders a reason to concentrate on buying the dollar. FOMC protocols have given little to the markets in terms of understanding the Fed’s future moves. A pause is a current vector in betting policy.
Our position on the dollar remains unchanged: we are looking for points for its sales. Moreover, every day such opportunities appear in one or the other pair. For example, a pair of USDCAD was a good substitute.

Statistical trade...It is a good idea to buy USDCAD og sell USDNOK as one trade. With such a cointegrated pair, a historically high spread is very rare and a very good opportunity to trade.

Dax daily: 13 Sep 2019ECB main reference rate announcement moved the market rapidly. After the open Dax moved down towards the support at 12 379, we found buyers just for a really small pullback. After this pullback market dropped below this support and slow down. At 13:45 CET the madness has begun. Dax moved rapidly up and down, we found sellers at our resistance at 12 461 and we even created daily high at this level. Around 18:00 CET the market finally slowed down. Today we are opening with a small long gap.
Important zones
Resistance: 12 448
Support: 12 370, 12 339
Macroeconomic releases
/
Today's session hypothesis
Today it is very difficult to form any kind of expectations. We are probably going to stay in the range of the previous day. We might respect levels from yesterday, which were created during the main reference rate announcement.
