Status/Bitcoin (26 May) #SNT $SNT #BTC $BTC#BUY #WAIT
Current Price : 345
Buyzone : Buy as close to 325 as possible
Sellzone : 380-440-510
Stoploss if price is lower than 315
Status

SNT time is up.This chart reinstates a pretty obvious fact. The bears better join bulls after we close the weekly above 650 sat area. After, it will be unstoppable.

$SNT Volume increasing... Potential Ascending triangle$SNT Volume increasing... Potential Ascending triangle as continuation of the breakout..
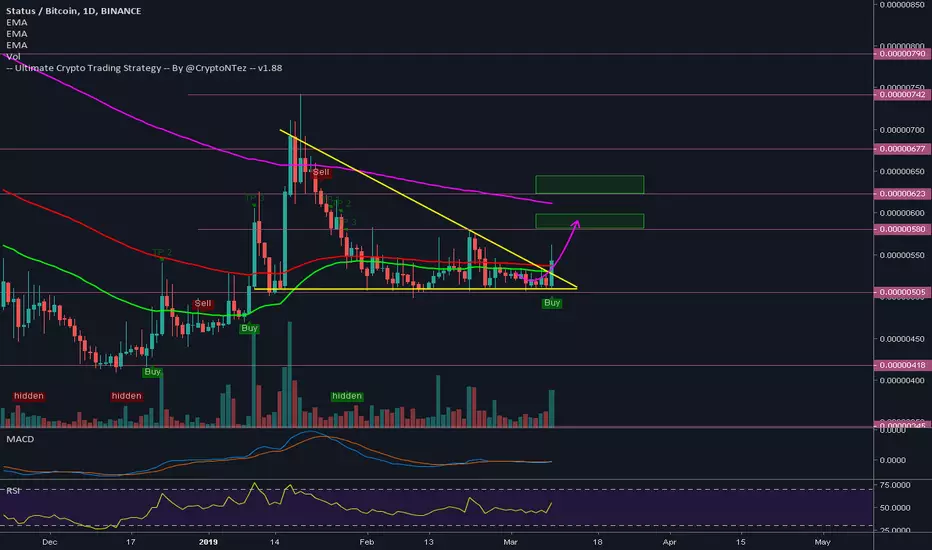
UCTS Buy signal active on the 1D
Crossing over EMA200 (rejected many times), EMA50/100 as support
MACD about to bullcross, RSI Rising + bullish divs
1st & 2nd target on the chart
#SNT

Breaking from current descending triangle to the upside. $SNT Breaking from current descending triangle to the upside.
Showing an increase in volume.
UCTS showing a buy on the daily.
MACD bull cross and RSI rising.
Currently trying to break above EMA50/EMA100. #SNT happy trading!
Daily Bullish Signal $SNT #SNT (11 Feb 2019)RED ARROW indicates the EXPECTED Time and Targets
Level Stoploss point up to maximize profit and reduce risk
I'm working all the time, even in Bearish Market

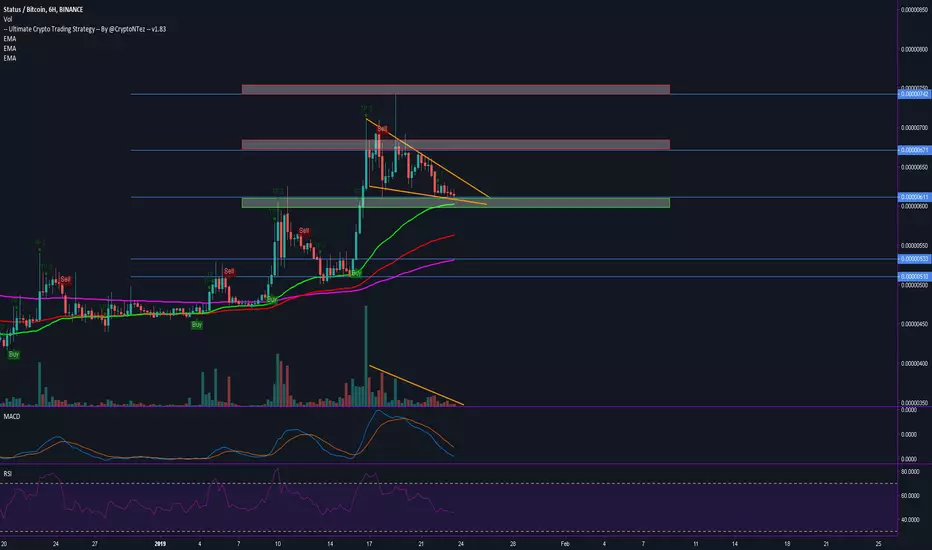
Falling wedge breaking up!Buy signal from the UCTS, Falling Wedge breaking up. MACD bullcross, RSI rising. Volume spiked as result of the breakout, target will be the top of the wedge.

Falling Wedge in Actionforming a falling wedge with a support level at ~611sats.
Bouncing from here can take us to test again ~670sats as first target & 750sats as second target.
For now set up alerts below support level(that will invalidate the trade) & wait for confirmation signals #Status #SNT
SNT – Status – lowest level since Dec 2017 – buy opportunityHi Guys!
Let’s earn some money here.
SNT has plunged significantly but it seems it is bouncing back.
The price is very low, actually at the lowest level since December 2017.
This might be a good opportunity to earn a couple of dollars.
Here are technical analysis details:
• The lowest level since Dec 2017
• Far below (15%) fair price (it is called a point of control – the price with the highest volume - marked as a red straight line)
• Value Area – 25% below the top of the Value Area (70% of the trades made)
• Weis Volume Waves - decreasing supply and increasing demand
• MACD – bullish cross about to happen
• Ichimoku Cloud - wait till the price chart crosses TenkanSen (red) with a couple of bars.
So this might be a short-term opportunity to earn 15 – 25%.
Do you agree?
Please do comment in the section below.
If you like our job don’t forget to give us a like.
Don’t wanna miss the update = click follow on our profile.
MASSIVE Hugs!
WBM Team

SNT – STATUS – 86% sell-off – 1140% profit/loss ratioHi Guys!
So here is the other interesting and much-undervalued project.
This is the app for iOS and Android which enables you to chat, browse and transact securely among Ethereum network. Their goal is to create a better, decentralized network which is secure, transparent and what is equally important, mass adoption of the Ethereum.
Here are technical analysis details:
• Super low on the Fibonacci scale
• Very good profit/loss ratio – not much room to fall and plenty to go up
• Ichimoku Cloud – TenkanSen crossed KijunSen and this all above the cloud; the chart crossed TenkanSen
• EMAs – 9, 21, 50 broken up; 100 to be broken within days
• Weis Waves – supply evaporated - all we need is more demand
• MACD – positive convergence
Fibonacci targets:
1. 0.00001273
2. 0.00001871
3. 0.00002354
4. 0.00002838
5. 0.00003526
6. 0.00004403
Stop-loss: the lowest level at 0.00000297 but if you are less tolerant set it somewhere between 0.00000297and 0.00000600
So that’s it. This looks very promising but it is more mid/long depending on the market as a whole.
Observe the SEC announcement on the 5th of November. There might be something BIG or… another delay. We will see on Monday.
Thank you for your voice here and all likes.
LOVE YOU <3
Massive Hugs!
WBM Team


Status vs Bitcoin - Huge Potential - 150% profitsSNT/BTC - Status on Binance
We are currently consolidating above our Monthly Order Block Equilibrium.
We can expect an upside potential up to 150% for Status
Large profit potential on this pair!


$SNT, Retesting Historic Lows…
Daily
Looking over at our trigger timeframe we see price has formed a lower high at 550 satoshis, and is now looking for a lower low. Stochastic RSI showing momentum is in favor of bears with no signs of reversal. A daily close above 550 and we should see a higher high form near our 1000 resistance, however if rejected at tis level expect a sell off towards our 400 support zone.

Status (SNTBTC) On Watchlist (600%+ Potential)Take a look at Status (SNTBTC), all the signs are there. This coin is ready to move soon, a new wave up is approaching.
Here is the daily chart:
- There is good divergence on the MACD.
- The RSI bounced recently from oversold and is now trending up.
- There isn't any significant volume. Needs more time.
- Keeping on watch-list.
Your support is highly appreciated.
Namaste.

Technical Analytic for #SNT #Status (31/08) - CryptoStation#SNT (SNT/BTC)
Buy : 575-585
Flash Sell : 590-600-610-620
Short Sell : 630-640-650-660-670
Long Sell : 680-690-700-710-720-730
Stop : 540
Follow me for more signals
Inbox me for more and more signals


SNTBTC - possible upward movement to value zoneA good Bullish Divergence on MACD-H
A divergence with Elder Force Index, so this is a confirmation.
False breakout developing on the 1H chart, which confirms a possible upward movement because of this price is rejected.
RSI touched overbought zone
I expect it to go up to the slow EMA
Target can also be the +0.5 or +1 ATR
I will decide if I get out at target 1 (first arrow) and with how much.
I could take 1/3 or 2/3 up to the +1 ATR, depending on how the trade develops.
Entry 0.00001144
Target 0.0001180
Stop Loss 0.0001130
R/R ratio: 1:2.5

$SNT, Alt-season is that you….
Weekly
Looking at our highest timeframe we see price has found major support at 1000 satoshis, and is currently testing our major resistance at 1400. Stochastic RSI showing momentum is just starting to head towards the upside. A weekly close above or resistance and we should see a higher high be formed.
Daily
Shifting over to our pattern timeframe we see price piercing our resistance zone and has since slowly been retracing from this level. Expecting price to hold above our 1200 support level, a daily close below this level and expect price to fall towards 1000 and form a wammie double bottom at this level. Stochastic RSI showing momentum has peaked out and we could be heading towards the downside temporarily.

SNT Looking Bullish SNT looking very bullish with a strong swing to the upside with a nice consolidation forming a bull flag type pattern.

Status Rejecting Second SupportOn the 29th of May Status has found the support at 88.6% Fibonacci retracement, that is $0.087 level. The following wave up resulted in a break above two descending channels and reaching the high at $0.1.
The corrective wave down followed and SNT/USD yet again fond the support, this time at the 76.4% Fibs, that is $0.091. The strong support area has been formed between $0.087 and $0.091, and while it is holding, trend is likely to reverse to the upside.
Nearest resistance could be 61.8% Fibs retracement level, that is $0.15, which could provide a potential growth of 60% in the medium term. If that resistance is broken, an exponential growth by Status could take place.
It is important to watch the support area in general and $0.086 level in particular, as daily break and close would invalidate bullish outlook and could result in a decline towards the previous support at $0.074

Road Trip to Top of Cherry Hill!
Weekly
Looking at out highest timeframe we see price has once again reached our major support at 1200 expecting a double bottom to form at this level. Stochastic RSI showing momentum is heading towards the downside, however remember indicates rely on price action. Let’s take a look at our other timeframes.
Daily
Shifting to our pattern timeframe we get a better perspective of our double bottom formation. Waiting for a daily close above 1300 before taking a buy, stochastic rsi showing momentum is heading towards the upside.
4Hour
Finally looking at our trigger timeframe we see price has also formed a double bottom inside our smaller timeframe, while our bigger timeframe double bottom forms. 4Hour close above 1300 activates our trade, stochastic rsi showing momentum slowing down from it’s short term bullish run.
Conclusion
Wait for the daily close above 1300

LONG CoinLoop Signal: Status (SNT)Status (SNT)
Indicator: Price beginning an exponential curve. Buy volume increasing.
Probability: 62%

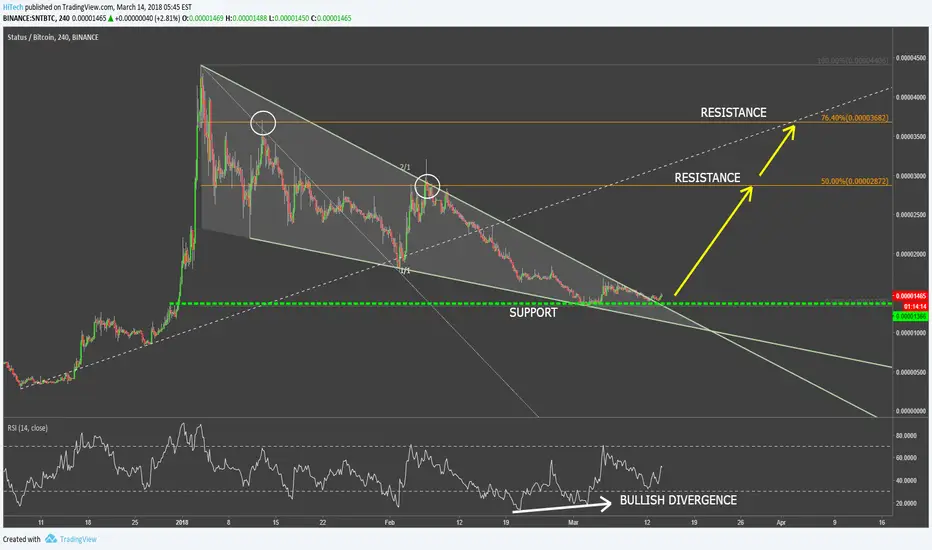
Status Network Token vs Bitcoin Uptrend?Status Network Token has found at 1500 satoshis area, where price formed a double bottom and at the same time RSI oscillator formed a bullish divergence suggesting the reversal of the trend. Yesterday SNT/BTC broke above the 2/1 Gann Fan trendline, which could be the first signal of the buying opportunity presence.
If the support will hold, the price is likely to start moving upwards, towards one of the Fibonacci retracement levels that corresponds to the previous resistance levels. The first target is at 2870 satoshis, if broken, the second target should be at 76.4% Fibonacci retracement level, that is 3680 satoshis.