AES Corporation - Short term view with strong supportSo first of all both price and indicators are confirming the downtrend.
Today NYSE:AES opened with a gap succeeding yesterday's equilibrium in price with doji candles.
The price is still in the middle of the regression line and in the next few days the price don't seems to be close to upper 2 SD.
In the print above the yellow line shows the support at $11.43. The image's time horizon starts at the end of 2006.
Furthermore looking at short ratio available online the value is about 2,7 from mid October as well as more than 22M short interest
Standard Deviation (Volatility)

The Power of Standard Deviation (STDEV)Hello everyone,
This morning was a great chance to show the power of using Standard Deviation (STDEV)
for targets.
I usually put it on the London session. That's what I've done here.
As you can see, the levels are almost identical to the ones marked using market structure.
This is another useful advanced tool that can add to your arsenal to help bring your trading to the next level.
This is very easy to use, and you can use the FIB tool with these levels to make your own STDEV tool.
I hope you found this insightful and useful.
Happy Holidays!

Outlook for the Year and the Years to ComeTheoretically, the price of oil should keep going higher as the finite resource is being vehemently overused. Yet, somewhat paradoxically, the advent of alternative energy could produce the opposite effect. Between those two dynamics lie the supply-and-demand pump of the oil states, tweaking the price higher and lower as it fits the pockets of the developed world. The chart shows that oil rose from the ashes from 2016, which coincided ever since with the rise of the markets to the point of hyperinflation last year. Now as the economy is falling down, oil took an adverse course, partly due to the war in Ukraine, but largely due to the status of inflation. Politically and economically, the outcome doesn't seem to change soon. Mathematically, this is also confirmed. The orange line in the chart shows the bisecting trend line which was crossed decisively this year, marking it more likely that prices would stay on the higher levels for some years to come. Regarding Fibonacci levels, the higher point for this year seems to be around 140, to be surrounded by a relative ease in pricing, provided that nothing substantial happens at the macro political level.

Get ready for some great Trading Weather
NQ1! broke the 50w SMA but we need to backtest and confirm the break IMO. That said, there are lots of headwinds this coming week with the Fed tightening, overall weakening Economy, margin compression etc
NQ1! is now trading -4 standard deviations from its 50dma
I strongly believe that we can use this bounce for longs - as distribution will want to sell at higher prices. The environment has turned from "But the Dip" into "Sell the Rally"
ES1! is ALMOST to its 50w SMA, and its below its Bollinger bands on daily. - I would love to see a tag the 50w and retrace on the daily
Notice ES1! on the weekly, the regular Bollinger band is just below the 50w SMA
Short version - I am looking to Long indexes for a Technical bounce into resistance, before selling the rallies for further downside.

Trade BTC by Trading VolatilityThis Daily TF Bitcoin chart shows just how accurate these volatility indicators are.
The pure LaPlace bands (see by the crosses on the right hand side of the chart) are exceedingly accurate on low TFs like the 1 min - 1 hour TF.
The Normal distribution bands (the lines on the right hand side of the chart) are excellent on higher TFs like this daily chart you see.
The Gaussian bands (on the left hand side of the chart) are exceptionally strong as well, as is the APP indicator (under the price pane on the left), as well as Your Mom's Boss (YMB) (bottom left).
The Alpha CV and the DB56 Returns (the top two on the left side) are very useful in quick scalps and longer term trades.
The AVR indicators (bottom 3 on the right side) is incredibly useful and probably the cornerstone of my volatility trading strategies. While you may think it seems a little similar to some other indicators out there that measure volatility over time, AVR is indeed quite different and contains a number of features that others simply do not have baked-in like AVR does, not the least of which, of course, is the massively useful AVR Info Panel.
Frankly, they're all very POWERFUL and super handy for anyone trading volatility .

Elon Musk Tweets affect Bitcoin Price? Really?No!
It's the Volatility.
See where he tweeted and where Price Action moved to and where it reverted.
It's all by the numbers, baby.
Proper maths.
Standard Deviation of Returns.
See it on this chart with some of the best volatility indicators you can find right here on TradingView thanks to @balipour and his crew.

It Do Go DownI believe we are at one of the two white dotted lines.
Option 1 is to breach ATH by some significant part, maybe 2x with the rest of available liquidity, knowing that 2x BTC would also mean a sizeable + on the stock market & shit.
Option 2 is to have one last push to blash trough for the whales & Insitutions to collect. Shake out
Either we go up then go down elevator mode.
I think Price Manip is going hard so we may stagnate till 31st of March and be the toyboys & then the Pyramid collapses.
Either way considering it's going down with all the rest so i started moving to Indices & Value stonks where to put the cash during the correction.
And if those tank too then we have other problems.

BTC Daily: Standard Deviations and Better MAFFS! Rule this gameDaily Bitcoin TF shows that once again ... standard deviations and rule this game.
* The start of today's candle got an indication from Reverse WaveTrend to sell, and down it went ... and then ...
* The downward wick of today's candle (so far) hit not just the Daily 1SD to the downside ... it also hit at that same place, the Markzillator Ephemeral Power Mean, AND the Rev Fisher Stop Line!
* Once again ... that was a perfect entry with the BApig Indicators, with a relatively quick ascent to a profitable point, with 3 Better MAFFS! indicators right there, and that's without the additional confirmations below.
* Impossible RSI flattening out in its descent, as MOM continues to head to the upside, even if slowing down a little.
* Of course if price heads south again, I could close it in profit or wait for tomorrow (as it is a daily tf trade) to see how it plays out.
* So far, it looks good to the upside on the lower TFs. impossible RSI and MOM, for instance, on the 2h, are looking ripe for a good rise today.
* Of course keep in mind it's the first Friday of the month. So there should be plenty of good volatility today, as usual.
h/t to @balipour and his crew for making these BApig Indicators! They make trading volatility accessible, learnable, relatively easy. See his Published Scripts page right here on TradingView and look at all the amazing tools he gives out, entirely for free! This man and the team he leads, surely deserves some kind of prize for being so generous with a community of traders! They are truly the most underappreciated group of indicator makers here on TradingView. What they have done for traders is frankly, revolutionary. This changes the game. Reddit, WallStreetBets (the new bane of careless hedge fund managers) ain't seen nothin', yet. You just wait 'till every in-the-know or smart Retail Trader starts trading with these tools. It'll make what happened with GameStop, AMC et al, look like child's play.
Wall Street thinks you're the dumb money. Yes, I'm talking to you. You're on TV. They assume you're an idiot. Don't be offended. Emotions have no place in trading. Use their assumptions against them. These tools are designed to give you an edge, and the proof is in the pudding. They give you both sides of the equation, so you never have to wonder "up or down?" like all the clueless fools who use voodoo TA and other gimmicks that all use poor maths or no maths at all. The probabilities and statistics that the BApig Indicators give you, tell you precisely the likelihood. Don't just take my word for it! See it for yourself.
As the bitcoin mantra goes; Don't trust. Verify.
The best part about BApig indicator trading tools: You do not need to be great at maths! They did all that work for you! Their latest Probability Cone with Kelly Ratio indicator (one of their premium indicators with an extremely high rate of accuracy) even gives you the position size, optimal leverage and take profit and stop loss numbers right on a panel on the chart! This saves you valuable time and effort, especially if you like to scalp low TFs, and time is of the essence!
All you have to do, is learn to use the indicators, and there are free-to-join online communities on discord set up to help you do that.
Of course, this is all my opinion. Do your own research. You are responsible for your own trades and actions. Don't invest anything you can't afford to lose. yada yada yadadadadada.

Everything I Thought I Knew About Trading and TA Was WRONG.For some years, I had been learning trading and Technical Analysis (TA).
As I progressed, I stumbled into Volatility trading and the Better Maths behind the indicators made by Balipour and Pig.
Comparing Traditional TA indicators and maths to the next level trading indicators built on better mathematics, is like comparing a car to a rocketship. Sure, both will get you around, but one is far more likely to help you reach new heights in your experience, while the other is more likely to keep you moving around more or less on the ground, until the vehicle breaks down.
Lesson: Things to know about trading volatility:
The standard deviation of returns is Volatility.
Returns are Mean reverting. Price isn't.
Price Action is impacted by Geometric Brownian Motion. This means there is some amount of Randomness in every candle.
Time decay and Entropy affect Returns.
These things and more are all measurable and you can learn how to use the indicators that measure them, complete with official documentation, tutorial documents, live streams, youtube videos, active discord communities, and more.
It took me about a week to get the hang of trading strictly using these indicators and the others from Ba+Pig. I have not traded with traditional TA indicators since the end of August, 2020. And I haven't looked back. The performance comparison is night and day.
The lesson here is that TA does not work consistently enough in this digital age of fast computers running better mathematics algorithms and high frequency trades.
Do yourself a favor. Stop drawing subjective lines, shapes, patterns and other ridiculous art for any charting you use to trade. Learn volatility trading. Learn better maths. Trading is not voodoo art and magic. There is no secret sauce. The mathematics give you the vast majority of the info you need to succeed in your trades. You just have to know how to use that info.
Even the world's best quant firms do not have better maths than these indicators. They may have more and better data to analyze, but the maths are the maths. The formulas are the same high quality level of mathematics that can actually be used to calculate HVP, Probability Cones, Expected Moves, Time Decay and Entropy, as well as Hurst Exponent , DWT, MOM, Impossible RSI , Reverse RSI Div , Correlation Coefficient and more!
If you want to get their cutting edge indicators for yourself, you can do so by checking all the free indicators that @balipour has posted on his TradingView account's Published Scripts page. And to try or get the Premium BApig Indicators, if you're unable to find it on your own, then you may ask in the discord community or DM me and I'll be happy to let you know where to find them.
This is not financial advice. This is just my opinion. Do your own research. You'll be glad you did. :)

BTC:USD -- Acceleration gaining, pulling up Momentum.Chart Analysis
Clear support on the 61.8% Fib-retrace level maintained.
Waiting for a Buy signal from Cyber Ensemble script.
PRISM Analysis
pRSI's Stoch now close to oversold state.
Acceleration/Jerk-Ribbon reversing up, as the Snap-Oscillator pierces back into the positive; while will pull Momentum up again.
Updated evolving analysis leading up to the current chart.
Evidence that we are presently in a bull market phase.

BTC:USD - Volume Confirmation analysis (6hrly Chart analysis)DVI = Directional Volume Index (which shows the volume-confirmed trend).
Narrowing of DVI stdev Bands + DVI piercing above stdev Bands.
Zooming in: Ichicloud turning green again.

Tight historical correlation (0.90) BIOtech AZN MRNAShow how to compare two stocks, how to visualize 1 & 2 SD moves with BB bands as well as correlation coefficients with easy 1SD and Sigma over 0.90 .
Recent AZN and MRNA biotech stocks have had Volitity over 120 and opportunities for trades with moves on news.
Follow for changes and moves back to the MEAN!

WANBTC Target: 0.000062 BTCSee earlier published WANBTC chart, and crude Trade Logs:
and also see my post on BTC dominance:
Setting stop-loss at 0.000046 BTC -- using my Fast Aeondrift (stdev based bands) to suggest suitable stop-limit levels to consider.
~ * ~ * ~ * ~ * ~ * ~ * ~ * ~ * ~ * ~ * ~ * ~ * ~ * ~ * ~ * ~ * ~ * ~ * ~ * ~ * ~
Note: In no way is this intended as a financial/investment/trading advice. You are responsible for your own investment decisions and trades.
Please exercise your own judgement for your own trades base on your own risk-aversion level and goals as an investor or a trader. The use of OTHER indicators and analysis in conjunction (tailored to your own style of investing/trading) will help improve confidence of your analysis, for you to determine your own trade decisions.
~ * ~ * ~ * ~ * ~ * ~ * ~ * ~ * ~ * ~ * ~ * ~ * ~ * ~ * ~ * ~ * ~ * ~ * ~ * ~ * ~
Please check out my other indicators sets and series, e.g.
LIVIDITIUM (dynamic levels),
AEONDRIFT (standard deviation bands),
FUSIONGAPS (MA based oscillators),
MAJESTIC (Momentum/Acceleration/Jerk Oscillators),
PRISM (PSAR based oscillator, with RSI/StochRSI as well as Momentum/Acceleration/Jerk indicators),
and more to come.
Constructive feedback and suggestions are welcome.
If you like any of my set of indicators, and it has benefited you in some ways, please consider tipping a little to my HRT fund. =D
cybernetwork @ EOS
37DzRVwodp5UZBYjCKvVoZ5bDdDqhr7798 @ BTC
MPr8Zhmpsx2uh3F5R4WD98MRJJpwuLBhA3 @ LTC
1Je6c1vvSCW7V2vA6RYDt6CEvqGYgT44F4 @ BCH
AS259bXGthuj4VZ1QPzD39W3ut4fQV5giC @ NEO
rDonew8fRDkZFv7dZYe5w3L1vJSE51zFAx @ Ripple XRP
0xc0161d27201914FC0bAe5e350a193c8658fc4742 @ ETH
GAX6UDAJ52OGZW4FVVG3WLGIOJLGG2C7CTO5ZDUK2P6M6QMYBJMSJTDL @ Stellar XLM
xrb_16s8cj8eoangfa96shsnkir3wctdzy76ajui4zexek6xmqssweu85rdjxrt4 @ Nano
~ JuniAiko
(=^~^=)v~

WANBTC: Setting buy back order of WAN btwn 0.00003-0.0000263 BTCEarlier, after the massive pump, I've set limit sell of WAN at 0.0000509 BTC which got triggered.
Setting a buy-back limit buy orders of WAN, cost-averaging btwn 0.00003-0.0000263 BTC, with the aid of the LIVIDITIUM dynamic band levels.
See: t.me
QUOTE "I still think WAN still has strength to continue up more personally. But Im setting stop-losses to protect my gains so far at 0.0000509 BTC/WAN personally, base on my Fast AEONDRIFT script to help suggest suitable stop limit levels on the 5mins candles chart."
t.me

BTC have further to fall, but to complete massive Bull Flag?First target = 9112 USD
Second target = 8500 USD
and if that fails, BTC will likely fall to 7230.
And if it finds supports and rebounds at any of these levels, I speculate that there is a chance this final "capitulation" to drop out the "weak-hands" effectively completes the massive bull flag formation, to wind up one final time to propel BTC to fresh new heights.
Need to closely monitor the RSI, Ichimoku cloud, as well as momentum/acceleration oscillators and MA signals (e.g. using the FUSIONGAPS and MAJESTIC-X oscillators) to see how things play out.
See also:


NULS: Exploring possible scenarios from here on out.Nice gains so far, but should I hold on or lock-in BTC gains?
See previous analysis and discussions:

Wanted to buy some NULS "because fundamentals" but..Chart looks too horrible!
Its the same with most altcoins atm.
Chart's seems bullish on BTC though.
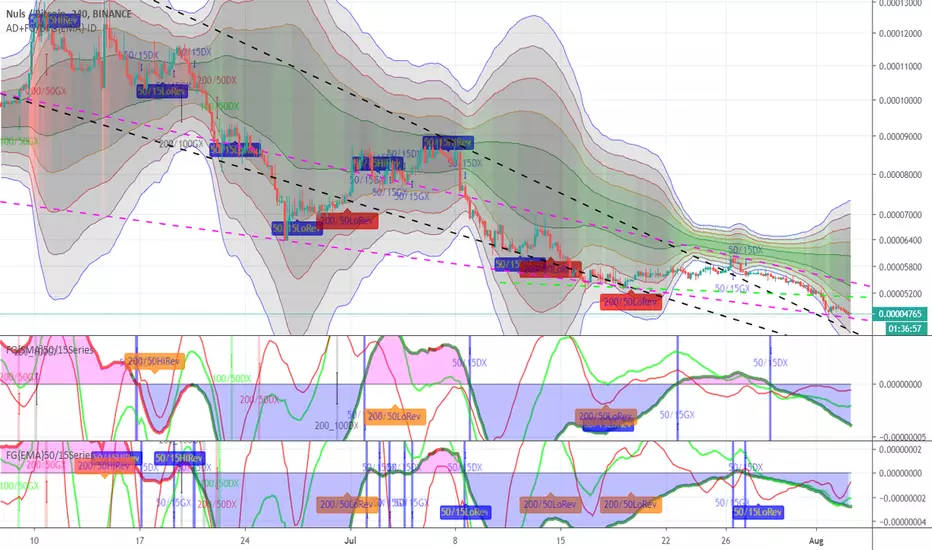
Nuls (and most altcoins) stuck in downward trend vs. BTC.Using Nuls as an example: since I was considering if I should buy some now, due to my personal interest in its fundamentals. However its chart, like with most other altcoins, look horrible at the moment.
Here, the chart shows NULs finding support on top of the thick-green LVDT line on the 3hr chart (note, for BTC, the 3hr, as well as 4hr, and especially the 1D chart works better).
However, LVDT guide bands are in an overall downward trend vs. BTC. I will wait till the overall LVDT bands to plateau before I am confident of investing into altcoins again.
My indicators used:
LIVIDITIUM + 2STDEV-AEONDRIFT {EMA}
LVDT guide-bands + 2 level Standard Deviation bands + with a set of detection algorithms implemented.
FUSIONGAPS {EMA} ( color fills removed here)
Net market Bullish/Bearish state oscillator, with DFG and D2FG indicators implemented.
also check out the following accompanying oscillators.
DIFFERENTIAL FUSIONGAPS {DFG} = Momentum oscillator
DOUBLE-DIFFERENTIAL FUSIONGAPS {D2FG} = Accelerator oscillator
Also the FUSIONGAPS{EMA} 50/15-Series = that shows the FG, DFG, and D2FG lines for 50/15 {EMA}
{SMA} version also available.

Looking to buy ADA at 0.00000388 BTCBTC getting bullish again. ADA seem to still have some way to fall vs. BTC (when BTC pumps) base on the FUSIONGAPS price momentum and acceleration accelerators.
Looking at both Fib-retrace, trend lines, as well as LVDT (Lividitium) critical levels to select potential entry points and targets.

Link Bottoming Soon? Short/Mid-term analysis.Using my FUSIONGAPS oscillator.
See also my analysis on BTCUSD using my FUSIONGAPS oscillator.

Demo of how my FUSIONGAPS indicator might be used.Link to my indicator:
According to this chart, it appears BTC still have some downside to go, before a turnaround.
Look out for a significant positive peak (turn-around) of the 50/15 blue oscillator (blue color fill) as a possible indication of a good position to enter.
Possible indication of good price points to exit seems to be where the 50/15 oscillator (fuchsia color fill) have peaked in the negative region.
Not a financial/trading/investment advice. Exercise your own judgement and take responsibility for your own trades. ;)
And if you like this set of indicators, and it has benefited you in some ways, please consider tipping a little to my HRT fund. =D
cybernetwork @ EOS
37DzRVwodp5UZBYjCKvVoZ5bDdDqhr7798 @ BTC
MPr8Zhmpsx2uh3F5R4WD98MRJJpwuLBhA3 @ LTC
1Je6c1vvSCW7V2vA6RYDt6CEvqGYgT44F4 @ BCH
AS259bXGthuj4VZ1QPzD39W3ut4fQV5giC @ NEO
rDonew8fRDkZFv7dZYe5w3L1vJSE51zFAx @ Ripple XRP
0xc0161d27201914FC0bAe5e350a193c8658fc4742 @ ETH
GAX6UDAJ52OGZW4FVVG3WLGIOJLGG2C7CTO5ZDUK2P6M6QMYBJMSJTDL @ Stellar XLM
xrb_16s8cj8eoangfa96shsnkir3wctdzy76ajui4zexek6xmqssweu85rdjxrt4 @ Nano
~JuniAiko
(=^~^=)v~

FUSIONGAPS DEMO2: BTCUSD winding up for another massive pump?Another chart analysing DEMO using my FUSIONGAPS oscillator showing a possible mid-term trend of BTC, by comparing on historical oscillator trends/patterns.
Link to my FUSIONGAPS indicator:
An earlier chart showing how to use FUSIONGAPS to pick possible good time/price for entry/exit.
Not a financial/trading/investment advice. Exercise your own judgement and take responsibility for your own trades. ;)
And if you like this set of indicators, and it has benefited you in some ways, please consider tipping a little to my HRT fund. =D
cybernetwork @ EOS
37DzRVwodp5UZBYjCKvVoZ5bDdDqhr7798 @ BTC
MPr8Zhmpsx2uh3F5R4WD98MRJJpwuLBhA3 @ LTC
1Je6c1vvSCW7V2vA6RYDt6CEvqGYgT44F4 @ BCH
AS259bXGthuj4VZ1QPzD39W3ut4fQV5giC @ NEO
rDonew8fRDkZFv7dZYe5w3L1vJSE51zFAx @ Ripple XRP
0xc0161d27201914FC0bAe5e350a193c8658fc4742 @ ETH
GAX6UDAJ52OGZW4FVVG3WLGIOJLGG2C7CTO5ZDUK2P6M6QMYBJMSJTDL @ Stellar XLM
xrb_16s8cj8eoangfa96shsnkir3wctdzy76ajui4zexek6xmqssweu85rdjxrt4 @ Nano
~JuniAiko
(=^~^=)v~
