Stellar (XLM) - February 10Hello?
Traders, welcome.
If you "follow", you can always get new information quickly.
Please also click "Like".
Have a nice day.
-------------------------------------
(XLMUSD 1W Chart)
(All: )
It needs to move above the 0.2926 1600 point to turn into an uptrend.
However, it should move above the 60 SMA level to accelerate the uptrend.
0.4029 3161-0.4479 The 8284 section is expected to receive primary resistance.
Keeping the price above the 0.2343 8790 point is paramount.
However, it may temporarily drop near the 0.1642 0803 point, so careful trading is required.
A decline from the 0.1642 0803 point could lead to below the 0.0777 8453 point.
(1D chart)
Since a volume profile section is formed near the 0.1855 4008 point, it is important to maintain the price above this section.
-------------------------------------
(XLMBTC 1W chart)
0.0000 1103-0.0000 1288 or higher: Expected to create a new wave.
You need to make sure you can get out of the bottom section by climbing above the 0.0000 0746 point.
------------------------------------------
We recommend that you trade with your average unit price.
This is because, if the price is below your average unit price, whether the price trend is in an upward trend or a downward trend, there is a high possibility that you will not be able to get a big profit due to the psychological burden.
The center of all trading starts with the average unit price at which you start trading.
If you ignore this, you may be trading in the wrong direction.
Therefore, it is important to find a way to lower the average unit price and adjust the proportion of the investment, ultimately allowing the funds corresponding to the profits to be able to regenerate themselves.
------------------------------------------------------------ -----------------------------------------------------
** All indicators are lagging indicators.
Therefore, it is important to be aware that the indicator moves accordingly with the movement of price and volume.
However, for convenience, we are talking in reverse for the interpretation of the indicator.
** The MRHAB-O and MRHAB-B indicators used in the chart are indicators of our channel that have not been released yet.
(Since it was not disclosed, you can use this chart without any restrictions by sharing this chart and copying and pasting the indicators.)
** The wRSI_SR indicator is an indicator created by adding settings and options to the existing Stochastic RSI indicator.
Therefore, the interpretation is the same as the traditional Stochastic RSI indicator. (K, D line -> R, S line)
** The OBV indicator was re-created by applying a formula to the DepthHouse Trading indicator, an indicator disclosed by oh92. (Thanks for this.)
** Support or resistance is based on the closing price of the 1D chart.
** All descriptions are for reference only and do not guarantee a profit or loss in investment.
(Short-term Stop Loss can be said to be a point where profit and loss can be preserved or additional entry can be made through split trading. It is a short-term investment perspective.)
---------------------------------
STELLAR

Stellar shortStellar bounced off the resistance area. Asset bounced off the descending trendline. Bearish movement to support level at 0.19 is expected to happen.

XLM, 2 SCENARIOS ARE AVAILABLE...!First, you should see the full view of the XLM then go into the details:
As you see, we are approaching to a very significant area. Basically, we have two different scenarios:
1. Bullish: we should reach the red highlighted zone closed daily candle over it.
--------------------------
2.Bearish: we need to see a confirmed break from the blue highlighted dynamic support.
--------------------------
Also, there are some good news coming about Stellar...
I hope to see the 1st phase of my analysis >_-

XLM short play- Broke through crucial support and is consolidating below it.
- No support up until $0.12
- EMA's curling away from each other, signaling more downward movement might be on the horizon

BITCOIN x ETHEREUM - FInd Crypto Bottom Using This!Its no secret that Bitcoin and Ethereum are the most well known cryptocurrency out there and are leading the way for other, newer cryptocurrencies. Bitcoin acts as an index for all cryptocoins - if Bitcoin goes up, all crypto goes up. If Bitcoin goes down, all crypto goes down.
We can use this to find the reversal zones for all the other cryptocurrencies.
From the chart you can see that Bitcoin and Ethereum have almost the same price behaviour. Both showing us that we're in an expanding correction and approaching a significant level which we can reverse from.
For Bitcoin - it is the 30k level we are watching.
For Ethereum - it is the 1700 level we are watching.
We can see that we have a little way to go until we reach the bottom. We can use this to see which other cryptocurrencies are near to the bottom and ready ourselves for the inevitable reversal.
See below for some of the other crypto that are near the bottom or are at the bottom.
CARDANO:
RIPPLE:
KADENA:
LITECOIN:
POLKADOT:
STELLAR:
TRON:
VECHAIN:
CHAINLINK:
Feel free to post your charts below!

Crypto Market Slides as Stocks Get Hammered, Bitcoin Falls BelowThe crypto market continued lower over the past 24 hours following a selloff led by technology stocks in the US on Thursday. The falling prices were accompanied by liquidations across the crypto market, with one analyst saying the leverage flush-out could potentially set the market up for a “relief rally.”
Here I show you my Reading expectations. Pur always stops. And Targets. Remember: After Trade is before the next trade.
You can be free. You can live and work anywhere in the world. You can be independent from routine and not answer to anybody.

Stellar | What is a plan for XLM ?Last month, the Stellar Development Foundation (SDF) participated in a cryptocurrency hearing hosted by the U.S. House Committee on Financial Services.
𝐂𝐄𝐎 𝐃𝐞𝐧𝐞𝐥𝐥𝐞 𝐃𝐢𝐱𝐨𝐧 𝐩𝐫𝐞𝐬𝐞𝐧𝐭𝐞𝐝 𝐭𝐡𝐞 𝐭𝐞𝐜𝐡𝐧𝐨𝐥𝐨𝐠𝐲 𝐨𝐟 𝐭𝐡𝐞 𝐒𝐭𝐞𝐥𝐥𝐚𝐫 𝐝𝐞𝐜𝐞𝐧𝐭𝐫𝐚𝐥𝐢𝐳𝐞𝐝 𝐩𝐚𝐲𝐦𝐞𝐧𝐭 𝐬𝐲𝐬𝐭𝐞𝐦 𝐚𝐧𝐝 𝐢𝐭𝐬 𝐚𝐩𝐩𝐥𝐢𝐜𝐚𝐭𝐢𝐨𝐧𝐬. 𝐖𝐢𝐭𝐡 𝐭𝐡𝐞 𝐫𝐞𝐜𝐞𝐧𝐭 𝐧𝐞𝐰𝐬 𝐭𝐡𝐚𝐭 𝐔𝐤𝐫𝐚𝐢𝐧𝐞 𝐚𝐧𝐝 𝐌𝐞𝐱𝐢𝐜𝐨 𝐰𝐢𝐥𝐥 𝐛𝐞 𝐮𝐬𝐢𝐧𝐠 𝐒𝐭𝐞𝐥𝐥𝐚𝐫 𝐭𝐨 𝐫𝐮𝐧 𝐭𝐡𝐞𝐢𝐫 𝐝𝐢𝐠𝐢𝐭𝐚𝐥 𝐜𝐮𝐫𝐫𝐞𝐧𝐜𝐢𝐞𝐬, 𝐒𝐭𝐞𝐥𝐥𝐚𝐫 𝐢𝐬 𝐨𝐧𝐜𝐞 𝐚𝐠𝐚𝐢𝐧 𝐢𝐧 𝐭𝐡𝐞 𝐬𝐩𝐨𝐭𝐥𝐢𝐠𝐡𝐭.
The current status of Stellar:
In its seven years of development, Stellar used to have an illustrious history.
It was once a top 10 blockchain project in terms of Market Cap. And even set a record for a 100x increase in token price before DeFi Summer.
𝐔𝐧𝐥𝐢𝐤𝐞 𝐩𝐫𝐨𝐣𝐞𝐜𝐭𝐬 𝐢𝐧 𝐭𝐡𝐞 𝐜𝐫𝐲𝐩𝐭𝐨 𝐰𝐨𝐫𝐥𝐝, 𝐒𝐭𝐞𝐥𝐥𝐚𝐫 𝐡𝐚𝐬 𝐛𝐮𝐢𝐥𝐭 𝐦𝐚𝐧𝐲 𝐩𝐚𝐫𝐭𝐧𝐞𝐫𝐬𝐡𝐢𝐩𝐬 𝐰𝐢𝐭𝐡 𝐭𝐡𝐞 𝐭𝐫𝐚𝐝𝐢𝐭𝐢𝐨𝐧𝐚𝐥 𝐟𝐢𝐧𝐚𝐧𝐜𝐢𝐚𝐥 𝐜𝐨𝐦𝐦𝐮𝐧𝐢𝐭𝐲, 𝐢𝐧𝐜𝐥𝐮𝐝𝐢𝐧𝐠 𝐈𝐁𝐌 𝐚𝐧𝐝 𝐧𝐚𝐭𝐢𝐨𝐧𝐚𝐥 𝐟𝐢𝐧𝐚𝐧𝐜𝐢𝐚𝐥 𝐢𝐧𝐬𝐭𝐢𝐭𝐮𝐭𝐢𝐨𝐧𝐬.
However, according to our Analytics, Stellar is currently growing slowly.
After years of growth, it has a TVL of around US$1.5 billion to date, ranking it 40th among public chains, and this rate is far less than that of the up-and-coming public chains that are just starting.
Stellar’s ecosystem is highly underdeveloped, with only two projects at present and very homogeneous.
Reasons for Stellar’s Slow Growth:
Poor Ecosystem Incentives, At the time of Stellar’s creation, an inflation mechanism was set up to prevent a reduction in the circulation of XLM.
Each year the inflation scheme generates tokens equal to 1% of Stellar’s total supply and accounts for more than 0.05% of Stellar’s total share receiving additional XLM coins.
𝐓𝐡𝐞 𝐩𝐮𝐫𝐩𝐨𝐬𝐞 𝐨𝐟 𝐭𝐡𝐞 𝐢𝐧𝐟𝐥𝐚𝐭𝐚𝐛𝐥𝐞 𝐦𝐞𝐜𝐡𝐚𝐧𝐢𝐬𝐦 𝐢𝐬 𝐭𝐨 𝐢𝐧𝐜𝐞𝐧𝐭𝐢𝐯𝐢𝐳𝐞. 𝐇𝐨𝐰𝐞𝐯𝐞𝐫, 𝐚𝐧𝐚𝐥𝐲𝐬𝐢𝐬 𝐬𝐡𝐨𝐰𝐬 𝐭𝐡𝐚𝐭 𝟗𝟖% 𝐨𝐟 𝐭𝐡𝐞 𝐗𝐋𝐌 𝐢𝐧𝐜𝐫𝐞𝐦𝐞𝐧𝐭𝐚𝐥 𝐜𝐨𝐢𝐧𝐬 𝐰𝐞𝐧𝐭 𝐭𝐨 𝐭𝐡𝐞 𝐒𝐃𝐅 (𝐒𝐭𝐞𝐥𝐥𝐚𝐫 𝐃𝐞𝐯𝐞𝐥𝐨𝐩𝐦𝐞𝐧𝐭 𝐅𝐨𝐮𝐧𝐝𝐚𝐭𝐢𝐨𝐧) 𝐚𝐧𝐝 𝐝𝐢𝐝 𝐧𝐨𝐭 𝐛𝐞𝐧𝐞𝐟𝐢𝐭 𝐭𝐡𝐞 𝐒𝐭𝐞𝐥𝐥𝐚𝐫 𝐩𝐫𝐨𝐣𝐞𝐜𝐭.
One reason for this is that the foundation has been involved since the early days and therefore can participate in the annual distribution of newly generated tokens.
𝐓𝐡𝐞 𝐬𝐞𝐜𝐨𝐧𝐝 𝐫𝐞𝐚𝐬𝐨𝐧 𝐢𝐬 𝐭𝐡𝐚𝐭 𝐦𝐨𝐬𝐭 𝐒𝐭𝐞𝐥𝐥𝐚𝐫 𝐩𝐚𝐫𝐭𝐢𝐜𝐢𝐩𝐚𝐧𝐭𝐬 𝐣𝐨𝐢𝐧𝐞𝐝 𝐝𝐮𝐫𝐢𝐧𝐠 𝐭𝐡𝐞 𝟐𝟎𝟏𝟕 𝐛𝐮𝐫𝐬𝐭 𝐚𝐧𝐝 𝐚𝐫𝐞 𝐬𝐩𝐞𝐜𝐮𝐥𝐚𝐭𝐢𝐯𝐞 𝐮𝐬𝐞𝐫𝐬 𝐰𝐢𝐭𝐡 𝐥𝐢𝐭𝐭𝐥𝐞 𝐢𝐧𝐯𝐨𝐥𝐯𝐞𝐦𝐞𝐧𝐭 𝐢𝐧 𝐭𝐡𝐞 𝐞𝐜𝐨𝐬𝐲𝐬𝐭𝐞𝐦.
The Omission of SDF:
The foundation holds a large number of tokens due to inflationary mechanisms. However, the foundation has failed to use these tokens to help the project function better. In 2019 the foundation has only consumed $40,000 for community projects.
𝐇𝐚𝐯𝐢𝐧𝐠 𝐚 𝐥𝐚𝐫𝐠𝐞 𝐚𝐦𝐨𝐮𝐧𝐭 𝐨𝐟 𝐦𝐨𝐧𝐞𝐲 𝐛𝐮𝐭 𝐧𝐨𝐭 𝐮𝐬𝐢𝐧𝐠 𝐢𝐭 𝐰𝐞𝐥𝐥 𝐦𝐚𝐩𝐬 𝐨𝐮𝐭 𝐭𝐡𝐞 𝐢𝐧𝐚𝐜𝐭𝐢𝐨𝐧 𝐨𝐟 𝐭𝐡𝐞 𝐟𝐨𝐮𝐧𝐝𝐚𝐭𝐢𝐨𝐧.
In 2019, the Stellar Development Foundation initially mitigated the token mismatch by ending its inflation plan and destroying more than 50% of its tokens. However, XLM still needs to expand its usage scenario.
The Road Ahead for Stellar, Although Stellar ended up lagging since its launch, it is set to make a comeback from 2021.
With the explosion of DeFi projects, multi-currency, cross-chain transfers are a current blockchain pain point, and Stellar offers one of the solutions that define a new standard for global payments.
𝐒𝐭𝐞𝐥𝐥𝐚𝐫 𝐡𝐚𝐬 𝐠𝐚𝐢𝐧𝐞𝐝 𝐦𝐚𝐫𝐤𝐞𝐭 𝐫𝐞𝐜𝐨𝐠𝐧𝐢𝐭𝐢𝐨𝐧 𝐭𝐡𝐫𝐨𝐮𝐠𝐡 𝐞𝐱𝐩𝐚𝐧𝐝𝐞𝐝 𝐩𝐚𝐲𝐦𝐞𝐧𝐭 𝐜𝐨𝐦𝐩𝐚𝐧𝐢𝐞𝐬, 𝐧𝐚𝐭𝐢𝐨𝐧𝐚𝐥 𝐛𝐚𝐧𝐤𝐬, 𝐟𝐢𝐧𝐚𝐧𝐜𝐢𝐚𝐥 𝐢𝐧𝐬𝐭𝐢𝐭𝐮𝐭𝐢𝐨𝐧𝐬, 𝐚𝐧𝐝 𝐦𝐨𝐫𝐞, 𝐠𝐚𝐢𝐧𝐢𝐧𝐠 𝐫𝐞𝐜𝐨𝐠𝐧𝐢𝐭𝐢𝐨𝐧 𝐟𝐫𝐨𝐦 𝐦𝐮𝐥𝐭𝐢𝐩𝐥𝐞 𝐩𝐚𝐫𝐭𝐢𝐞𝐬 𝐚𝐧𝐝 𝐬𝐞𝐯𝐞𝐫𝐚𝐥 𝐬𝐭𝐫𝐨𝐧𝐠 𝐩𝐚𝐫𝐭𝐧𝐞𝐫𝐬 𝐚𝐬 𝐚 𝐠𝐥𝐨𝐛𝐚𝐥 𝐬𝐨𝐥𝐮𝐭𝐢𝐨𝐧 𝐟𝐨𝐫 𝐜𝐫𝐨𝐬𝐬-𝐛𝐨𝐫𝐝𝐞𝐫 𝐩𝐚𝐲𝐦𝐞𝐧𝐭𝐬.
EVM Compatibility:
The incompatibility of Stellar contracts with EVM means that developers cannot quickly deploy projects on Ethereum to Stellar in February 2021.
FlareNetworks has announced the integration of Stellar Lumens (XLM) with its smart contract platform, thus enabling compatibility with the Ethereum blockchain. If successfully landed, Stellar will be even more scalable.
Stellar’s recent moves show that it continues to interface with the financial community and bridge the gap between traditional and on-chain payments.
𝐖𝐞 𝐜𝐚𝐧 𝐤𝐞𝐞𝐩 𝐚𝐧 𝐞𝐲𝐞 𝐨𝐧 𝐒𝐭𝐞𝐥𝐥𝐚𝐫 𝐚𝐧𝐝 𝐥𝐨𝐨𝐤 𝐟𝐨𝐫𝐰𝐚𝐫𝐝 𝐭𝐨 𝐢𝐭𝐬 𝐜𝐨𝐧𝐭𝐢𝐧𝐮𝐞𝐝 𝐝𝐞𝐯𝐞𝐥𝐨𝐩𝐦𝐞𝐧𝐭 𝐢𝐧 𝐬𝐨𝐥𝐯𝐢𝐧𝐠 𝐠𝐥𝐨𝐛𝐚𝐥 𝐩𝐚𝐲𝐦𝐞𝐧𝐭𝐬 𝐜𝐡𝐚𝐥𝐥𝐞𝐧𝐠𝐞𝐬.
𝐒𝐭𝐞𝐥𝐥𝐚𝐫 𝐢𝐬 𝐨𝐧𝐞 𝐨𝐟 𝐭𝐡𝐞 𝐦𝐨𝐬𝐭 𝐬𝐮𝐜𝐜𝐞𝐬𝐬𝐟𝐮𝐥 𝐩𝐫𝐨𝐣𝐞𝐜𝐭𝐬 𝐢𝐧 𝐭𝐡𝐞 𝐜𝐫𝐲𝐩𝐭𝐨 𝐦𝐚𝐫𝐤𝐞𝐭, 𝐚𝐧𝐝 𝐬𝐢𝐧𝐜𝐞 𝐢𝐭𝐬 𝐥𝐚𝐮𝐧𝐜𝐡, 𝐢𝐭 𝐡𝐚𝐬 𝐧𝐞𝐯𝐞𝐫 𝐛𝐞𝐞𝐧 𝐨𝐧 𝐭𝐡𝐞 𝐧𝐞𝐠𝐚𝐭𝐢𝐯𝐞 𝐬𝐢𝐝𝐞 𝐨𝐟 𝐭𝐡𝐞 𝐩𝐫𝐢𝐜𝐞 𝐜𝐡𝐚𝐫𝐭. 𝐈𝐭 𝐡𝐚𝐬 𝐛𝐞𝐞𝐧 𝐦𝐨𝐨𝐧𝐢𝐧𝐠 𝐦𝐚𝐢𝐧𝐥𝐲 𝐛𝐞𝐜𝐚𝐮𝐬𝐞 𝐨𝐟 𝐭𝐡𝐞 𝐢𝐧𝐜𝐫𝐞𝐝𝐢𝐛𝐥𝐞 𝐩𝐥𝐚𝐭𝐟𝐨𝐫𝐦 𝐭𝐡𝐞 𝐭𝐞𝐚𝐦 𝐡𝐚𝐬 𝐛𝐮𝐢𝐥𝐭 𝐨𝐯𝐞𝐫 𝐭𝐡𝐞 𝐲𝐞𝐚𝐫𝐬.
Stellar 2022 road map looks promising as the team pushes harder to keep the payment platform borderless, limitless, and powerful in DeFi space. With more products coming and improvement of the existing ones, $XLM has huge potential to continue mooning in 2022.
Stellar receives an average long-term technical score of 65 from InvestorsObserver's research based on historical trading patterns. The proprietary scoring system weighs price movement from recent months to a year, analyzes the coin's support and resistance levels, and where it is relative to long-term averages to determine whether it's a strong buy-and-hold investment opportunity. XLM currently holds a superior long-term technical analysis score than 65% of cryptos in circulation. This ranking metric is most useful to buy-and-hold type investors looking for strong steady growth when allocating their assets. coins with a high long and short-term technical score can help indicate assets that have bottomed out, providing investors a chance to 'buy the dip'.
Trading Analysis:
Stellar's price is -$0.0600000 (-19.70%) below its 100-day moving average price of $0.330000000 as its price at the moment sits at $0.250000000. Additionally, XLM is $0.0600000 (-5384.59%) higher than its 52-week low price of $0.200000000 while -$0.54000000 (-1222.75%) under its 52-week high of $0.800000000. The current trading price in relation to its long-term average along with its 52-week high and low, gives XLM an average long-term technical score of 65. Long-term trading movement of Stellar suggest that investors are neutral on the coin at the moment. Stellar has a market capitalization of $6,457,733,682.55 and a relatively high average daily volume with $2,067,837,419.32 worth of the currency traded over the typical 24 hour period. Over the last 24 hours, 𝐗𝐋𝐌'𝐬 𝐯𝐨𝐥𝐮𝐦𝐞 𝐢𝐬 𝐛𝐞𝐥𝐨𝐰 𝐢𝐭𝐬 𝐬𝐞𝐯𝐞𝐧 𝐝𝐚𝐲 𝐚𝐯𝐞𝐫𝐚𝐠𝐞 𝐰𝐢𝐭𝐡 𝟐𝟗𝟕,𝟔𝟕𝟔,𝟎𝟕𝟔.𝟕𝟔 𝐞𝐱𝐜𝐡𝐚𝐧𝐠𝐞𝐝
𝐓𝐫𝐚𝐝𝐢𝐧𝐠 𝐩𝐚𝐭𝐭𝐞𝐫𝐧𝐬 𝐨𝐯𝐞𝐫 𝐭𝐡𝐞 𝐥𝐚𝐬𝐭 𝐲𝐞𝐚𝐫 𝐟𝐨𝐫 𝐒𝐭𝐞𝐥𝐥𝐚𝐫 𝐥𝐞𝐚𝐝𝐬 𝐭𝐨 𝐭𝐡𝐞 𝐜𝐨𝐢𝐧'𝐬 𝐚𝐧 𝐚𝐯𝐞𝐫𝐚𝐠𝐞 𝐥𝐨𝐧𝐠-𝐭𝐞𝐫𝐦 𝐭𝐞𝐜𝐡𝐧𝐢𝐜𝐚𝐥 𝐬𝐜𝐨𝐫𝐞 𝐨𝐟 𝟔𝟓 𝐚𝐬 𝐢𝐭𝐬 𝐜𝐨𝐧𝐬𝐢𝐬𝐭𝐞𝐧𝐜𝐲, 𝐯𝐨𝐥𝐚𝐭𝐢𝐥𝐢𝐭𝐲, 𝐚𝐧𝐝 𝐫𝐞𝐥𝐚𝐭𝐢𝐨𝐧 𝐭𝐨 𝐥𝐨𝐧𝐠-𝐭𝐞𝐫𝐦 𝐚𝐯𝐞𝐫𝐚𝐠𝐞𝐬 𝐡𝐚𝐬 𝐠𝐢𝐯𝐞𝐧 𝐢𝐧𝐯𝐞𝐬𝐭𝐨𝐫𝐬 𝐫𝐞𝐚𝐬𝐨𝐧 𝐭𝐨 𝐛𝐞 𝐧𝐞𝐮𝐭𝐫𝐚𝐥 𝐨𝐧 𝐭𝐡𝐞 𝐜𝐨𝐢𝐧.
- 𝗜𝘁’𝘀 𝗶𝗺𝗽𝗼𝗿𝘁𝗮𝗻𝘁 to keep in mind that cryptocurrency markets are extremely volatile, making it difficult to accurately predict what a coin’s price will be in a few hours or a few days and even harder to give long-term estimates. As such, analysts and online forecasting sites can get their predictions wrong. We recommend that you always do your own research and consider the latest market trends, news, technical and fundamental analysis , and expert opinion before making any investment decisions. Be patient and look long term wisely and never invest more than you can afford to lose.
Trading & Investing both are the master of RISK.
Please comment, like and follow if it was helpful for you.
Thank you for your time.
Have a profitable day.
| Review and analysis by Samadi.Finance |

Stellar heading to be stellarFirst lets recap the 1st trade highlighted trade in green. We bought in our buy area and took profit in our profit taking area. That 1st trade pulled in 750%
2nd trade highlighted in red. Again, we bought in the buy area and sold in the TP area. That trade earned over 2500%
Now, here we are right now in our buy zone. Once we launch from here, we are heading to our Take Profit area which will earn us 20,000%. It could take months, maybe years, but a 20,000% payout is worth the wait IMO.
I'm buying and will continue to do so until we break out the buy zone.
...and you? Well, you do you. See you at the top!

Stellar (XLM) Foldback Pattern suggest a major price spike is inFoldback Patterns are a theory that price action repeats the same swing structure as the past. In the case of XLM, the Foldback Pattern with the combination of a 180-day Gann Cycle suggests that a big price spike for XLM is likely to occur very soon.

Stellar XLMThese are levels that I'll be keeping an eye on when dealing with XLM/USD, and I'll revise as price action progresses.
I adapt to the change in money flow.
It's currently in a ascending channel which typically mean we will more than likely see a break in structure to the downside. If that were to happen then it'll be some great buying opportunities presenting themselves at certain price points.

XLMUSD Accumulation almost over. Look for a 1D MA200 break.Stellar got rejected at the end of December on the 1D MA200 (orange trend-line) and that stopped the rebound from developing into a full rally sequence. That is the Resistance to beat if XLM wants to see a new bullish phase. Practically the pattern from late June until now seems like a giant Accumulation Phase and both in price action and 1D RSI terms is similar with that of April - November 2020.
It was a 1D Death Cross (MA50 crossing below the MA200) that started the Accumulation Phase and another that priced its bottom and ended it. The Golden Cross (MA50 crossing above the MA200) was formed on the peak of the first price rally, so it just confirmed it. Right now XLMUSD is coming off that second Death Cross, so we can argue that the bottom may already be priced in. The confirmation however will come in my opinion once the 1D MA200 breaks, so if you don't want to risk buying now, then buy upon a break-out.
--------------------------------------------------------------------------------------------------------
** Please support this idea with your likes and comments, it is the best way to keep it relevant and support me. **
--------------------------------------------------------------------------------------------------------

STELLAR - Final Short Or Breakout?? 🚨Stellar is approaching a very interesting level where we may see a breakout or we may reject for the final time to reach our ideal buy area of 0.20.
SHORT Trade idea:
- Watch for lower timeframe trendline break
- Enter with stops above recent high
- target the 0.20
Breakout Trade Idea:
- Watch for a break of the descending black trendline
- Wait for a pullback and then enter with stops below the most recent rejection
- Targets: 0.43, 0.80
Goodluck!

XLM - Potential Bullish Reversal!Hello everyone, if you like the idea, do not forget to support with a like and follow.
XLM is approaching a strong support in green so we will be looking for buy setups.
on H4: XLM is forming a channel in red but the upper trendline is not valid yet, so we are waiting for a new swing high to form around it to consider it our trigger swing. (projection in purple)
Trigger => Waiting for that swing to form and then buy after a momentum candle close above it (gray zone)
Meanwhile, until the buy is activated, XLM would be overall bearish can still trade lower inside the support before going up.
Good luck!
All Strategies Are Good; If Managed Properly!
~Rich

Stellar (XLM) - January 13Hello?
Welcome, traders.
If you "follow", you can always get new information quickly.
Please also click "Like".
Have a nice day.
-------------------------------------
(XLMUSD 1W Chart)
Support section: 0.18554008-0.23669590
If it declines from the 0.16420803 point, there is a possibility of entering the mid- to long-term investment area, so you need to trade cautiously.
It should move above the 0.33900755 point to continue the uptrend.
As such, it is necessary to check if the trend is moving upwards along an uptrend line.
Above the 0.40293161 point is the high-end section, so there is a possibility of finding resistance in the 0.44131920-0.49247902 section.
If the decline is from the 0.44131920-0.49247902 section, you should check to see if there is support near the 0.40293161 point.
If it falls from the 0.40293161 point, you need a short-term Stop Loss.
--------------------------------------
(XLMBTC 1W chart)
Box sideways section: 428 Satoshi-1288 Satoshi section
It should move above the 746 Satoshi point to see if it can turn into an uptrend.
------------------------------------------
We recommend that you trade with your average unit price.
This is because, if the price is below your average unit price, whether the price trend is in an upward trend or a downward trend, there is a high possibility that you will not be able to get a big profit due to the psychological burden.
The center of all trading starts with the average unit price at which you start trading.
If you ignore this, you may be trading in the wrong direction.
Therefore, it is important to find a way to lower the average unit price and adjust the proportion of the investment, ultimately allowing the funds corresponding to the profits to be able to regenerate themselves.
------------------------------------------------------------ -------------------------------------------
** All indicators are lagging indicators.
Therefore, it is important to be aware that the indicator moves accordingly with the movement of price and volume.
However, for convenience, we are talking in reverse for the interpretation of the indicator.
** The MRHAB-O and MRHAB-B indicators used in the chart are indicators of our channel that have not been released yet.
(Since it was not disclosed, you can use this chart without any restrictions by sharing this chart and copying and pasting the indicators.)
** The wRSI_SR indicator is an indicator created by adding settings and options to the existing Stochastic RSI indicator.
Therefore, the interpretation is the same as the traditional Stochastic RSI indicator. (K, D line -> R, S line)
** The OBV indicator was re-created by applying a formula to the DepthHouse Trading indicator, an indicator disclosed by oh92. (Thanks for this.)
** Support or resistance is based on the closing price of the 1D chart.
** All descriptions are for reference only and do not guarantee a profit or loss in investment.
(Short-term Stop Loss can be said to be a point where profit and loss can be preserved or additional entry can be made through split trading. It is a short-term investment perspective.)
---------------------------------

XLM try to break out long term resistance#XLM/USDT
$XLM is trading exactly below weekly and daily descending resistance lines.
if price break out from this descending resistance, it will increase to resistance zone between $0.36 and $0.39.
but if price reject from current descending lines, it will drop to support zone around $0.2 and then maybe try to break out from resistance.

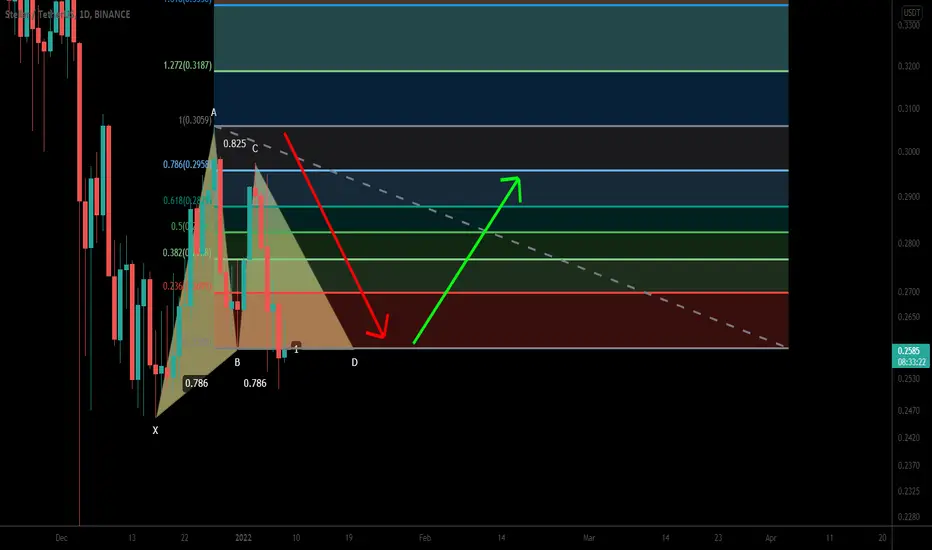
Stellar (XLM) formed bullish Gartley for upto 20% moveHey friends, hope you are well, and welcome to the new trade setup of Stellar ( XLM )
Previously I shared a harmonic trade of XLM which is still in play:
Now on a daily time frame, XLM has formed a bullish Gartley.
XLM - Potential Bullish Reversal!Hello everyone, if you like the idea, do not forget to support with a like and follow.
XLM is approaching a strong support in green so we will be looking for buy setups.
on H4: XLM is forming a trendline in red but it is not valid yet, so we are waiting for a new swing high to form around it to consider it our trigger swing. (projection in purple)
Another scenario would be if the bulls take over from here by breaking above the current high. (projection in blue)
Trigger => Waiting for that swing to form and then buy after a momentum candle close above it (gray zone)
Meanwhile, until the buy is activated, XLM would be overall bearish can still trade lower till the lower.
Good luck!
All Strategies Are Good; If Managed Properly!
~Rich


XLM CUP(date) ON THE HANDLE - THE NEW(est) ANGLEXLM CUP(date) ON THE HANDLE - THE NEW(est) ANGLE
An update to my CUP & HANDLE ideas for XLM
These are just my angles on the pattern...
By no means the final survey...

XLM Stellar Lumens Expected Move - XLMBTC XLMUSD XLMUSDTXLM Stellar Lumens Expected Move - XLMBTC XLMUSD XLMUSDT

STELLAR - Bearish Pennant Shorts!Our last analysis was a higher timeframe analysis of Stellar and we found that we were in an ABC correction with 2 possible areas of interest, with one being unlikely. See below:
Currently we appear to be in a bearish pennant for one last move down.
Trade Idea:
- Watch for strong bearish candles on lower timeframe or a correction
- Enter on break of correction with stops above the pennant
- Target the 0.20 where we will be looking for a reversal
Goodluck!

XLMUSDT 1HrXLM seems to have completed an impulse wave A or 1 here. The larger direction looking upwards. A 'C' or wave '3' likely in progress.

Stellar: BearishXLM is testing the strong resistance area and bonsing off the descending trendline. Decline to support level at 0.247 is possible.
