XLM/USD - Is Stellar waking up? Stellar day may lead to rally!Stellar Lumens pumped today with a lovely green candle on the daily which has now pushed us right below a major resistance line at $0.42 cents.
The indicators seem primed to take us much higher and break above this key resistance. Can XLM do it?
My bet is on the bulls, as the overall market is heating up. BTC and ETH are just about to break their own ATH... so XLM and the overall altcoin market will start to heat up.
Just a matter of time. If you look for an entry, get in when XLM makes the $0.42 resistance support and ride the pump to $1... which is our current ATH for XLM.
Like and follow if you liked this idea!
STELLAR

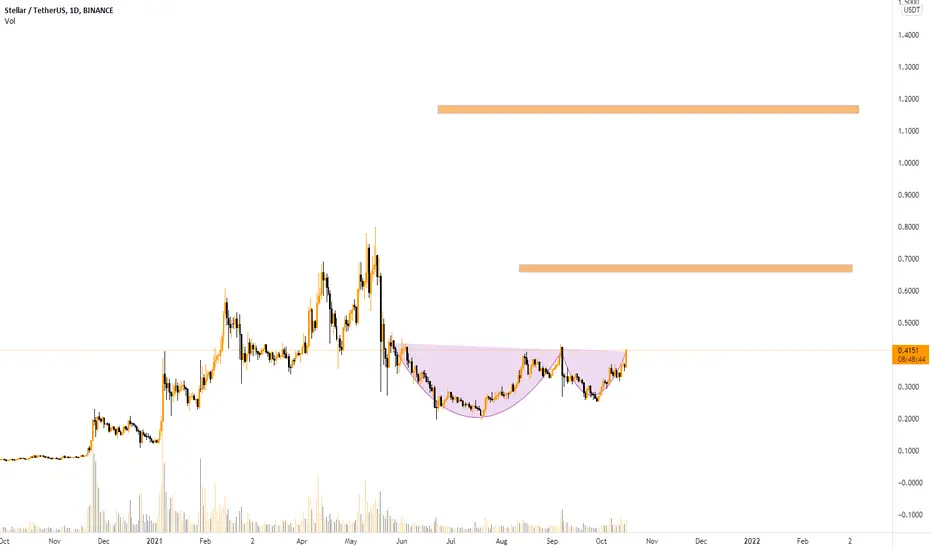
XLM Cup and Handle Pattern is Breaking Out Now!XLM pattern created is Cup And Handle Pattern wich is almost at Breaking out point , my targets are simple new ATH and beyond.! goodluck
Stellar XLM is going up and much further than many thinkIf you aren’t aware stellar is by far the most undervalued high speed (seconds to confirm, pop network. I’ve been accumulating for a long time and it’s not a surprise to see this move up after the Btc pair visit the bottom of range again. Stellar is going well above a dollar soon and I’m just warning you it will happen very fast like ripple. I’d suggest taking a look at lumenswap as well because maybe then normal people can can actually swap coins on a DEX for less than 100 usd. Eth is trash look at how long it’s been since any meaningful upgrade. It’s literally an unusable network to most. Defi is not about the rich getting richer and large entry prices. Stellar can become the center of defi AND the currency coin AND an international transfer of value network.


Ascending Triangle Setup on XLM with 0.4 TargetTrend Analysis
The main view of this trade idea is on the 2-Hour Chart. The cryptocurrency Stellar (XLM) is in an ascending triangle setup, with the resistance line around the 0.326 level and the support trend line making higher lows from 0.26 and 0.3. Expectations are for a breakout, with XLM rallying towards 0.4. This setup will fail if XLM were to decline to below 0.3, towards 0.28.
Technical Indicators
XLM had positive crossovers on its short (50-MA), medium (100-MA) and long (200-MA) fractal moving averages. The cryptocurrency is currently trading above these MAs. The RSI is above 50 and the KSTY recently had a positive crossover. These technical indicators support the bullish view on XLM.
Recommendation
The recommendation will be to go long at market, with a stop loss at 0.28 and a target of 0.4. This produces a risk/reward ratio of 1.59.
Disclaimer
The views expressed are mine and do not represent the views of my employers and business partners. Persons acting on these recommendations are doing so at their own risk. These recommendations are not a solicitation to buy or to sell but are for purely discussion purposes. Currently I have a position in XLM.


ARIASWAVE CRYPTO MARKET UPDATE - BITCOIN - XLMUSDThis weeks market updates will focus on individual markets due to some key elements that need discussing.
The reason for this is due to some opposing views from last week when I made two separate videos.
Since then I have done some research in order to bring some clarity over those views and how they differ between markets.
Using the Bitcoin chart is the best way to understand what lies ahead for Cryptos.
This type of understanding will form the foundation for future updates.
Remember to use Disciplined Money Management Principles to ensure longevity as a trader.
If you don't know the long term pattern shouldn't you be doing your research instead of just following the crowd?
Just remember: I am not a financial advisor, I suggest using this only as a guide. Always do your own research.

This is what I see XLM do for the next few weeksThe good old classic XLM bull trap, to bear trap to pump. It has been doing this every single time we are in triangles...

XLM Bullish ChannelXLM appears to be in a bullish channel. I wouldn't be surprised if it reached between $0.42 and $0.53 by the end of the year. Its utility for transfer keeps it actively trading. I've been happy to make money using it to transfer other cryptos between exchanges, including fees, because of its upward momentum. Recently announced partnerships are also creating upwards pressure.

XLM broke out long term resistance#XLMUSDT
$XLM broke out long term descending resistance line, also you can see price broke out from descending parallel channel in 4h time frame, which can be a flag for more uptrend. resistances are around $0.4 and $0.5 that will be touch soon. and long term target can be around $0.9.

XLM looks good on daily for now!Stellar $XLM (Idea)
Timeframe: Daily
Adam and eve pattern ? Or Cup and handle?
Anyways let's see if this works or not.

XLM waiting for big growthXLM is one of those cryptocurrencies which are quiet but which are appreciated by influential lobbies in several countries, they cooperate with the biggest ones and develop very well, I think for a LONG time, it is one of the best investments

XLMUSDT Daily TimeframeSNIPER STRATEGY (new version)
It works ALMOST ON ANY CHART.
It produces Weak, Medium and Strong signals based on consisting elements.
NOT ALL TARGETS CAN BE ACHIEVED, let's make that clear.
TARGETS OR ENTRY PRICES ARE STRONG SUPPORT AND RESISTANCE LEVELS SO THEY CAN ACT LIKE PIVOT POINTS AND REVERSE THE WAVE (or act like a mirror that can reflects light) BASED ON STRENGTH OF THAT LEVEL.
ENTRY PRICE BLACK COLOR
MOST PROBABLE SCENARIOS TARGETS GREEN COLOR
LEAST PROBABLE SCENARIOS TARGETS RED COLOR
DO NOT USE THIS STROTEGY FOR LEVERAGED TRADING.
It will not give you the whole wave like any other strategy out there but it will give you a huge part of the wave.
The BEST TIMEFRAMES for this strategy are Daily, Weekly and Monthly however it can work on any timeframe.
Consider those points and you will have a huge advantage in the market.
There is a lot more about this strategy.
It can predict possible target and also give you almost exact buy or sell time on the spot.
I am developing it even more so stay tuned and start to follow me for more signals and forecasts.
START BELIEVING AND GOOD LUCK
HADIMOZAYAN

✅ XLM (Stellar) - What's next?XLM started corrections just like any other coin in the Correction-Season and then after a while of consolidating and going for resistance areas and getting rejected by them, this is where we are now. We just got a bounce from our support and trying to build the price up to get to the next resistance once more.
Right now most coins are forming a bullish triangle and most people are talking about it. Just put your charts on 1D and take a look, you'll see it!
As I've said in my last ADA and XRP chart, Watch for Bitcoin , since it looks like it's going to touch ATH or even cross it. After Bitcoin calms down XLM can perform stronger than now and might run for testing the ATH . If possible, it might cross it and touch the red resistance as I've shown on the chart.
if not successful, then it's going back down but I'll update the support when that's about to happen.
XLM isn't showing STRONG buy volumes in the market but it still has some time to build up a foundation on this support zone .
There are 3 resistance areas on the way up and each is stronger than the other. Watch out for them.
I'll keep this chart updated.
Use this chart as your trade setup for now.
Current Market Price: $0.3425
Good Luck
Tell me your ideas. Like and Share

STELLAR (XLM/USD) | Opportunity To Be Part of The RetestHi,
Stellar (XLM) has shown its strength by managing to push above quite an important price zone. Atm the retest has worked nicely (short-term rejections), the market sentiment is bullish so do your own analysis and if it's matching with mine you are ready to go!
Regrads,
Vaido

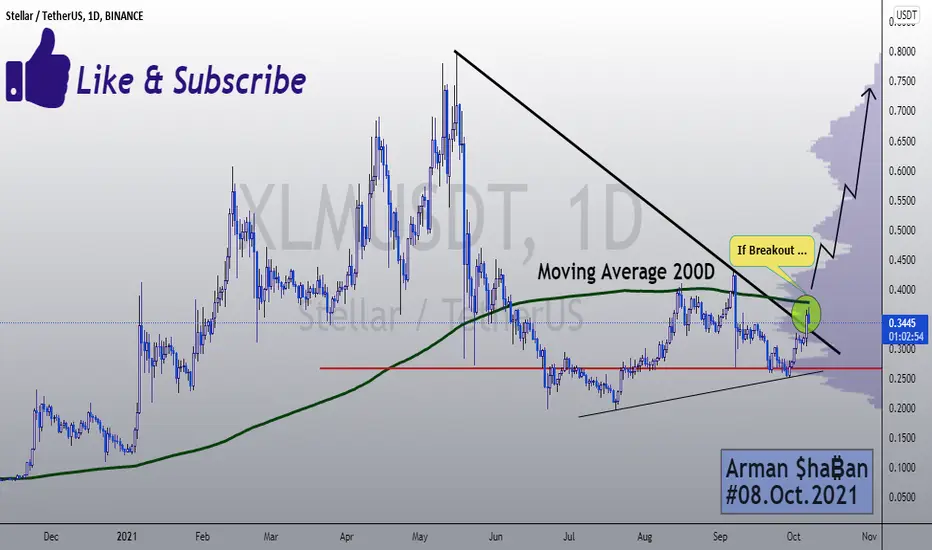
₿ XLMUSDT 1D ₿ : 08.Oct.2021 (Update)Everything is clear on the chart and the possible scenario is marked on the chart ... If you have any other questions, leave us a comment.
⚠️ This Analysis will be updated ... BINANCE:XLMUSDT
👤 Arman Shaban : @Ar_M_An_4
📅 08.Oct.2021
⚠️(DYOR)
History repeats itselfWe're looking at an identical pattern formed on the Stoch RSI, which I believe will explode shortly. Especially given the most recent news about Stellar, Circle, and the FED. I'm LONG on xlm.

XLM, REFRESH AGAIN...!Here we have the XLM and strong resistance. Due to this strategy, we should expect a retest to refresh and go up again. So, this is how I think about XLM.
*Note: Not financial advice.

XLM/USD - signs of lifeDuring past days Stellar shows nice dynamic vs BTC.
For me final signal will be crossing mirror line demand / supply zone, which now coincides with 200MA, that is also important key.
Very long phase of accumulation. Potential is enourmous.
Global idea :

XRP primed to breakout in December based on fractalUsing the fractal from November 2020 to April 2021, we can see the similarities and potentially see when XRP could breakout. When it gets going, I believe XRP can easily hit $10 based on its full fib extension of its past bull run.

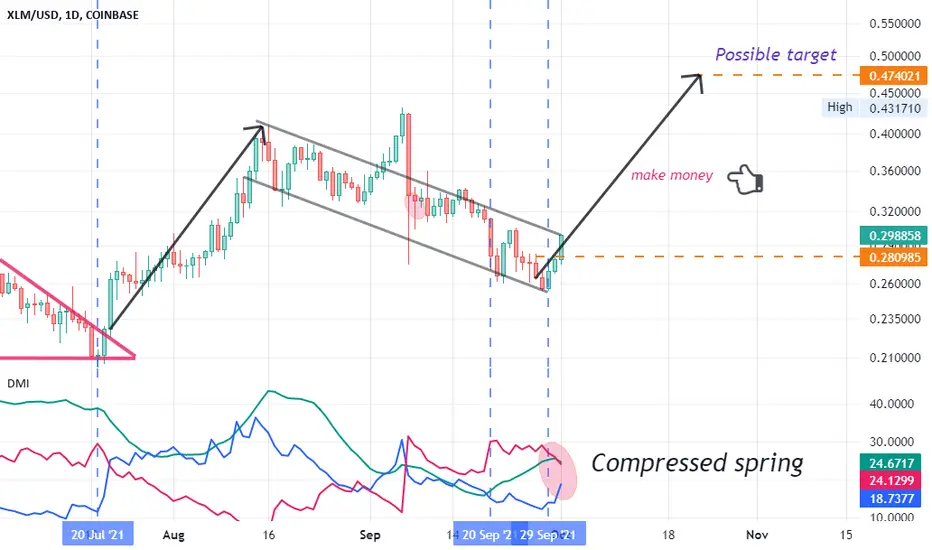
Compressed spring!
Hello friends,
It's the result of my efforts to offer a useful (I hope) presentation.
Bullish Flag Pattern.
Pump coming.
What else is new?
1- Entry Time (Now).
2- knowing how to make money out of the different patterns.
3-
4H $Stellar $XLMSymbol: #XLMUSDT
Entry: Short
EntryPrice: 0.29519
StopLoss: 0.301380
Target 1: 0.293643
Target 2: 0.292095
Target 3: 0.289000
Target 4: 0.282810
Target 5: 0.276620
Max leverage: 5x

Daily $Stellar $XLM1/ Protocol 18 powers up Stellar's path payment feature by making paths easier to find, through support of larger quantities, and by achieving reliable exchange rates - in short, making them more liquid. Read our latest Developer Blog by George Kudrayvtsev.
2/ Join us on Thursday, 10/7 @ 10:00am ET for an ecosystem roundtable on Protocol 18 and liquidity pools! This session will be hosted by SDF and feature a panel of ecosystem participants including
@ultrastellarhq
,
@stellarportio
, & Settle Network
Institutions/Banks/Big Investors either always buy the same percentage of #XRP and #XLM and the two are THE World Bank-Coins
