(XLM) stellarStellar, an inactive pond with ducks wading graciously through the water while those sitting by steadily view the inactive activity of peaceful animal life living among the life of humans, no voices, only the sound of trees rustling and wind blowing through the air.
STELLAR

XLM may bounce here #XLM #stellar is now sitting on a major support zone (red box) and may likely have a bounce here for short term movement.

XLM will have a decision#stellar #xlm price is now testing a major resistance zone, now. This zone is also the bearish retest zone of where CRYPTOCAP:XLM broke the support. So, this retest will be very important.

XLMUSD Is this its Cycle Top??Stellar (XLMUSD) is picking up the bullish sentiment today having just completed a Golden Cross on the 1W time-frame. Last time we viewed this (November 01 2024, see chart below), we gave a strong buy signal, which paid off immediately:
Having failed to cross above the Lower Highs trend-line though, we are now more concerned as the last 1W Golden Cross (March 01 2021) was formed just 40 days before the Top of the previous Bull Cycle.
As long as the price trades below the Lower Highs trend-line, the probability for a new bearish move is strengthened. What is also supporting this is that the 1W RSI resembles the pattern of both the May 2021 and January 2018 Cycle Tops.
At the same time though, it is quite similar to the May - September 2017 RSI pattern, whose XLM price action was nothing but a Bull Flag that after touching the 1W MA50 (blue trend-line), rebounded aggressively above the 1.618 Fibonacci extension slightly to form the Jan 2018 Cycle Top.
As a result, we recommend to resume buying only if the price breaks above the Lower Highs trend-line and target 2.2500 (the 1.618 Fib extension).
-------------------------------------------------------------------------------
** Please LIKE 👍, FOLLOW ✅, SHARE 🙌 and COMMENT ✍ if you enjoy this idea! Also share your ideas and charts in the comments section below! This is best way to keep it relevant, support us, keep the content here free and allow the idea to reach as many people as possible. **
-------------------------------------------------------------------------------
💸💸💸💸💸💸
👇 👇 👇 👇 👇 👇

XLMUSD - Weekly forecast, Technical Analysis & Trading IdeasMidterm forecast:
0.1625 is a major support, while this level is not broken, the Midterm wave will be uptrend.
Technical analysis:
A trough is formed in daily chart at 0.3030 on 02/09/2025, so more gains to resistance(s) 0.3552, 0.3875, 0.4521 and more heights is expected.
Take Profits:
0.3552
0.3875
0.4521
0.4965
0.5602
0.6080
0.6905
0.7975
__________________________________________
❤️ If you find this helpful and want more FREE forecasts in TradingView,
. . . . . Please show your support back,
. . . . . . . . Hit the 👍 BOOST button,
. . . . . . . . . . . Drop some feedback below in the comment!
🙏 Your Support is appreciated!
Let us know how you see this opportunity and forecast.
Have a successful week,
ForecastCity Support Team

XLM does not look bad#xlm CRYPTOCAP:XLM chart is moving in the support zone and may have bounce due to market conditions. #stellar is important for being #xrp 's cousin. Not financial advice.

XLM - Taking Over EUROPEAN BANKS MartyBoots here , I have been trading for 17 years and sharing my thoughts on xlm here.
xlm is looking beautiful , very strong chart for more upside
Very similar to XRP which mooned and will go higher
Do not miss out on xlm as this is a great opportunity
Watch video for more details

Is Stellar (XLM) Ready for Its Next Breakout? Hello, Traders!
After an incredible rise of over 600% just in one month, Stellar (XLM) has retraced 50% but is still trading an impressive 400% higher than its November price.
This kind of volatility is a natural part of the crypto market and can often present lucrative opportunities for those who know how to navigate it.
At this point, for XLM to regain its bullish momentum, the price must break above the $0.50 level and hold there consistently.
A breakout above this psychological and technical resistance could signal the start of another leg up in its recent uptrend.
This scenario becomes even more likely considering Bitcoin current price action.
With BTC trading above $100k and BTC.D hovering at a resistance area of 59%, we could see a rotation of capital into altcoins like XLM if BTC.D starts dropping.
Historically, altcoins tend to surge when Bitcoin dominance declines, and Stellar is well-positioned to capitalize on such a shift.
As for the downside, I don’t anticipate XLM falling below the $0.39 support level.
In fact, there’s strong evidence that the recent dip to the $0.32 area marked a local bottom, supported by key technical indicators and buyer activity in that zone.
If you're trading XLM, keep a close eye on these levels and be ready to act if the $0.50 resistance is broken.
Remember, patience and disciplined risk management are key in markets like these.
Please don’t forget to boost this idea and leave your comments below.

Is #XLM Ready For another Bullish Push or Not? Key Levels Yello, Paradisers! Is #XLMUSDT about to surge to new heights or are we on the verge of a deeper correction? Let’s analyze this critical setup of #Stellar:
💎#XLM has been forming a classic falling wedge pattern on the 8-hour chart, a formation known for its bullish breakout potential. Price is currently testing the descending resistance, and this is where things could get exciting. A clean breakout above this resistance would signal a major shift in momentum and open the door for a significant move higher.
💎When #XLMUSD clears the descending resistance of the falling wedge, the immediate resistance lies at the $0.45 level. This critical level needs to be cleared for CRYPTOCAP:XLM to confirm its bullish breakout. If bulls succeed, the next target lies in the major resistance zone near 0.6500, representing a potential 40%+ upside. Look for strong volume and convincing bullish candles above the resistance to confirm market conviction. Without these signals, any upward movement could turn out to be a fakeout.
💎However, if #XLM fails to clear the descending resistance then it might come to retest the support zone at $0.32. Buyers have held this level and the probability of jumping here is quite high. But if this level also doesn't hold, there will be a retest of the demand zone at $0.24.
💎However, a daily close below $0.24 would invalidate the bullish setup and potentially lead to a sharper drop toward 0.2000 or lower.
Stay focused, patient, and disciplined, Paradisers🥂
MyCryptoParadise
iFeel the success🌴

Stellar (XLM) Price Breakout Fuels 30% Surge Hopes
Stellar Lumens (XLM), the cryptocurrency designed to facilitate fast and low-cost cross-border payments, has recently shown signs of a potential breakout, sparking speculation about a significant price surge. After a period of relative stagnation, XLM has demonstrated renewed momentum, capturing the attention of traders and investors alike. This article delves into the factors contributing to this potential breakout, examines technical indicators, and explores whether a 30% surge is a realistic possibility.
Stellar’s core mission is to provide an efficient and inclusive financial ecosystem, particularly for underserved populations. It aims to streamline international transactions, making them faster, cheaper, and more accessible than traditional banking systems.1 This focus on real-world utility has always been a strong foundation for XLM, and recent developments suggest this utility is beginning to translate into market action.
Factors Driving the Potential Breakout:
Several factors contribute to the current bullish sentiment surrounding XLM:
• Increased Network Activity: A key indicator of a healthy blockchain network is its level of activity. Recent data suggests a significant uptick in transactions on the Stellar network. This increased usage indicates growing adoption and demonstrates the platform’s real-world utility. This increased activity could be attributed to new partnerships, integrations with existing financial institutions, or the organic growth of its user base.
• Growing Institutional Interest: While not as prominent as Bitcoin or Ethereum, Stellar has been quietly attracting institutional interest. Its focus on regulated financial services and its compliance-friendly approach make it an attractive option for institutions seeking to explore the potential of blockchain technology. Increased institutional involvement often translates to larger trading volumes and can significantly impact price action.
• Favorable Regulatory Landscape: The regulatory landscape for cryptocurrencies is constantly evolving. Positive regulatory developments, particularly those related to cross-border payments and digital assets, can create a favorable environment for projects like Stellar. Clearer regulations can foster greater confidence among investors and encourage wider adoption.
• Technical Indicators: From a technical analysis perspective, XLM has shown promising signs. Recent price action has seen XLM break through key resistance levels, suggesting a shift in momentum.2 Trading volume has also increased, further supporting the bullish narrative. Several technical indicators, such as moving averages and relative strength index (RSI), point towards a potential upward trend.
• Focus on Decentralized Finance (DeFi): While Stellar isn't primarily known for DeFi, the network has seen increasing development in this sector. The growth of DeFi applications on Stellar could attract new users and capital to the ecosystem, further driving demand for XLM.
Technical Analysis and Price Prediction:
Analyzing XLM's price charts reveals a potential breakout pattern. The price has been consolidating within a defined range for a period, and the recent break above this range suggests a potential shift towards an upward trend. This breakout is further supported by increased trading volume, indicating strong buying pressure.
Several technical indicators suggest a bullish outlook:
• Moving Averages: The price of XLM has crossed above key moving averages, such as the 50-day and 200-day moving averages, which are often interpreted as bullish signals.
• Relative Strength Index (RSI): The RSI, a momentum indicator, is showing increasing strength, indicating growing buying momentum.
• Volume: The increased trading volume accompanying the price breakout provides further confirmation of the bullish trend.
Based on these technical indicators and the current market momentum, a 30% surge is a plausible scenario. However, it’s crucial to remember that the cryptocurrency market is highly volatile, and price predictions are not guaranteed.3 Several factors could influence XLM’s price action, including overall market sentiment, regulatory developments, and competition from other cryptocurrencies.
Is a 30% Surge Realistic?
While the technical indicators and fundamental factors suggest a potential for significant price appreciation, a 30% surge should be considered a potential target rather than a certainty. The cryptocurrency market is known for its volatility, and unforeseen events can quickly change market sentiment.4
Conclusion:
Stellar’s XLM is showing promising signs of a potential breakout. Increased network activity, growing institutional interest, favorable regulatory developments, and positive technical indicators all contribute to the bullish sentiment. While a 30% surge is a realistic possibility based on current trends, investors should exercise caution and conduct thorough research before making any investment decisions. The cryptocurrency market is highly volatile,5 and it’s essential to manage risk effectively.6 However, the current momentum surrounding XLM suggests that the project is well-positioned for future growth and could offer significant potential for investors. The focus on real-world utility and the development of the Stellar ecosystem continue to be key factors to watch in the coming months.

Stellar can give a Stellar Performance?Stellar is ideally going to the buys on the point of attraction where green line is shown, unless small ups, its better to big long to the position marked or short when comes to yellow box, breaks above the red line of the yellow box will defy whats made.

XLM expected movementBINANCE:XLMUSDT
Stellar was in a falling wedge pattern. now the price has already broken the pattern so all we need to do is sit and wait for it to reach the top of the pattern.
⚠️ Disclaimer:
This is not financial advice. Always manage your risks and trade responsibly.
👉 Follow me for daily updates,
💬 Comment and like to share your thoughts,
📌 And check the link in my bio for even more resources!
Let’s navigate the markets together—join the journey today! 💹✨

Trading opportunity for XLMUSDTBased on technical factors there is a Buy position in :
📊 XLMUSDT
🔵 Buy Now
🪫Stop loss 0.4320
🔋Target 0.4900
📏 R/R 2,8
💸RISK : 1%
We hope it is profitable for you ❤️
Please support our activity with your likes👍 and comments📝

Support zone: 0.4024
Hello, traders.
If you "Follow", you can always get new information quickly.
Please click "Boost" as well.
Have a nice day today.
-------------------------------------
(XLMUSDT 1D chart)
As it rose this time, the candle's body color changed to green (#42bda8, #00332a).
In order to continue the short-term uptrend, the price must be maintained around 0.4024 or higher.
If it fails to do so and falls below 0.3747, it may fall to around 0.3070.
-
Since the high point boundary zone is formed in the 0.4931-0.5362 zone, the point of observation is whether it can break through this zone upward.
Therefore, when the support is confirmed around 0.4024, it is the time to buy.
-
Thank you for reading to the end.
I hope you have a successful trade.
--------------------------------------------------
- Big picture
I used TradingView's INDEX chart to check the entire range of BTC.
(BTCUSD 12M chart)
Looking at the big picture, it seems to have been maintaining an upward trend following a pattern since 2015.
In other words, it is a pattern that maintains a 3-year upward trend and faces a 1-year downward trend.
Accordingly, the upward trend is expected to continue until 2025.
-
(LOG chart)
Looking at the LOG chart, you can see that the upward trend is decreasing.
Accordingly, the 46K-48K range is expected to be a very important support and resistance range from a long-term perspective.
Therefore, it is expected that prices below 44K-48K will not be seen in the future.
-
The Fibonacci ratio on the left is the Fibonacci ratio of the uptrend that started in 2015.
In other words, it is the Fibonacci ratio of the first wave of the uptrend.
The Fibonacci ratio on the right is the Fibonacci ratio of the uptrend that started in 2019.
Therefore, it is expected that this Fibonacci ratio will be used until 2026.
-
No matter what anyone says, the chart has already been created and is already moving.
It is up to you how to view and respond to this.
If the ATH is renewed, there are no support and resistance points, so the Fibonacci ratio can be appropriately utilized.
However, although the Fibonacci ratio is useful for chart analysis, it is ambiguous to use it as support and resistance.
The reason is that the user must directly select the important selection points required to generate Fibonacci.
Therefore, since it is expressed differently depending on how the user specifies the selection points, it can be useful for chart analysis, but it can be seen as ambiguous to use it for trading strategies.
1st: 44234.54
2nd: 61383.23
3rd: 89126.41
101875.70-106275.10 (when overshooting)
4th: 134018.28
151166.97-157451.83 (when overshooting)
5th: 178910.15
-----------------

XLMUSD - It's Beginning To Look A Lot Like 2018...This move doesn’t give me any reason to believe we’re heading higher. In fact, it feels strikingly similar to what unfolded after the all-time high in 2018.
Stay tuned for more updates—I’m confident there will be an opportunity to buy XLM at rock-bottom prices in the near future.
Ignore the noise from those calling me a “fudster”; they’re just caught up in their FOMO.

XLM Falling Wedge Could Rise 135% to .95 On Bullish Break!Here I have COINBASE:XLMUSD on the Daily Chart.
Low - .089449
High - .63445
Since the High, Price has been forming a Falling Wedge where we see Price Retraced to the Golden Ratio Zone @ .31339 where it tested the Falling Support then to find more Support at the 50% Fibonacci Level to now be currently Testing the Falling Resistance!
If Price can generate a Bullish Break and continue finding Support, then I believe the prior 608% Price Increase we saw over November, could suggest a Potential 135% Price Increase to the .95 - $1 Area on a Bullish Break!!
Indicators:
-RSI Above 50
-BBTrend Printing Green Bars
-Bullish Volume Building

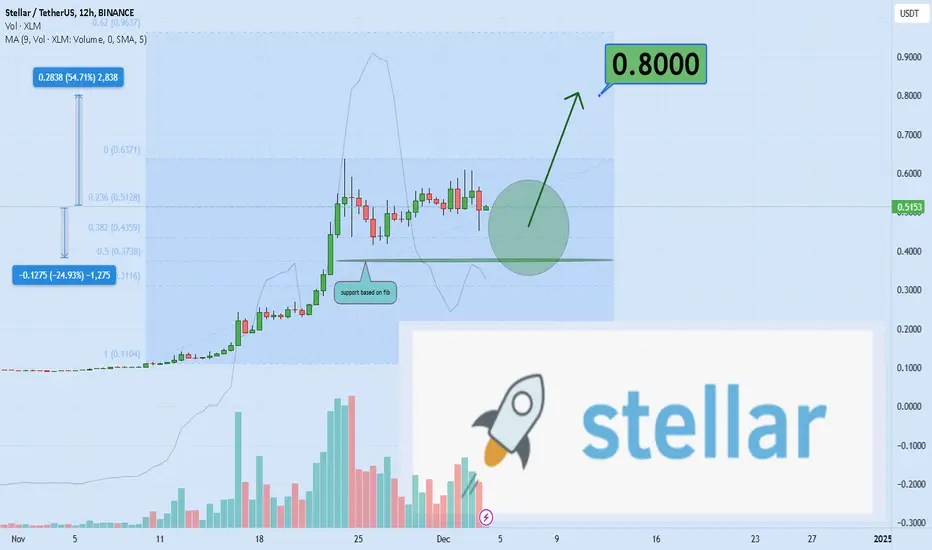
Stellar ( 0.80$ ) is uploading.Hello and greetings to all the crypto enthusiasts, ✌
I aim to provide you with a comprehensive overview of the future price potential for Stellar , 💡
The elevated trading volume, coupled with the technical chart analysis, strongly suggests a minimum upside potential of 50% for XLMUSDT. A significant portion of capital from the previous bull market is still embedded within it, signaling a solid foundation for growth. Should the stock experience an upward movement, it is likely to attract renewed interest from former investors, which could catalyze further investment inflows. 📚🎇
This trend would not only drive price appreciation but also reinforce investor confidence. As a result, XLMUSDT presents a compelling opportunity for both current and prospective investors.
🧨 Our team's main opinion is: 🧨
The high trading volume and technical chart suggest a 50% upside potential , with significant capital from the previous Saudi market still invested. A price rise would likely attract former investors, boosting momentum and investor confidence.
Thank you for your attention. If you have any questions or comments, I’m here to respond to you. 🐋💡
XLM Ready for Lift-Off? Wait for Breakout of $0.458!Stellar XLM is still trading in the range zone between $0.40 and $0.46 with the sideways price action.
1. If XLM can break through $0.458 with confidence, bulls might take over and aim for the next resistance at $0.525 and, possibly, higher. That’s where momentum could build up nicely, potentially giving traders something to cheer about (Solid Green Projection).
2. The price is pushing higher. However, if the price stumbles here, we’ll need to watch closely. A minor pullback to $0.431 and a bounce higher would signal buyers still have skin in the game (Dashed Green Projection).
3. On the other hand, if sellers step up and push XLM below $0.399, things could take a bearish turn. A drop toward $0.325 would be the next logical stop, and traders may want to brace for a deeper pullback if that level fails (Red Projection).
In short: $0.458 is the decision zone. A breakout or breakdown will set the tone. Bulls have a target at $0.525 and then $0.593, while bears have their eyes on $0.40—let’s see who blinks first!

XLM MID-TERM AND LONG TERM ANALISYSThere is significant demand for analyzing Stellar.
Upon examining the chart, it seems that Stellar is currently within a triangle.
Wave D will likely end around previous highs.
Afterward, we could see a correction for wave E, followed by Stellar's post-pattern movement targeting a level above $14.
Some might question whether Stellar can sustain such a market cap. We should emphasize that we rely on chart analysis and do not focus on fundamental issues, as fundamentals are reflected in the chart itself.
When we reach wave E of the triangle, if we observe a clear and identifiable pattern, we can position ourselves on Stellar for the main move.
For risk management, please don't forget stop loss and capital management
Comment if you have any questions
Thank You

More proof Goldencross works immediately in this phase of bullJust like the char I posted before this one, I’m posting this simply to lllustrate how the golden cross (orange line crossing above the blue line) immediately resulted in a very pivotal bullish pump that coincided with a major fulcrum point on the chart recently on multiple different charts. More times than not in the other market cycles, when a golden cross occurs it usually takes a few weeks afterwards to know whether that cross will have its desired outcome or instead end up being a fakeout but lately I’ve noticed multiple charts have seen an instantaneous pump on the exact day of the golden cross, which is making me think that once we enter the 2nd parabolic phase of a bull market that that is when you can anticipate a golden cross to have its immediate intended effect its suppose to have with much much higher probability than all the other market phases including even the 1st half of the bull market. Anyways I wanted to illustrate that hypothesis here with the XLM chart as you can clearly see it’s a text book example, and I will try to put a link below to the previous example where this occurred as wel a link to the total2 chart which will have its golden cross in the next 102 daily candles.l One major reason I want to illustrate this is because within the next 1-2 daily candle closes the Total2 (aka altcoin market) chart is going to have its golden cross and it is currently trying to confirm the breakout upward from a cp and handle pattern which is a huge fulcrum point for it. So should the trend of instantaneous golden cross pump effects occurring the same daily candle as the cross itself, this could clue us into exactly when the real full on alt season will be about to kick off (which if correct, will be ignited by a big confirmation breakout pump within the next 1-3 daily candles). *not financial advice*

XLM go up to 6.50?"Stellar" the cryptocurrency that has captured everyone's attention with its over 480% increase in recent weeks! Given its market cap rank of 16, this coin holds significant importance. However, it’s important to consider that the current market cap volume may make continued upward movement more challenging compared to other coins. Therefore, if you're considering a purchase, it’s advisable to allocate only a small percentage to this coin, as it is currently near its all-time high and poised for another push.
This is just a personal perspective on this coin and its future until 2026. Based on tools and calculations related to market cap, the maximum growth potential indicated for this coin is up to $2.3840. However, if many investors commit to this coin, it could reach $6.50. Yet, logically, its maximum growth is anticipated at $2.3840.
First target: $0.71
Second target: $2.3840
Third target: $6.50
In the short term, it could be a good option, as it shows strong momentum with corrections in its trend.
Don't forget to follow, dear friends!
I hope this analysis is useful for you."
Feel free to let me know if you need any further assistance!

STELLAR - Consolidation For A Big Bull WaveStellar has gained massively over the past few weeks and now in consolidation mode before a Big Bull Run. Support needs to hold in order for this to remain Bullish. A sustained break of support will open Bearish move.
For entries, please wait for at least two candle reversals at the specified level and apply appropriate risk management.
If you found this analysis helpful, please consider boosting and following for more updates.
Disclaimer: This content is for educational purposes only and should not be considered financial advice.

XLM | Stellar the Brightest STAR in the Blockchain SKYCrypto alts pump one by one and star of tonight show is Stellar
But What is Stellar ?
Stellar is an open source, decentralized protocol designed to facilitate the transfer of digital currencies into fiat currencies globally. Its native cryptocurrency, known as Lumen, powers the Stellar blockchain.
The primary goal of Stellar is to bridge financial institutions with blockchain technology, enabling affordable and efficient transactions, particularly in developing markets. Established in 2014 by Ripple cofounder Jed McCaleb, Stellar shares some similarities with Ripple. However, Stellar has distinguished itself as one of the most successful altcoins, with a market cap exceeding $1 billion.
While Ripple primarily caters to banks and large corporations, Stellar focuses on individuals and small businesses. Nonetheless, Stellar’s robust partner network, which includes financial institutions, supports worldwide instant currency conversion.
Initially, the Stellar Foundation issued over 100 billion lumens. However, about half of these were burned in November 2019, reducing the maximum supply to 50 billion lumens. This coin burn briefly boosted XLM's price, though the increase was short-lived.
Key Features of Stellar and How It Works
Stellar employs a federated Byzantine agreement aka FBA algorithm instead of traditional mining for transaction validation. This unique approach eliminates the need for approval from cryptocurrency miners, enabling faster transactions compared to many other blockchain systems.(only nerds read this part!)
What is Stellar Used For?
Stellar is primarily designed to streamline cross-border payments. Its mission is to make international transfers quick, affordable, and user-friendly. The system works by converting the sender's currency into Lumens, which is then converted into the recipient’s currency.
For instance, if someone sends GBP from the UK to Russia, the Stellar network first converts the GBP into Lumens and then into rubles. Users typically access the network through partners like Stripe or Wirex, which provide services integrated with bank cards. Transfers are processed in approximately five seconds.
Where to Buy XLM
XLM is available on both centralized and decentralized exchanges (CEXs & DEXs)
Stellar Price Info
- Current Price**: $0.43 (up by +54% in the last 24 hours) YES, BIG ALTS CAN PUMP HARD TOO
- All Time High (ATH): $0.94, achieved on January 4, 2018, currently down -54% from its ATH.
- Circulating Supply: 30.01 billion lumens.
- Maximum Supply: 50 billion lumens.
- 24Hour Trading Volume: $3.14 billion.
- Most Active Market: Upbit.
- Market Share: 0.37% of the total cryptocurrency market.
- Market Capitalization: $13.06 billion.
XRP and XLM: The Batman and Robin of Global Finance
The World Bank and other major financial authorities are increasingly acknowledging XLM & XRP's potential as a game-changing tool in the global financial ecosystem. Versan Aljarrah, founder of Black Swan Capitalist, recently emphasized this in a post on Twitter, discussing the significant roles XRP and XLM could play in shaping the new global financial system.
Aljarrah pointed out that XRP is specifically designed to enhance institutional liquidity for cross-border transactions, making it a vital asset in the evolving landscape of global finance. Meanwhile, XLM offers a robust infrastructure tailored for efficient peer-to-peer transactions, positioning it as a key player in facilitating everyday financial interactions
Technical analysis
Xlm bulls broke 0.15$ major resistance and now ready to break the second wall which is 0.45$, if btc pullback then Xlm correct then gets ready for second pump,next targets are 0.53, 0.57 and 0.59$. most indicators shows bullish signals and the volume looks good
