STELLAR

XLM looking StellarXLM looking like it could breakout soon. Descending wedge/triangle.
Break up Target: .75
Break down Target: .48

XLM 4hIt would be a good chance to a good bargain.
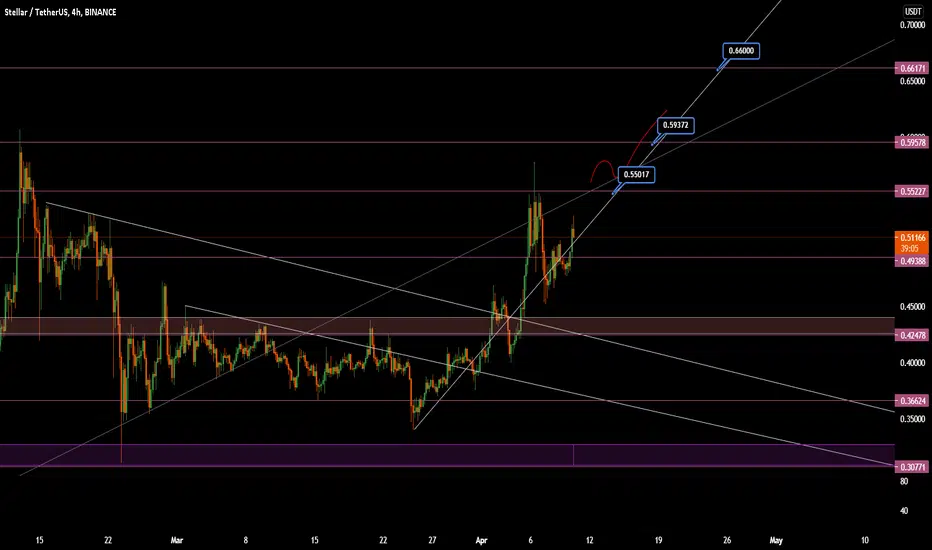
if full down ====> short position 0.57
if break out ====> long position 0.63
Wish you all the best...


ichimoku trade : long position2 scenario :
1\. buy position on senkou B or in the ichimokou cloud
2\. buy position in the next candle of the cadle with the upper close than it'slast ones upper shadow

XLM/USD Long: $1.20XLM has broken previous high. Expected to attempt to test blue resistance again around $1.20 range. Stop loss below previous high marked on chart.
Disclaimer: This is not financial advice as I am not a professional. Trade at your own risk! Happy Trading.

Stellar tightening it's coils. Getting ready to jump?XLM seems to be forming a bull flag or maybe just re-testing the support line before resuming North. Either way I'm keeping my eye on it... #xlm #stellarlumens #breakout

XLM Easy Long Setup
Set alerts for the pull back to the FIB pulled area on the chart for the Long setup .
I will set alerts as we descend down towards my buy zone and will monitor BTC movements before taking a trade with a sl at around .52
I expect to see 75 as a target based off 1-1 EXT which will generate 30% profits
Like +Share+ Follow Its only a button and keeps me motivated to produce more charts and analysis ...Thanks


XLM | JBWeeklyPrediction For trading, we can set buy position above 0.495
Targets: 0.53, 0.59, 0.61
This is my view for this week.
I am expecting wave E to 0.55-0.61 (shorterm).

Stellar Lumens doubts clearanceBonjour! Most viewers who viewed my previous idea about XLM/USDT not touching a dollar might be thinking how I changed my mind and said XLM will touch a dollar. Well I am still on my opinion that it won't soon but to make it clear for people that are controversial and emailing me that it will; I just want to say YES IT WILL, but I meant it won't in the next week or 2. Here's another graph to show that it may touch within the first 2 weeks of May.

XLM.USDT (Y21.P2.E1).Finally movingHi Traders,
Like many other ALTs, XLM is in the final stages of this re-accumulation structure and is moving with lower highs.
The longer it takes can be an indication of a bigger move.
This aligns with Wyckoff Schematic 4
All the best,
S.SAri
Big picture


XLM Continuation of movement within the triangle and test $0.5After a strong wave of decline that continued in the XLM market from February 14 to 23, buyers were able to feel confident in themselves. The main prerequisite for this confidence is a liquid price zone of $0.31-0.33. This range first stopped a powerful wave of XLM price growth back in January 2021. Now it serves as a support for buyers and a critical point of the real growth trend:
As we can see on the chart, after February 23, buyers are confidently fixing above the range of $0.31-0.33, forming a triangle. In addition, we see that within this range is a black trend line, which keeps the price of XLM from a fatal fall to $0.2. Since the XLM market is currently within the triangle, there is a high probability of the start of a new local wave of decline.
If buyers manage to keep the range of $0.31-0.33 , we will expect a new price shot towards $0.5.
__________________________________
We create both short-term ideas (for a local understanding of the market situation) and medium-term forecasts of price movements.
Subscribe to us and get daily concise analytics!

XLM - 6h. Buyers should rest and keep $0.38-0.4In just two months from the beginning of 2021, a quality rally took place on the XLM market. The price of XLMUSDT has grown by more than 350%. During this time, buyers managed to update a high of 2 times. Good dynamics, but is there enough potential for buyers to maintain this pace?
If you analyze the first wave of Stellar price growth, you can see a sharp momentum , which is supported by large volumes:
The second wave of growth in the XLM market, which began on January 28, lasted longer. Buyers found it difficult to raise the price and it is noticeable by candlelight. In addition, this wave renewed the previous high, but there was an impression of weakness of buyers. This impression intensified after the buyers were unable to update the previous high during the 3rd wave. Trading volumes during the 3rd attempt to increase the price of XLMUSD were lower. Thus, a long-term triangle -like correction could begin on the XLM market.
In the 6-hour timeframe, the first critical point is at $0.38-0.4. Approximately in this range, buyers gained a position for further growth during the month. If buyers fail to keep this range for XLM investors, a critical point will come. The last chance to continue the trend is in the global range of $0.31-0.33 . The loss of this range will quickly send the price to $0.2
To continue to grow the XLM market, buyers need to hold above $0.5 . Therefore, we will expect another test of the strength of buyers to decide where to buy XLM.
P.S. Our previous XLM idea
___________________________________
We create both short-term ideas (for a local understanding of the market situation) and medium-term forecasts of price movements.
Subscribe to us and get daily concise analytics!


XLM - Near term potential mega DUMP - STOP SWEEPER option - CAREZOOMED IN FROM LAST IDEA attached
\
****WARNING S*&T YOUR PANTS POTENTIAL**** 70%+ flash dump??? wtf
Whether this plays out or not there is an important lesson here.
Just when the mob of lil krill (thats you)(and me) start all having their sweet longs up and in sweet profit, on an OBVIOUSLY positive macro leg up area,,, the rugs are delivered from below as the whales rise up and eat everyone's positions (and their low funding shorts absolutely print easy millions, and their spot bags are full).
Its all over so fast you can't really react very well to it. Then the big bull leg up kicks in. At differing speeds everyone who was forced out by stops fomos back in.
Its happened before mannny times. One of them you can see right here in this idea plain as day.
You can try and do two things:
1. Just hodl. 'easiest option'. but you have to really feel the pain as you baghold that 40% soul crushing dump (and you found out about it and got to your computer like halfway down it so your confused what to do).
2. put a pretty darn tight-ish stop, like say 8-12%, and HOPE to get stopped out early. ready to start rebuying all your positions as the dump evolves down. or rebuying right away if the market does a hard bounce up and this whole idea is invalidated.
NOTEs
*putting a 20% stop say puts you in a difficult position, think about it.
*putting a super tight stop (<8% ish ) is just dumb as you'll get chopped out.
*market does a say 12%-15% (quite 'common' these recent days) chop and bounces hard up invalidating this idea, then you just lost a bunch of tokens and value to your port.
so there are obvious risks to try and catch an opportunity like this.
WILL this one playout on XLM again? Is this fractal even in the right place? if it is will it happen again or deviate before? was that just a random glitch in the matrix for that period and wont happen this time?
Also IF this does playout similarly here, will it only happen to XLM?? (prob would be ALT wide)
Was this old one exacerbated by lower volume etc back then, was it supposed to stop at the obvious ascending triangle area edge (that ive marked in the chart)?
SO many variables.
I THINK this kinda move makes sense as everyone's longs go up. It IS a great time to pull this shit. Hence I am going to work around the possibility of this happening.
Stops up on all my spot as per option 2 above SOON.
***I am just putting these ideas down somewhere. its obviously not financial advice. Your hopefully a grown up who can make their own financial decisions.
DO WHATEVER THE F*&K YOU WANNA DO then MAN UP IF IT DOESN'T WORK :)
glhf

Stellar Lumens Consolidating If you've taken a look at the markets lately, then you've probably noticed that Stellar Lumens is looking extremely bullish as of late.
For those that are unaware, we're going to break down exactly why people are so bullish on Stellar Lumens lately, and it has nothing to do with their asset's price relationship with XRP (which has also been going nuts as of late).
Let's take a look at the charts and see what else we can find out from Stellar Lumens prior price action.
Stellar Lumens Price Analysis
From the chart above, we can see that Stellar Lumens made a concerted effort to push beyond the overhead horizontal resistance sitting at 52 cents (and for some period of time it was successful in doing so)
However, if we zoom in a bit closer on the daily resolution, it does not appear that Stellar Lumens was able to hold its advantage beyond this point:
As we can see from the chart above, Stellar Lumens has been trading around this zone for quite some time with no apparent success breaking above the primary overhead resistance at 52 cents.
Other notable points can be found at the following:
1. 43 cents
2. 37 cents
3. 30 cents
Each one of those points are a fair amount of distance from where the price is currently.
Let's take a look at the distance between the current price and the underlying support.
Librehash Reversion Ribbon V2
In the chart above, we can observe the following:
1. Dowturn in the direction of the ribbon, overall (bearish)
2. Consolidation of the ribbon, which means that the two ends of the ribbon are converging together (bearish)
3. The Histogram confirming what we mentioned in #2 (bearish)
4. The candles are dark green but with a red outline (which indicates the bearish underlying trend that continues to crop up)
Balance of Power RSI
The Balance of Power RSI is actually ambivalent in this situation (it was expected that there would be some clear bearish divergence here).
Let's take a look below.
Below a pseudo line of best fit is drawn:
Conclusion
Stellar Lumens appears to be farly neutral at this point in time.
There's nothing to suggest that its going to bust above the resistance directly overhead, but in time this is definitely a latent possibility.

⚡SUPER STRONG SUPPORT & RESISTANCE⚡🍁XRP ATH: $3.3🍁
🔥PRICE IS GOING TO BREAK UP $1.5 THEN HIT ATH🔥
😉MONEY IS TRANSFERING FROM STELLAR TO XRP😉


STELLA'S HOT GIRL SPRING: ACCUMULATION + BULLISH SIGNALSI haven't really been on speaking terms with Stella after I bought in then stopped out right before the epic pump some months ago... You can see my previous analysis in the link below... I got impatient (and a little thirsty for some other hot girl coins...) which is a great way to lose money in this market. Clearly I'm still a bit bitter she left me in the dust... I just hate when I don't follow my own advice XD
Anyway... I decided to check in on my old girl Stella; after her crazy rebound, she decided to calm down and take some time for herself... but it seems like a lot of other guys have been checking her out over the last month of consolidation, and maybe just maybe she's ready to put herself out there again...
okay okay enough silly metaphors
Looks to me like there's been some accumulation, probably preceding the next move higher, which may happen soon. Bullish divergence on 4HR Stoch RSI is playing out + a bullish MACD cross on 4HR + favorable market conditions, given Altcoin dominance is on the rise & large caps are FINALLY moving again... this can only equal one thing:
Stella's getting back in shape for a hot girl spring ;)
STEEELLLLLLLAAAAAAAA!!!!
happy trades,
CD
