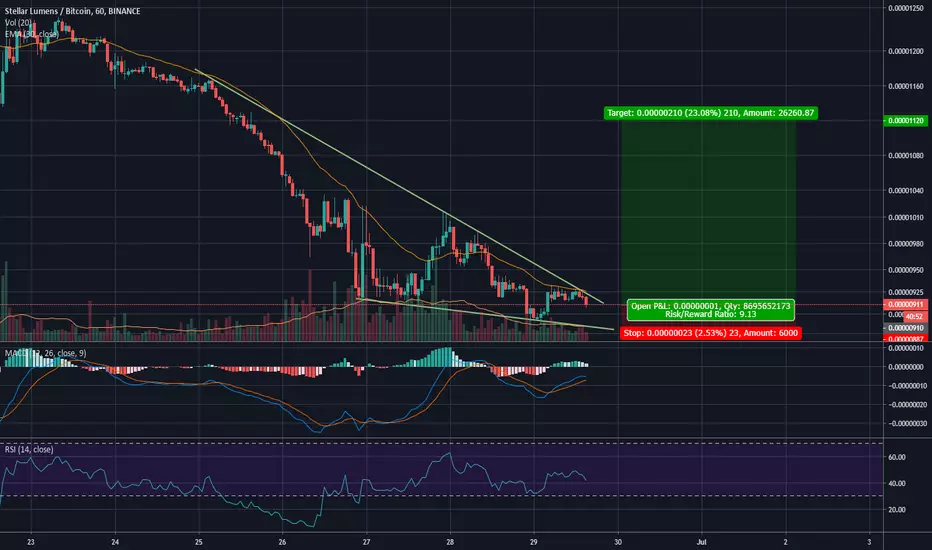
STELLAR LUMENS XLM - Falling WEDGEXLM / BTC is in a great Momentum. We have a very powerful standard highly BULLISH . A great FALLING WEDGE is ready to go. Worth the risk. Time to multiply our BTC!
Come on! Are you prepared for bigger BULLRUN of all?
Many ALTs are ready in accumulation to launch the biggest wave of all. Wave 3 is larger and more impulsive. I hope it's ready. 2020 we will be MAINSTREAM. Big money is coming here. Who lives will see.
Observing the DOMINANCE of the BTC , we have a possible DOUBLE TOP . We are very close to an "Alt SEASON"
This time whales multiply their BTCs . Welcome back to 2017.
Are you ready?
It will be the biggest BULL RUN of ALL!
HERE WE GO! CAME OUR TIME!
ALT SEASON 2019!
HOOOOOOOOLD
HOOOOOOOOOOOOOOOOO IT
the rocket will start
Real money is made now.
2020 awaits us. Buy cheap from pessimists and sell expensive to optimists. The time is now. Only the strong survive
GO HARD!
Stellarlumens


#XLMBTC - Add to Wathc list & set Alerts#XLMBTC
This is not a shitcoin shitcoin. I will be watching for a break. You too, set some Alerts. Remind me if and when we get out of this shitty down trend. Has a big potential. But i wont bother until we breakout and i see confirmed reversal signs.


XLMBTC BULL ROCKETTop coin that has not shown itself properly yet Stellar Lumen
Stellar is an open source, decentralized protocol for digital currency to fiat money transfers which allows cross-border transactions between any pair of currencies.
In 2014, Jed McCaleb, founder of Mt. Gox and co-founder of Ripple, launched the network system Stellar with former lawyer Joyce Kim. Before the official launch, McCaleb formed a website called "Secret Bitcoin Project" seeking alpha testers
I know people who work in XLM project in the USA, San Francisco, where there are many exchanges such as Coinbase. Sometimes, I communicate with them and I understand that we can expect a lot from them in the near future.
In fact
18% of coins are in circulation. CAP 105 142 706 350 19 425 800 489 XLM.
While Ripple 40% are in circulation. CAP 99 991 588 101 XRP 42 566 596 173 XRP
Involvement on Github is growing
Global Bids: $5,034,562.42
Global Asks: $4,526,580.27
Event coming on this coin:
17 July 2019
Toronto Meetup
22 July 2019
DOGET for XLM Holders
31 August 2019 (or earlier)
Minor Release
30 September 2019 (or earlier)
Projects Using Wallet SDK
30 September 2019 (or earlier)
Kelp Bot Improvements
30 September 2019 (or earlier)
Improve decentralization
30 September 2019 (or earlier)
Improved Node Management
31 October 2019 (or earlier)
Minor Release
04 November 2019
Stellar Meridian Conf.
31 December 2019 (or earlier)
Q4 Protocol Upgrade


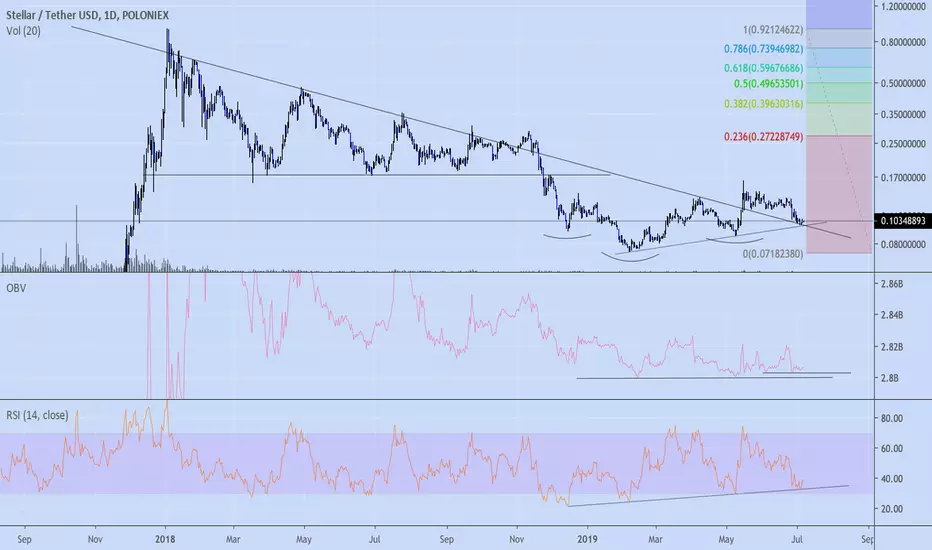
XLM Is The Only Major Crypto STILL In A Downtrend Yup. Will XLM break out? It's continuously building pressure on the downtrend resistance, but it's possible Bitcoin will correct before it gets a chance to see higher prices. Either way, a lot of money will be made, regardless of direction. It's been consolidating between 11 and 13 cents for quite a while now. This is pretty much an illustration of why there isn't much resistance or support on either side. I think we're at a point where alts need some positive developments to get going. Unfortunately, there is a lot of fear and uncertainty surrounding XLM at the moment, particularly in regards to World Wire and their relationship with IBM. We all know crypto likes to surprise though...just a little bit of positive news could send this thing really flying, in my opinion. Likewise, some confirmed negative news may send it back to the lows (or even a new low). Either way, it's time to prepare for the move. I think if it can get back above that broken uptrend (purple) my bias will become more bullish. For now, it's neutral.
Additionally, if XLM bounces on the Bitcoin ratio soon, it could confirm a pretty serious bullish divergence (seen on the weekly chart) and finally break out of this enormous wedge:
Breakout targets:
1) $0.16
2) $0.18
3) $0.27-30
4) $0.90-1.00 (only if the entire space goes crazy again)
Breakdown targets:
1) $0.11
2) $0.08-0.09
3) $0.06-0.07
4) $0.045-0.05
This is not financial advice. Just a potential setup I'm seeing, and I'm REALLY curious to see which way it goes.
-Victor Cobra

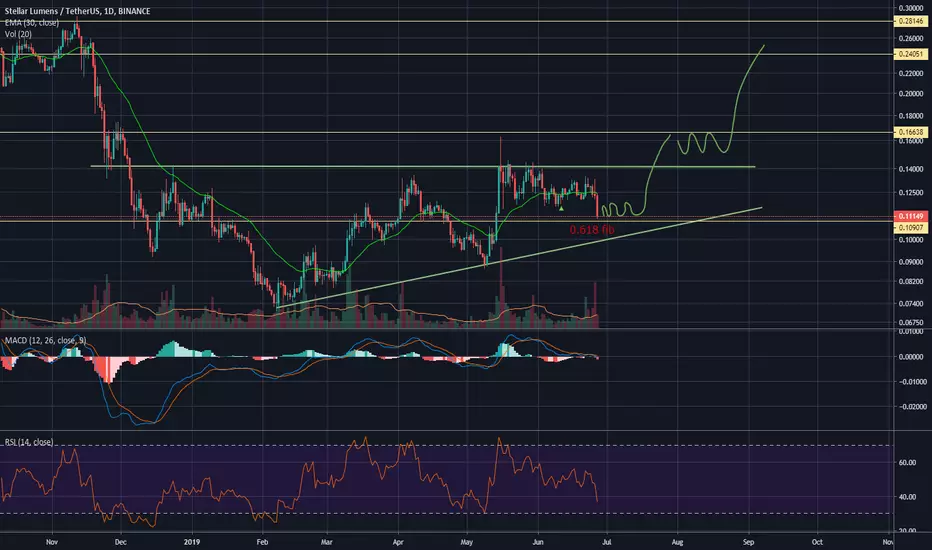
XLM Retracement Complete? Key Fib Level HitXLM has retraced nicely down to the 0.7 ranges on the FIB.
However with decreasing volume it will be tough to see if it will expect a move up or not.
MACD is starting to look more bullish with an uptick on the histogram but still not enough confirmations on the RSI yet.
We are waiting to see if more confirmations are going to come through and a trend holds. Waiting to see what happens to XRP too as it can follow that too.


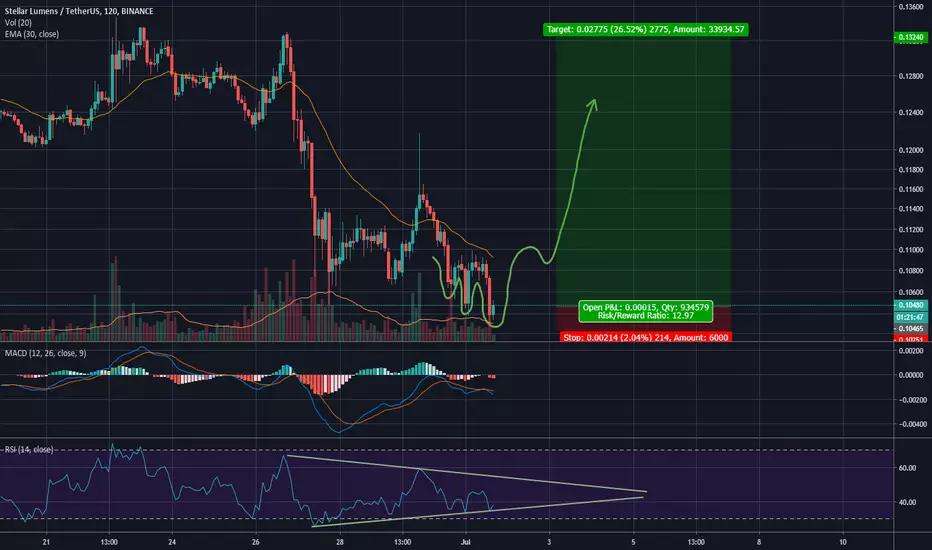
Falling wedge. Resistance levels = bullish targets.If you have no clue about the future TP levels for XLM I can help you!
Good luck!
PS.
Sorry for bad drawing (actually looks like worms) using an laptop. But I hope you understand what I wanted to tell.


BUY STELLAR - ABSORB PANIC + NISON STRATEGY SELL TARGETSBARS A & B ARE THE SAME LENGTH YET...
WITH 4X VOLUME, BAR B COULD NOT MAKE FURTHER DOWNWARD PROGRESS
HOWEVER...
NO LOWER SHADOWS AND REDUCED VOLUME SUGGEST A
LACK OF BUYING INTEREST ABOVE THIS SUPPORT LEVEL
LOSS OF BEARISH ENGULFING PATTERN SUPPORT...
SHOULD CAUSE PANIC SELLING INTO OPERATOR'S BUY ORDERS
ABOVE SIGNIFICANT PITCHFORK SUPPORT LEVEL
STEVE NISON'S PB&J (PULL BACK TO SWEET SPOT) STRATEGY SUGGESTS...
SELLING BETWEEN 1189-1290
PITCHFORK RETURN TO CENTER LINE THEORY SUGGESTS...
SELLING AT 1500

Xlm the second countcount 21 of 2
It's still in a regular ABC correction from the 1st wave & wave 3 is about to start. Trading in a nut shell = right about direction, but stopped out repeatedly from fear, bad ta, & over leveraged before the big move. Investors scale in and beat your a$$
Previous set up was beautiful but alt szn has not started yet and btc is still dragging them around from correlation.
Lets get complex and learn!
Ill update a thread with intra-day trade on my twitter in tv bio

Xlm 2 more counts.count 1 of 2
extended 3rd wave scenario w/ and complex sub-wave 2 structure
Previous set up was beautiful but alt szn has not started yet and btc is still dragging them around from correlation.
Lets get complex and learn!
Ill update a thread with intra-day trade on my twitter in tv bio


Stellar lummens Insane Move commingLast time you will see XLM at $0.123, it has double bull pattern with usd pair and a hughe falling wedge with bull div against btc, also the 3 moving averages are right below $0.123


