Stellar looking very interesting!"Stellar’s cryptocurrency, the Stellar Lumen (XLM), powers the Stellar payment network. Stellar aims to connect banks, payment systems and individuals quickly and reliably. Since its launch in 2014, its vision has been to unite the world’s financial infrastructure so that money can flow quickly and cheaply between banks, businesses, and people. The Internet connected the world’s computers so that information could be shared globally. Stellar aims to do the same for money."
From TA perspective; Stellar found temporally bottom and rebounded nicely over first resistance $0.10 and is now hovering to $0.135 region. Weekly & daily charts are looking very nice and behind good news in last week, the price of XLM could find further gains. On Weekly chart there was huge buy support on $0.0724. I’m now targeting $0.135 and potentially $0.20 BITFINEX:XLMUSD . According to last news, this coin seems a very good long term buy. I will cover it from here on for all the day traders, but for all long term holders, I think it’s a good entry point.
-> Coinbase announced that it was about to launch the digital asset Stellar Lumen (XLM) on Coinbase Consumer (i.e. Coinbase.com), its platform for regular retail investors/traders, as well as on Coinbase's mobile app.
-> "Six international banks are planning to issue their own stablecoins on IBM’s Stellar-powered money wiring service, IBM and Stellar announced Monday. Today more than 44 international banks that support payments are on the service, IBM Blockchain World Wire — and several of them have signed letters of intent to issue their own stablecoins, according to Jesse Lund, Vice President of IBM Blockchain, who made the announcement in a keynote at Money 2020 Asia in Singapore alongside Stellar cofounder Jed McCaleb."
Stellarlumens


Stellar Finally Breaks The Bearish Channel! (XLM)Aha! So the dip below the long term ascending support was a fakeout after all. I posted a few bearish ideas recently, giving an idea of what could happen if the market failed to recover here. However, it's fairly clear at this point that the market is recovering. Today we had some pretty insane gains for altcoins - gains that have not been seen in quite a while. Congrats to those who have been buying throughout the bear market. Odds are, if you have been DCAing, you're finally seeing some profits!
On the XLMBTC chart, I pointed out that XLM had hardly any support until the 1300 area after it broke below 2000. Despite the selloff on the Bitcoin ratio, XLM remained relatively stable in its USD valuation. Additionally, the buying volume when XLM was in the 7 cents zone was so powerful that it was clear to me that a lot of demand existed down there --- in which case I thought it likely that was the bottom on its USD chart. This is why I did not sell. I also posted an educational analysis about why the selloffs on altcoins could be bear traps. These were low volume selloffs that simply had to do with Bitcoin's rise. People were not necessarily trading their altcoins much. That "terminal shakeout" analysis is linked at bottom.
Anyway, XLM is simultaneously breaking out of an enormous inverse head and shoulders pattern AND its downtrend channel. Based on the bullish momentum of the market, this should not be taken lightly. This perfectly explains the massive buying momentum once the $0.137 level was breached. Further targets are illustrated on this chart. The next resistance is in the 18 cents zone, and above that there's 30 cents. However, just as Bitcoin smashed through 6K and 7K, it's possible XLM heads straight up and smashes through that whole consolidation zone as if it didn't even exist. That was the accumulation area for many months, so there may actually not be much sell pressure once we make it there. I guess we'll see. On the downside, if the support is broken again (currently near 12 cents), and if we break back into the bearish channel, that would be a bad sign. So far, there's no reason to assume this will happen.
On the contrary, it seems more likely that XLM could make an attempt at its all-time-high sooner than expected.
This is speculation and based on my own opinion. This should not be taken as financial advice.
-Victor Cobra


XLM ready to rocket! XLM forming a very nice hammer on volume today and if we can close above this resistance level then local highs are on the table
Engulfing candle forming as well with MFI turning higher

The Stellar OpportunityWith BITFINEX:BTCUSD screaming high above $8k, we've seen most alt coins lag quite a bit. Most performances have been pretty bismal, but I think things may be about to turn around if we can see Bitcoin cool off here.
One coin that grabbed my eye was BITFINEX:XLMUSD . I did some chart analysis and it seems to have reversed trend giving us a great set up with good potential upside of around $0.30 for my near term target.
I entered a trade at $0.11
Case for the Bulls:
Strong bounce off of supporting trendline
Clean break out from suppressing trendline
First bullish sign from Lazy Bear Indicator
Bitcoin showing upside
Case for the Bears:
General Altcoin market conditions may not yet be ready
Case for this to be a bull trap
Overall, as long as we hold the supporting trendline, we have an uptrend. All we must do is buy the higher lows and protect our capital in the event of a reversal.
Nothing fancy here, just good ole trend trading.
Cheers.

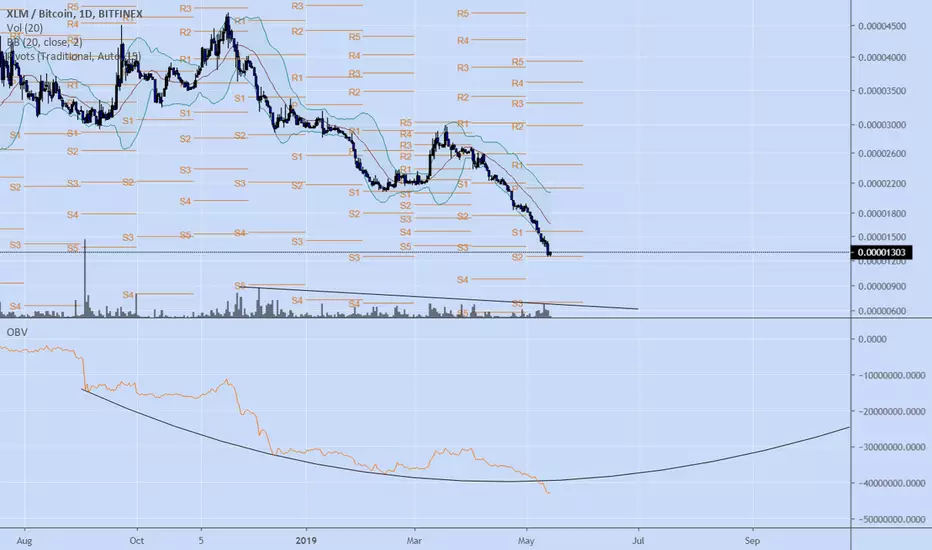
#XLM $XLM / BTC DAILY ANALYSIS #STELLAROBV has broken its parabola on the daily
I still think that it is just a fake out based on how far it is sitting outside of the BBands on the Weekly
Double bounce off of the S2 pivot
Bullish div on volume / price action
RSI testing area before it last bounced
Last flush before turning bull? We will see soon
Potential H&S forming on XLM/BTC. Watch these key areas.Potential H&S forming on XLM/BTC.
The next day should tell us what we need to know and whether a reversal of the bearish trend will happen.
With BTC gaining a lot in the last few days it has made trading tough and a lot will depend on BTC performance but if we can break through that neckline and climb to 1500 sats then we may see a quick climb.
Keep your eyes on the charts as falling through the 1375 area would negate this trade and the H&S formation. As it is we are very close to the tip of the second shoulder if one is to form.
Good luck out there

XLM after shake outAfter this brutal Shake out, it looks like XLM found out his bottom around 1400ish in corellation with December 2017 rally.
if BTC repump hardly we could see 1150ish but anyway right now it worth a try to re-enter markets.
i didn't show indicators simply because everything is oversold.
Follow closely BTC King for now and stay Safe.
Happy Tr4Ding !

Valari Bot Feedback XLM/ETH BUY ON 04/07/19Hello everyone,
The second trade the bot has active is XLM/ETH.
At this point, XLM is testing lows so it might take another 30-60 days to exit this position, considering the fact that this account was supposed to be a long term long I im really bothered right now.
P.S XLM is going to 0, don't long it unless you have a tight stop 2% max.
All the best


XLM Stellar Reached Bottom of Right Shoulder in H&SXLM is looking prime for a rally if BTC changes direction in the coming weeks. The 6 month head & shoulders looks too good to be true.

$XLM - LONG - 1D - TRADE IDEA- Watching this one closely looking for a bullish reversal structure to form before entering
- either a nice double bottom here or a break below and reclaim
- RSI is oversold but that doesn't mean shit as far as I'm concerned it helps build bias and that is all, especially at an untested support.
- Really am expecting this zone to act as support and very confident on buying here. Its is an OB back from December 2017 that has never been test and was the dump prior to XLMs huge run
- Take 75% of profit at 2170 SATS and watch for 2326 to break and act as support to be honest.

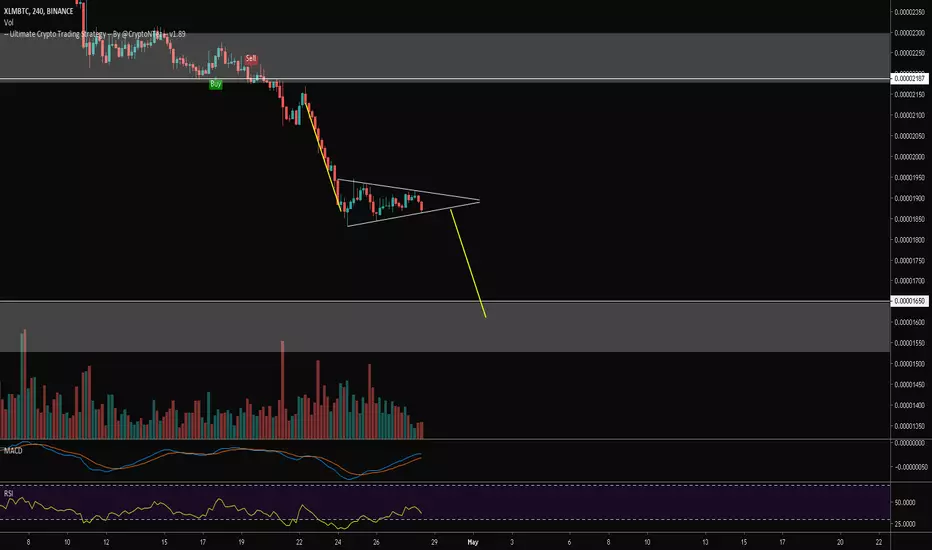
$XLM Bear Pennant in the 4h announcing another drop?$XLM Bear Pennant in the 4h announcing another drop?
UCTS Sell signal on the 4H chart (15% drop already since signal)
RSI falling
If pattern is confirmed and we break to the downside... I expect a test of the ~1650sats support.
#XLM
STELLAR FORMING A BIG REVERSE HEAD AND SHOULDERLOOKS LIKE A MONTHS OR WE ATLEAST 70% RETURN FROM CURRENT PRICE ..
STELLER WILL BE ROCKETING SOK

Another buy opportunity for XLM (Bullish divergence 4h)One of my classic attempts to predict future price movement direction based on basic indicator
RSI - Relative strenght index + Bull/Bear divergence
** Not a trading advice so trade only at your own risk **

XLM / USD - 5% RISK 50% REWARD - TAKE IT OR LEAVE ITXLM is showing signs of bullish behavior with this pattern we have in a form of widening wedge. Risk can be minimized if you choose to buy on resistance break.
This is a low risk trade.

Stellar Lumens Ready For a 10X!!!Welcome back!
Today I wanted to go over stellar lumens because I see massive profit potential coming very soon.
This was a coin I already made lots of money on back in the last cycle and I see the EXACT same set up happening right now.
DONT MISS OUT!
This idea will give you an in depth analysis on XLM and what I see happening in this cycle moving forward.
Based on Market Cycles I have successfully traded this pattern sequence for serious profits.
This sequence has 3 parts that I call, "Blow Off Top, Accumulation Distribution, and Final Sell Off."
Many top alts follow this pattern which is why I expect them to make us serious returns moving forward.
Let's dive right in and show you what I mean!

XLM/USD - Day chart - potential +90%XLM looks like its completed waves 1 and 2 on the day.
looking for wave 3 to my target zone.
f you've found this useful, feel free to donate. thanks.
BTC: 1LCayhGfdzsNP9M5227LyE28FKed4thEsB
LTC: LaPLQ6JoiqrxYED9FBNVphyApAhpW4Yw3R
ETH: 0x1Ec59747Ff307FaA71de070A3914e9afFbac7424

xlm stellarlumens 70% profit opportunity all of big cap coins started their rally but not xlm so im anticipating a nice gain from this one
first TP is 0.12$ with 24% profit
let's see what will happen.

XLM SHORT AND LONG %20-30 PROFIT MARGINHello guys. I expect a pullback for XLM USD and form IHS. Please have a look at my chart and read my trade plan...
Wish you the best


