$XLMUSD | Potential Move Down | BearishThis move may have been a set up for strong sells. I'd look at 0.16~~ as a battle ground as well as the highlighted area on chart. If we do indeed get a failure here, I would expect price to hit the defined target of 0.03413112. From there, it will be a great buy opportunity.
Stellarusd

Stellar in reversal zoneStellar retraced to nearly 0.236 zone from its last pump
Stock RSI & CCI oversold
Back in previous resistance zone

XLM possible movments It seems that BTC has knocked some fins out of most alts, less so with XLM. But there are still multiple plays on the table.
Version 1 is that we push through the 0.08900 resistance. Version 2 we fall through first support at 0.07770 level and there we bounce back up again. Eventually Fib 0.618 should act as the strongest support here and if that holds, then the next leg up has a strong momentum to push beyond 0.09000.

XLMUSD is foming a bullish Crab | Upto 28% expectedPriceline of Stellar Lumens / US Dollar cryptocurrency is forming a bullish Crab and soon it will be entered in potential reversal zone insha Allah.
This PRZ area can be used as stop loss in case of complete candle stick closes below this area.
I have defined the targets using Fibonacci sequence:
Buy between: 0.07061740 to 0.06561316
Sell between: 0.07452345 to 0.08409520
Regards,
Atif Akbar (moon333)

XLMUSDT has formed bullish Shark | A good long opportunityThe priceline has formed a shark pattern and entered in potential reversal zone.
All the pattern is behaving exactly required for shark therefore I have ignored the difference of C leg.
MACD is turned weak bearish from strong bearish soon it will be turned bullish.
RSI is oversload.
Stochastic has given bull cross so I am expecting the price action will hit the sell target soon insha Allah.
The PRZ area can be used as stop loss point in case of a complete candle stick closes below this area.
I have used Fibonacci sequence to set the targets:
Buy between: 0.05815 to 0.05715
Sell between: 0.05901 to 0.06099
Regards,
Atif Akbar (moon333)

XLMUSD extended the leg and formed bullish CRABIn my previous chart I published a BAT pattern but the price action has extended the leg and formed a bullish bulish CRAB pattern therefore I have revised the targets using Fibonacci sequence as below:
Buy between: 0.06011224 to 0.05896802
Sell between: 0.06099956 to 0.06315821
Regards,
Atif Akbar (moon333)

XLMUSD formed bullish BAT | A good long opportunityOn 4hr chart priceline of XLM / Dllar has formed a bullish BAT and entered in potential reversal zone to hit the sell targets soon insha Allah.
Volume profile is showing less interest of traders within PRZ area.
But MACD is strong bearish and Stochastic did not give bull cross therefore I would recommend to wait for MACD to turn weak bearish or stochastic to give bull cross then buy.
I have defined targets using Fibonacci sequence:
Buy between: 0.06170363 to 0.06137483
Sell between: 0.06248766 to 0.06366458
Enjoy your profits and Regards,
Atif Akbar (moon333)

XLMUSD has formed a bullish BAT | Upto 596% possibilityPriceline of XLM / US Dollar has formed a bullish BAT pattern and entered in potential reversal zone and ready to hit the sell targets soon insha Allah.
But the volume profile is still showing the traders interest below the PRZ area even the POC of volume profile is also below the potential reversal zone, therefore I would suggest for secure trade we can wait for stochastic to give bull cross and for the MACD to turn weak bearish from strong bearish atleast upto 2 week chart and also use the potential reversal zone as stop loss (In case the candle stick will be completely closed below the potential reversal zone).
I have used Fibonacci sequence to set the targets:
Buy between: 0.110241 to 0.059381
Sell between: 0.231517 to 0.413568
Enjoy your profits and Regards,
Atif Akbar (moon333)

XLMUSD has formed bullish CRAB pattern |and entered in PRZ areaOn 4 days chart priceline of Stellar / US Dollar cryptocurrency has formed a bullish CRAB pattern and entered in potential reversal zone.
RSI is oversold.
MACD is turned weak bearish from strong bearish.
Volume profile of complete pattern is showing less interest cryptocurrency trading at this area.
I have defined targets using Fibonacci sequence:
Buy between: 0.06878953 to 0.04329465
Sell between: 0.08854757 to 0.13640667
Enjoy your profits and regards,
Atif Akbar (moon333)

XLM, bounce on support?XLM, as many other altcoins has been heavily punished by the alt bear cycle. Now, the Stellar Lumen is in an important level in which it has to decide whether it stops falls or attacks the next resistance.
As the chart shows us, the gap hasn´t been closed yet. This can add further bearish preassures to the prices. Gaps usually drive the priec up or down to close it, to afterwards bounce back up. However, in the hypothetical situation in which the XLM gap is closed, the price has to decrease 78%.
Most of the altcoins still find themselves in a bear cycle. The bottom seems to be very close, however, we have to be careful with long positions.
The Copilot

There is a possibility for the beginning of an uptrend in STRUSDTechnical analysis:
. Stellar/Dollar is in a range bound and the beginning of uptrend is expected.
.The price is below the 21-Day WEMA which acts as a dynamic resistance.
. The RSI is at 39.
Trading suggestion:
. There is a possibility of temporary retracement to suggested support zone (0.08495 to 0.07211). if so, traders can set orders based on Price Action and expect to reach short-term targets.
Beginning of entry zone (0.08495)
Ending of entry zone (0.07211)
Entry signal:
Signal to enter the market occurs when the price comes to "Buy zone" then forms one of the reversal patterns, whether "Bullish Engulfing" , "Hammer" or "Valley" in other words,
NO entry signal when the price comes to the zone BUT after any of the reversal patterns is formed in the zone.
To learn more about "Entry signal" and the special version of our "Price Action" strategy FOLLOW our lessons:
Take Profits:
TP1= @ 0.10213
TP2= @ 0.11930
TP3= @ 0.13400
TP4= @ 0.14993
TP5= @ 0.17345
TP6= @ 0.20730
TP7= @ 0.23610
TP8= @ 0.28670
TP9= @ 0.33745
TP10= Free

XLM is ready to go to the Moon? Long potential inv. h&sXLM is ready to go to the Moon? Long potential inv. h&s Everything you see is on the chart. Go long with pattern confirmation or accumulate before the break out using stop loss strategy. GL HF! Ali Jack! Like & Subscribe (ALL IN TRADE)


XLM (Stellar)(Binance) Bull Run is started = PUMPXLMUSD (Binance) Bull Run is started.
- Looks like this summer will be very hot!
- Trend lines from past interact well with current local Trend bottom.
- Next challenge to maximum price.
Someone said that Stellar coin (Like Phoenix future coin) of Rothschild and the future, but you can play on the price increase and Pump.
- BTC Dominance is down (we have long target)
Target 1 = $0.29 (+87.10%)
Target 2 = $0.41 (+164.52%)
Target 3 = $1.00 (+545.16%)

There is a trading opportunity to buy in STRUSDTechnical analysis:
. Stellar/Dollar is in a range bound and the beginning of uptrend is expected.
. The price is below the 21-Day WEMA which acts as a dynamic resistance.
. The RSI is at 46.
. While the RSI downtrend and the price downtrend in the daily chart are not broken, bearish wave in price would continue.
Trading suggestion:
. There is a possibility of temporary retracement to suggested support zone (0.09934000 to 0.08942000). if so, traders can set orders based on Price Action and expect to reach short-term targets.
Beginning of entry zone (0.09934000)
Ending of entry zone (0.08942000)
Entry signal:
Signal to enter the market occurs when the price comes to " Buy zone " then forms one of the reversal patterns, whether " Bullish Engulfing ", " Hammer " or " Valley " in other words,
NO entry signal when the price comes to the zone BUT after any of the reversal patterns is formed in the zone.
To learn more about " Entry signal " and the special version of our " Price Action " strategy FOLLOW our lessons:
Take Profits:
TP1= @ 0.11930000
TP2= @ 0.13400000
TP3= @ 0.14770000
TP4= @ 0.17342000
TP5= @ 0.18912000
TP6= @ 0.20730000
TP7= @ 0.23610000
TP8= @ 0.28670000
TP9= @ 0.33745000
TP10= Free

Stellar Lumens Ready For a 10X!!!Welcome back!
Today I wanted to go over stellar lumens because I see massive profit potential coming very soon.
This was a coin I already made lots of money on back in the last cycle and I see the EXACT same set up happening right now.
DONT MISS OUT!
This idea will give you an in depth analysis on XLM and what I see happening in this cycle moving forward.
Based on Market Cycles I have successfully traded this pattern sequence for serious profits.
This sequence has 3 parts that I call, "Blow Off Top, Accumulation Distribution, and Final Sell Off."
Many top alts follow this pattern which is why I expect them to make us serious returns moving forward.
Let's dive right in and show you what I mean!

XLM/USD - Day chart - potential +90%XLM looks like its completed waves 1 and 2 on the day.
looking for wave 3 to my target zone.
f you've found this useful, feel free to donate. thanks.
BTC: 1LCayhGfdzsNP9M5227LyE28FKed4thEsB
LTC: LaPLQ6JoiqrxYED9FBNVphyApAhpW4Yw3R
ETH: 0x1Ec59747Ff307FaA71de070A3914e9afFbac7424

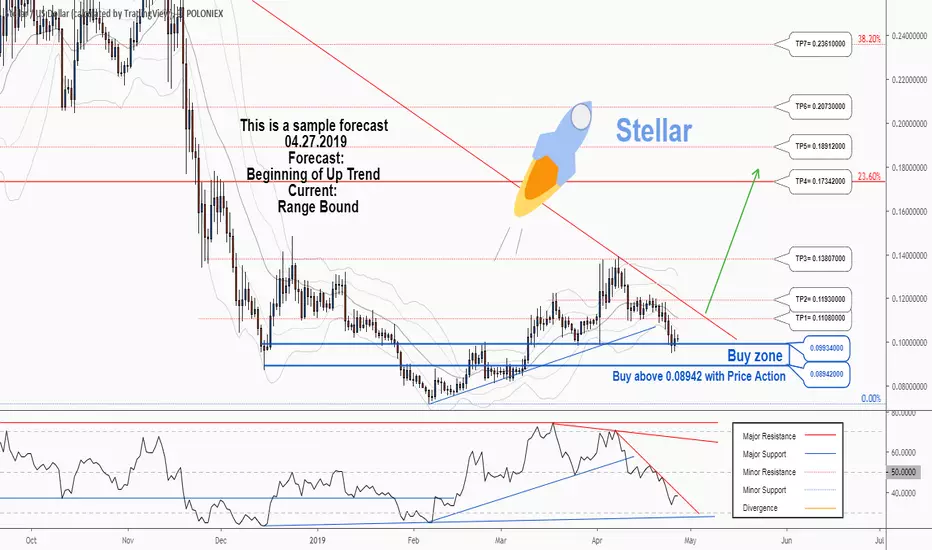
There is a possibility for the beginning of an uptrend in STRUSDTechnical analysis:
. STELLAR/DOLLAR is in a range bound and the beginning of uptrend is expected.
. The price is below the 21-Day WEMA which acts as a dynamic resistance.
. The RSI is at 38.
. While the RSI downtrend and the price downtrend in the daily chart are not broken, bearish wave in price would continue.
Trading suggestion:
. There is a possibility of temporary retracement to suggested support zone (0.09934000 to 0.08942000). if so, traders can set orders based on Price Action and expect to reach short-term targets.
Beginning of entry zone (0.09934000)
Ending of entry zone (0.08942000)
Entry signal:
Signal to enter the market occurs when the price comes to " Buy zone " then forms one of the reversal patterns, whether " Bullish Engulfing ", " Hammer " or " Valley " in other words,
NO entry signal when the price comes to the zone BUT after any of the reversal patterns is formed in the zone.
To learn more about " Entry signal " and the special version of our " Price Action " strategy FOLLOW our lessons:
Take Profits:
TP1= @ 0.11080000
TP2= @ 0.11930000
TP3= @ 0.13807000
TP4= @ 0.17342000
TP5= @ 0.18912000
TP6= @ 0.20730000
TP7= @ 0.23610000
TP8= @ 0.28670000
TP9= @ 0.33745000
TP10= Free


A trading opportunity to buy in STRUSDTechnical analysis:
. STELLAR/DOLLAR is in a range bound and the beginning of uptrend is expected.
. The price is above the 21-Day WEMA which acts as a dynamic support.
. The RSI is at 69.
Trading suggestion:
. There is a possibility of temporary retracement to suggested support zone (0.11789000 to 0.09560000). if so, traders can set orders based on Price Action and expect to reach short-term targets.
Beginning of entry zone (0.11789000)
Ending of entry zone (0.09560000)
Entry signal:
Signal to enter the market occurs when the price comes to " Buy zone " then forms one of the reversal patterns, whether " Bullish Engulfing ", " Hammer " or " Valley " in other words, NO entry signal when the price comes to the zone BUT after any of reversal patterns is formed in the zone. To learn more about " Entry signal " and the special version of our " Price Action " strategy FOLLOW our lessons :
Take Profits:
TP1= @ 0.14580000
TP2= @ 0.17342000
TP3= @ 0.18912000
TP4= @ 0.20730000
TP5= @ 0.23601000
TP6= @ 0.25526000
TP7= @ 0.28668000
TP8= @ 0.33745000
TP9= @ 0.40960000
TP10= @ 0.50150000
TP11= Free
