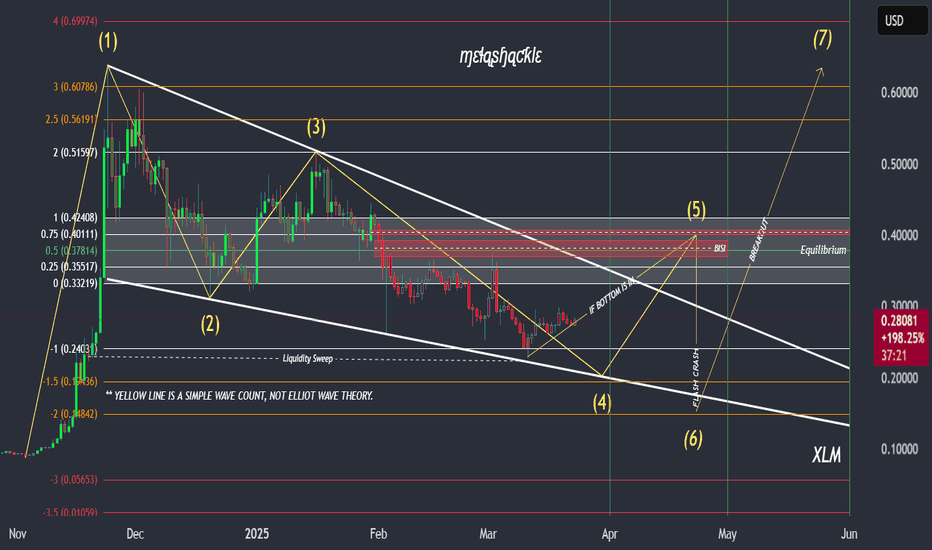
XLM charts with April 'flash crash' thesis zones.Here's my latest XLM chart, which includes potential levels that could be hit, along with an alternative path for the 5th wave, assuming the bottom is already in on the chart.
- If wave 4 is already complete, then the wave 6 "flash crash" low would likely be higher than the chart shows.
- If wave 4 isn't complete, then the wave 6 "flash crash" would likely sweep that low, prior moving into the real breakout beginning in the month of May.
- The real breakout, the 7th wave, would likely take out the previous pattern high making a run for what could potentially become a new all-time high in XLM.
Keep in mind that the "flash crash" in April is a theory and may not come to fruition or could be off in timing. However, I do believe that the breakout will begin in May, even if the "flash crash" does not occur in mid to late April as I've theorized.
Good luck, and always use a stop loss!
Stellarxlm
$3.00 + XLM by September is very likely! It's no mystery that XLM and XRP often trade like they are family. Much like an older brother, XRP generally paves the way for XLM—the younger sibling—and the two share a similar charting structure. However, since the "Trump election pump," although both have broken out, XLM has yet to break above the upper trendline of the current wedge pattern. This leads me to believe that we may soon see XLM surprise everyone. Instead of following, it may take the lead this time by breaking out of the wedge pattern, setting a new all-time high, and then entering price discovery along with its older brother, XRP. Together, they will likely lead the entire crypto market, as they are two of the ISO 20022-compliant tokens with the most potential for widespread adoption.
Keep an eye on XLM—I believe it will not only play catch-up but may even lead XRP and the broader crypto market in the next leg up.
Good luck, and always use a stop-loss!
STELLAR - Intraday Update - 12/06/20 (Short-term) STELLAR - Intraday Update - 12/06/20 (Short-term)
Bottom Line: Subdividing higher within wave iii of (iii)
Breaking above $0.23179 is the next upside objective for the bulls.
Outlook: A fifth wave rally is in its early stages.
Note: Prices can vary between exchanges, and consequently there may be differences in our chart prices due to different data sets.
Lumens trading within a descending triangleWe can see Lumens trading within a clear descending triangle on the 2 hour chart.
I would open a position once there is a clear break and close above the descending line.
RSI is also trading within the same pattern.
The fundamentals are excellent with Stellar Lumens. So I expect it to bounce back strong very soon.
Note: Not financial advice. Charting what I see.


