IOSTUSDT | S/R Flip | Volume Climax | .618 Fibonacci Todays analysis - IOSTUSDT – retracing after a strong breakthrough structural resistance.
Points to consider:
- S/R flip Re-test
- Support confluence
- 55 EMA – visual guide
- Volume climax
- Oscillators overextended
IOST is likely to retrace back to structural resistance after a bullish pattern break, S/R flip needs to hold for a valid long trade.
Structural support in confluence with .618 Fibonacci retracement further solidifies the true trade location.
IOST trading above the 55 Exponential Moving Average, acting as a visual guide, price must hold on retest to support the bullish bias.
Volume climax evident, indication of buyer exhaustion, temporary top may be in as price finds its equilibrium before another probable impulse move.
Both, the RSI and Stochastics trading in overextended conditions, a retrace in price will allow oscillators to cool off, creating space for further bullish momentum.
Overall, in my opinion, a long trade is validated on a successful S/R flip re-test.
What are your thoughts? Let me know in the comments below!
Be sure to leave a like and follow me for daily chart updates.
As always - focus on you, and the money will too!
Stochastic RSI (STOCH RSI)

☆ BTC / USD — Bitcoin Trading ☆Hello on the regular Bitcoin Update.
Just before Monday btc price near resistance and in the wedge pattern inside Symmetrical Triangle.
I am looking for good long entry here at breakout from triangle $9850, or at support of the triangle near $9000—$9200
On the chart you may notice Stochastic RSI and it's divergences inside Triangle Pattern and Wedges.
So for taking profits I am looking at $10000 zone and above.
As always I am calculating my risk and know what I can lose in each trade.
Please follow your own money and risk management when considering using my trading ideas.
Stay tuned, this is
Artem Crypto

LINK/USDT - time to take profit on your shortsPrevious short idea:
LINK/USDT has retraced 30% without a proper bounce yet and is currently sitting close to the bottom of the uptrend channel and on the 4 hour 200 MA.
We can see hidden bullish divergence on the RSI which usually indicates a good spot to re-enter in an uptrend.
The LINK/BTC pair shows it right on the upper trend line of the previous uptrend channel and is very close to a previous point of resistance (36k-37k sats) which now acts as support.
Bears seem to be too greedy right now so I expect a bounce soon, risk-reward is solid at this point.
In the case of BTC shitting the bed it's likely that this trade will become invalid, consider exiting if 1-2 candles close below the uptrend.
Buy zone: green area

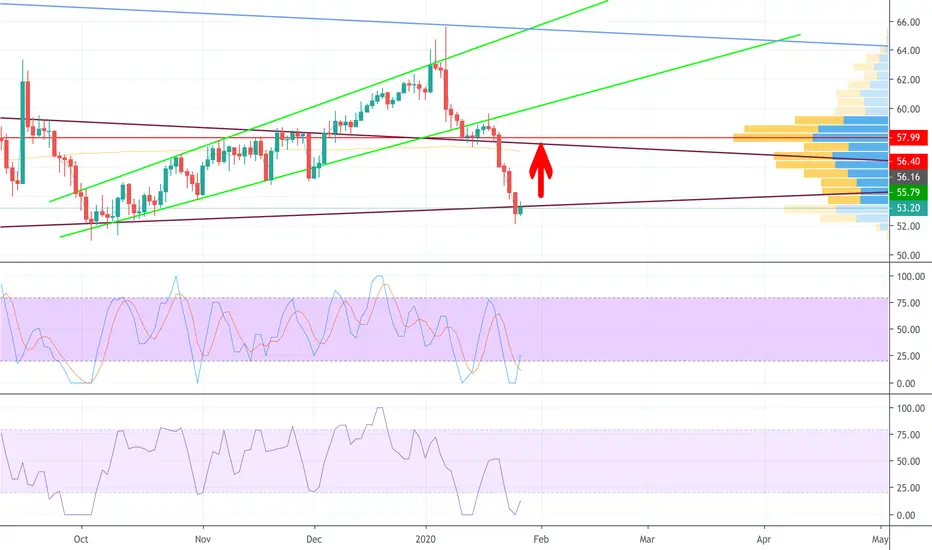
Possible move up?Hello oil traders! I see that oil crossed the bottom of my channel and now looks like it may be moving back up. I had said for a long time that I expected oil to drop down around $52 and it finally did. Now looking for oil to return to the top of that channel around $56.40. StochRSI and MoneyFlow are both moving up which is a good sign. We’ll see what happens.
ATO Bullish Divergence and StochRSI cross and nice tail!I will long ATMOS coming week.
I see a nice set of bullish divergences on EFI and MACD-H, together with StochRSI crossings.
Furthermore, a long wig is seen on the daily, which seems to mean there is a strong rejection there, and the market wants to go the other way.
I expect the target to hit +1,5 ATR line on the 4H timeframe at least.
But I will evaluate the bullish divergence on the daily as well, because if that one plays out we can enter the target zone of 110-111
Weekly impulse is still red (EMA and MACD-H both going down) and therefore I need to see how the week develops, to see if I get out at the short term target or not.
Entry: 107
Short term Target: 109.50
Longer term Target: 111
I will evaluate the strength of the move, to see if it will hit
Stop: 105.99
R/R ratio: 1:2 short term
R/R ratio: 1:3 longer term

BTCUSD breaking up from falling wedge/bull pennant target= 8.6k Awesome t see price action rebound exactly on my stochrsi horizontal trendline. the 1 day 200ma is floating somewhere around the 8.6 k level and I do anticipate it will provide resistance at least upon the initial retest .

1wk stochrsi trndline hints long overdue big correction looming?So this entire year's bull run has left a lot of people in the dust who were waiting for a 31-41% correction to buy in. Everyone was expecting one as early as the upper 5k range but the correction never came. In fact only a few minor bear trap corrections have occured this entire bull run. Looking at this ascending green trendline on the weekly stoch rsi we can see hat it had propped up the price action and prevented any major correction the majority of the bull run and it only just recently finally broke below it. It is now well on it's way back up to retest whether or not the trendline has been flipped to solidified resistance and, spoiler alert: since the green ascending trendline is about to reach the 100 level of the stochrsi it definitely will be resistance. It looks by the trajectory of both the trendline and the stochrsi's blue line that they will both converge a 100 right around July 1st. Due to this and he fact that we have gaps to fill on the cme futures contract some all the way down around 8.5k I wouldn't be surprised if we see he correction after throwing a wick up to the current bull flag target of 12253.13. In fact we may not even reach the full breakout target if one of the 3 white horizontal resistance lines rejects it first(the 11699 horizontal looking the most subastantial out of the 3). All things considered, I may begin to ladder out small amounts of my position with my first limit sell take profit at 11699 and my second one a 12253.I will be keeping a close eye on when the stoch rsi reaches 100 beecause I think it will retest it before the big rejection. It may move slower than I anticipate o where w could climb o he next resistance around 17k before it gets rejected bu judging by how close it is already I doubt it.

Guess which trendline continues to keep breaking bitcoins fall?The weekly stochrsis ascending support trendline has performed phenomenally this entire bull run. It still refuses to submit or bend the knee. Each time during the bullrun i seemed as if the big 31-41% correction was finally about to happen the fall was stopped short as the bullish momentum was bounced up off of this trendline. Once again this has happened to our most recent price action which should allow it to get one more good bull pump before finally breaking through this trendline. Every time we've had a dip I haven't been worried and will continue to see those dips as bear traps until we close a weekly candle with the blue and orange lines under this trendline or if we flip it to clear resistance...this support line has been by far the best indicator this entire bull run and will very likely continue to be. Look up my other ideas I've posted the past few weeks and you will see just how consistant i has been.

The weekly stochrsi trendline that refuses to bend the kneethroughout the recent bear scare where for a moment it looked like we may finally be seeing the 31%-41% correction anticipated to follow our current parabolic uptrend, the ascending green trendline on our weekly stochrsi has held vigilant support only slightly teasing a peek below it briefly which now there is no longer any trace of. This line has held strong support through the entire 2019 bull run this far and still has 34 days left of which it may continue to hold support...if it does so we may not see the big correction until the end of June. Once we close a weekly candle below this line odds are good that's the signal that the big correction is upon us but we have a chance in the meantime to ride this further up to 9.6 -10k range and possibly even 11k before that correction sets in. So as has been this entire uptrend this trendline still remains the most important one to keep your eyes on to tell whether or not any current dips that are occurring are going to be shortlived or be much more significant. We are still currently rangebound between 7.4k support and 8,5k resistance and until either gets a close above resistance or below support we will remain that way. I think the ascending green trendline shown here will maintain support long enough to carry us up above 8.5 and onward to 9.6

EURAUD Approaching Strong Daily ResistanceLooking for OANDA:EURAUD Shorts. Approaching a very strong resistance zone. RSI and and Stoch RSI are very over bought. Time to fall baby!!

What's keeping us from correcting? Weekly Stochrsi support line.the biggest way most people have been missing out during this bullrun is simply by taking profits expecting a correction thats long overdue but still doesn't come and they end up losing some of their btc positioning and fomoing in a few pips higher up. I think the main reason for this lack of correction is that momentum has been skimming the top of a super strong ascending trendline on the weekly stochrsi for most of this pump as seen here. As I've mentioned about this line in previous ideas it goes all the way back to 2016 and has held both crucial support and resistance several times from then to now. In fact, it looks like it could potentially keep the momentum in the 100 range possibly as long as the end of June before finally having no choice but to break below it. That would be phenomenal and give us still plenty of time to continue upward and test higher ranges like 8k,9k, maybe even 10k before a correction. My chart on the Total crypto market cap from back in February indicated that the whole market would triple to quadruple in value after breaking up out of a huge falling wedge pattern...we are nearing very close to being halfway there so it would no surprise me if somehow his run continues for another month with altcoins joining in with it to hoist the total market cap somewhere close to that breakout target. Of course we could also have the correction as soon as tomorrow too...either way, the easiest way to tell when the correction is about to happen will be when you see the weekly stochrsi finally fall below this strong ascending trendline and then solidify it as resistance. So I will watch it closely and hodl and buy dips until it does.

Support vs Resistance Epic Showdown! 1wk Stochrsi vs 1wk 50mathe 2 big players in that have been battling it out in the charts for the past couple weeks have been this strong weekly ascending trendline on the stochrsi as support and the weekly 50ma(in orange) as strong resistance. It has been a crazy battle one it looked like only a few days ago the weekly 50ma was going to win...but as we touched down on the stochrsi we saw yet another bounce to keep price action fighting the resistance of the 50 weekly and at least for now refusing to back down. If I had to pick a safe spot to try and sell any of my position this would be it with price action touching the underside of the 50week ma still as resistance. I would then put a stop loss auto buy a few pips above here around 5670. Bottom line is what we are looking for is a weekly candle to close above the 50 weekly ma until then probability slightly favors that it will be the stochrsi trendline that breaks first....pay no mind to the random lines just under the weekly 50ma...those are triangle patterns that only make sense on smaller timeframe charts. I may sell a little more here with a tight stoploss auto buy above but we still have over 3 days left in this weekly candle and I think its true direction isn't going to reveal itself just yet until closer to the weekly candle close. one thing to watch until we get closer to that weekly close is the greed fear indicator on bitcin if there is more greed by the time we close the candle we are likely going down...if theres more fear we may actually break above. Lastly, if we do close a weekly candle above the 50 week ma it will be very interesting but it is still not absolute confirmation that we will be continuing upward we always need to show patience and see how the follow up confirmation candle behaves as well as the volume before things are fully confirmed. As of right now though, this stochrsi trendline and the 50 weekly ma are definitely the 2 that are battling it out...we should see who wins by early next week if not sooner.

weekly close brings the weekly stochrsi on btc to the trendlinethis trendline on the weekly stochrsi has been a valid line of both strong resistance and strong support since September 2016... .can it once again hold support and provide a momentum bounce for btc one more leg up? It's plausible but at this point more probable support will break and price action will fall back for a correction...this is one trendline to be keeping a very close eye on for sure the next 2 weeks.

TRXH19: ShortingShort @ 655
overbought rsi on 1h, rsi bearish cross on 1h
double top rejection
expecting a potential wick up towards mid 660's, with a huge red candle coming down -not financial advice-
the other scenario which is likely: green candle up to 700, touch resistance and go down. My liquidation is at 704, so I won't set a stoploss which will stop me out from potential big gains.
This is the kind of trade where it's so obvious it's going down, that I am expecting it to do the opposite thanks to manipulation.

Smells like a fakeout…Looks like a fakeout…Is that the fakeout?Here on the XRPUSD 1day chart we have a pattern of a massive head and shoulders on xrp formed conveniently during a downward trend with a breakdown target of negative 20 cents. The Stoch RSI also bottomed out and is ready to travel upward again so there's not enough bearish momentum available to warrant such a breakdown. The downtrend makes it very unlikely a good head and shoulders because the h&s chart patterns that get validated are usually ones that act as reversal patterns at the top of trends not continuation patterns.Sure there are rare exceptions of when a continuation h&s happens but in reality those are just failed patterns that didnt trigger in my eyes. Still with it looking so obviously like a fakeout it makes one wonder if the whales are trying to fake us out with a fake fakeout...thats the only way I see something like this triggering. On the bitfinex chart this pattern is invalid but It appears to be valid for now on bitstamp,coinbase,and kraken. Its for this fake fakeout fakeout reason that I leave this idea neutral....but with a breakdown target of negative 20 cents, it seems like a ridiculous notion to believe it ever could be anything other than a fakeout.

ETHUSD - Stoch RSI - Ride the TrendI have not tried this for many other pairs but this is working for me with ETHUSD on the 15 min chart. After looking at several indicators, entering in at the wrong times, being in long when I should be in a short or out, the frustration led me to really try to find where the best low to buy into would be, I discovered that if I set the Stoch RSI indicator with the following values and simply buy when the bottom K crosses D and ride the trend to the top and sell (short) when K crossed D at the top, it makes for a nice profit most of the time. Nothing is 100% foolproof when using one indicator so I recommend pairing it with a 1 or more you are familiar with.
Pair: ETHUSD on Kraken (Can short in the US on that exchange currently) Many others are disabling shorting if you reside in the US.
Chart: 15 Min Chart
Indicator: Stoch RSI in Trading View
K 85
D 14
RSI Length 19
Stochastic 125
If you buy in too far away from the crossing, you will be caught in the volatility from my experience. Paper Trade to feel comfortable and so far, when the whale hits, I am in the right direction. I am no financial adviser but simply showing and perhaps saving someone hours of analysis. Note: On a large dump or large move up, this will not buy in outside the Bollinger Bands, but enter in a less volatile and hopefully let you enter without instantly being in a negative. Good luck...

NEO/BTC: Shortterm targets (1H chart)Target 1: 2035
target 2: 1950
bearish crossover on daily stoch RSI, MACD about to turn bearish aswell on the daily. I think we will see even lower prices than 1950. *not financial advice*

Dash ripe for a rebound; Potential inverted head and shouldersDash is experience a nice big green daily candle today which has allowed price action to climb back above the 1 day 50ma(in orange) We can see we also seem to be completing the right shoulder of an inverted head and shoulder pattern. I'm looking for a minor retrace here that retests the 1 day 50ma multiple times and keeps finding support there... if this occurs I will know that the 50ma(aka buy/sell line) has become solidified support thats when I will likely buy back in and then make my next decision at either the neckline of the inv h&s or if I see the price action somehow dip back below the 50ma and close 3 consecutive candles underneath it or solidify resistance. Judging by how the stochrsi on the daily is bottomed out and looks like it wants to start heading back upwards I'd say probability favors solidified support at the 50ma. Just my strategy of course if you are looking for financial advice you will have to go somewhere else as this is just my opinion. Thanks for reading!


BTC - Bullish Divs indicates bounce SOON !!!Bitcion Daily chart shows Bullish Divergences on RSI, Stoch RSI and Momentum.
Same Story for Ethereum too.

inverted head & shoulders pattern on the btcusd 4hr chart This inverted head and shoulder has a disproportionately long left shoulder but it is still valid we are currently testing the neckline. Judging by how overextended the stochrsi is on the buy side on the 4hr chart there are decent odds that this could be rejected here at the neckline but I'm pretty certain on the 1 day stochrsi we are in the oversold territory still so it may just break up from here...I'm gonna wait until I see a clear rejection and solidified resistance from the neckline before I exit my position if I had already sold before this then I would simply wait for a break above the neckline to turn into solidified support before buying back in. My personal strategy and not any sort of financial advice of course..good luck and thanks for reading!

BTCUSD short term trade after confirmation.An ascending triangle is formed in the 1 hour chart.
However, MACD shows that a possible bearish divergence could happen.
Still waiting for confirmation
Disclaimer: this is not a financial/trading advice.
Good luck to you all!

XRPUSD Pair about to trigger a gldncross on the 1 day & inv h&sTake a look at this picture perfect inverted head and shoulder setup on xrpusd's 1 day chart. Also take a look at how close the 50ma(in orange) is to rising above the 200ma(in blue) for a 1 day golden cross. Now factor in how the stoch rsi indicator has plenty of room to head upwards and is already suggesting its ready to do so. Lastly, factor in that we have already triggered a golden cross and inverted head and shoulder breakout on the xrpbtc pair...the golden cross on the xrpbtc pair has been sustained and didnt become a fakeout which is leading to huuuge leaps and gains over ethereum and btc...all this considered means the golden cross on the xrpusd pair should be sustained with similar results as well. While the rest of the crypto market has been in a free fall..XRP hs held steady making those gains against btc. Yet it hasn't been able to break out of the 48 cents-50cent range yet...once it sustains the golden cross on the usd pairing however we will definitely see it start to make 50-100% gains. First resistance will be back at the inv h&s neckline at 54-55 cents....once we break up from there the next target is the 75 cents range. This is of course just my opinion though so don't take it as financial advice for a financial advisor I am not. Thanks for reading!!
