TANTALIZER LONG IDEATANTALIZER stock is looking promising. There was a bullish divergence on the awesome oscillator (daily timeframe), which was followed by a bullish change of character. This is a confirmation that the stock is ready to go higher. Price has recently dropped to the demand zone confluenced with trendline and support level, which is a good point to take a long position. After mitigating the demand zone, there was a rejection showing that buyers are willing to push price higher.
To take advantage of this long opportunity, one can buy at the current market price. The first target is N2.99 (24.58%) and the final target is N3.45 (43.75%). The stop can be at 2.10 (-12.50%).
Confluences for the long idea:
1. Bullish market structure
2. Trendline
3. Awesome oscillator divergence
4. Rejection candle
5. Support level
Disclaimer: This is not a financial advice. The outcome maybe different from the projection. Don't take the signal if you're not willing to accept the risk.
Stockanalysis

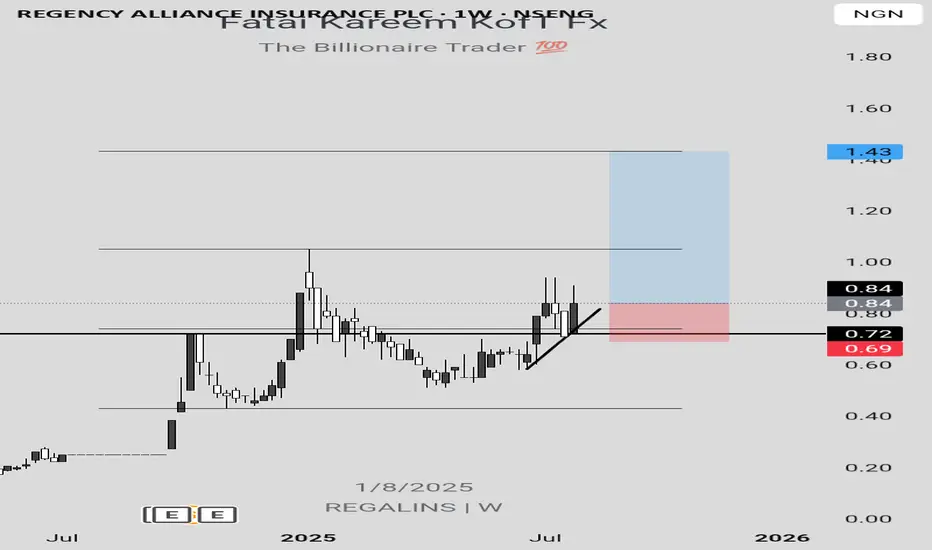
REGALINS LONG IDEA REGALINS stock is yet to take out the recent high which is the target for the current move. Hence, this serves as a long opportunity as confirmed by the bullish engulfing candlestick formation after testing resistance turned to support level. To take advantage of this long opportunity, one can buy at the current market price. The first target is N1.05 (25%) while the final target is N1.43 (70.24%). The stop can be at N0.69 (17.86%) below the support level.
Confluences for the long idea:
1. Bullish engulfing candlestick confirmation
2. Resistance turned to support level
3. Bullish market structure
4. Trendline
Disclaimer: This is not a financial advice. The outcome maybe different from the projection. Don't take the signal if you're not willing to accept the risk.
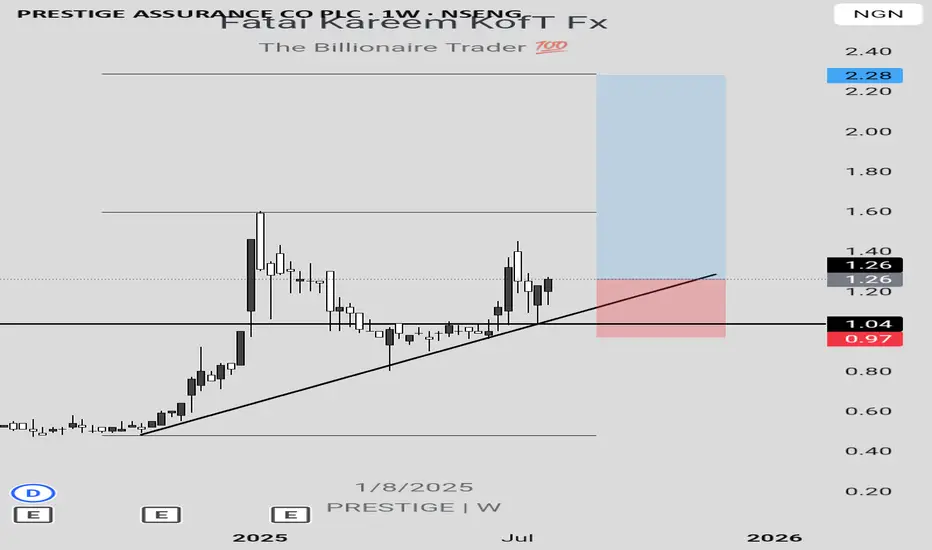
PRESTIGE LONG IDEA PRESTIGE stock has presented a long opportunity after coming from a support level and trendline. The 2 bullish weekly candles are strong indications that buyers are willing to push price higher. To take advantage of this long opportunity, one can buy at the current market price. The first target is N1.59 (26.19%) while the final target is N2.28 (80.95%) based on 1.618 Fibonacci level. The stop can be at N0.97 below the support level and trendline.
Confluences for the long idea:
1. Strongly buying momentum
2. Support level
3. Trendline
4. Bullish market structure
Disclaimer: This is not a financial advice. The outcome maybe different from the projection. Don't take the signal if you're not willing to accept the risk.
NSLTECH LONG IDEANSLTECH stock presents a long opportunity based on the market structure, support level and trendline. To take advantage of this long opportunity, there are different approaches. An aggressive approach is to buy at the current market price since price is in the discount level. Then, add more long positions when price gets to the support level around N0.60 and N0.57. While a conservative approach is to wait for price to get to the support level and give a candlestick confirmation before entering a long position. The stop can be at N0.45 (23.73%) while the final target is N1.33 (125.42%).
Confluences for the long idea:
1. Bullish market structure
2. Trendline
3. Support level
4. Discount level.
Disclaimer: This is not a financial advice. The outcome maybe different from the projection. Don't take the signal if you're not willing to accept the risk.

GUINEAINS LONG IDEA GUINEAINS stock presents a long opportunity based on trendline and support level. To take advantage of this opportunity, there's a need to wait for price to drop to the support level around N75 and N73. An aggressive approach is to enter a long position at that price while a conservative approach is to wait for a candlestick confirmation such as bullish engulfing or hammer. The last high around N1.23 (68.49%) can be the target while the stop can be around N0.57 (21.92%).
Confluences for the long idea:
1. Bullish trendline
2. Support level
3. Bullish market structure.
Disclaimer: this is not a financial advice. The outcome maybe different from the projection. Don't take the signal if you're not willing to accept the risk.

BAJAJFINSV BUY PROJECTION Bajajfinsv - Buy View
Trade Setup :
Monthly - Strong Support and FIB 0.786
Weekly - Symmetric Triangle Breakout
Day - Higher High Formed (Uptrend)
Entry - Aggressive Trader(Entry Now)
Conservative Trader - 1588 Rs
Target 1 - 1925 Rs
Target 2 - 1971 Rs
Stoploss - 1514 Rs
Expected Return - 20 %

OIL INDIA BUY VIEW OIL INDIA - BUY PROJECTION
Trade Setup :
Fundamental Analysis
Stock PE - 9.22
Industry PE - 20.7
Low Debt
Promoter Holding - 53 %
DII Holdings - 17 %
Regularly Paid Dividend - 2 %
Strong Fundamental - Stock Possible to Doubled - (Current - 474 ) (Target - 948 )
for Long term 5 years Holding ..
Technical Analysis
Monthly - Strong Support & Fib 50 %
Day - Wait For Candle Close in Black Line
Entry - 507 Rs
Target - 740 Rs
Stoploss - 408 Rs
Happy trading .. Thank You ...

A life-changing SBET long ideaSBET stock presents an amazing long opportunity that has a potential to do over 100x. After the break out of a down trend line, price retraced to the support, with price closing above this support level.
To advantage of this long opportunity, you can buy from the current market price while the exit can be at $1.34 and the targets can be at $123.70, $178.48, $541.22, $1041.90 and the final target at $2155.20.
Confluences for the long opportunity are as follows:
1. Break out of down trendline
2. Retest of the down trendline and support level.
3. Bullish divergence signal from awesome oscillator.
Disclaimer: This is not a financial advice. The outcome maybe different from the projection. Don't take the signal if you're not willing to accept the risk.

GME LONG IDEA UPDATEDIn my previous post regarding the long opportunity on GME stock, I called a long signal after a break out of a downtrend line. However, price had dropped down to the demand zone, giving another long opportunity.
To take advantage of this long opportunity, you can buy at the current market price, while the exit will be at $20.30 and the targets can be at $35.70, $47.90 and the final target at $64.70.
Confluences for the long idea are as follows:
1. Weekly break of structure
2. Valid Inducement
3. Orderflow
4. Price within the discount
5. Price respecting bullish trendline
6. Hammer candlestick confirmation
7. Price at a support level
Disclaimer: This is not a financial advice. The outcome maybe different from the projection. Don't take the signal if you're not willing to accept the risk.

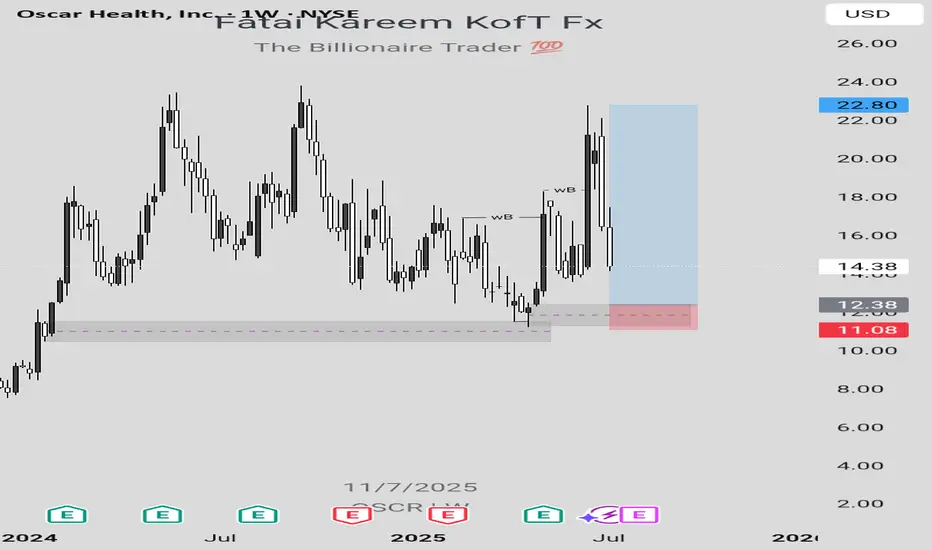
OSCR LONG IDEALooking at the weekly chart of OSCR stock, there's a long opportunity which can be taken advantage of to make some money provided that market follows the projection.
In order to take advantage of this long opportunity, a buy order limit can be placed at $12.38 while the exit can be at $11.09 and the final target can be at $22.80.
Confluences for this long idea are as follows:
1. Weekly break of structure
2. Valid Inducement (structural liquidity)
3. Orderflow
4. Sweep
5. Valid demand zone in the discount level
6. Imbalance
7. Pattern confirmation formed after mitigation of a demand zone indicating that there's a bullish change of trend.
Disclaimer: This is not a financial advice. The outcome maybe different from the projection. Don't take the signal if you're not willing to accept the risk.
DANGSUGAR LONG IDEARecently, the price of DANGSUGAR stock has broken out of a bearish trendline with a strong bullish weekly candle. This shows a strong intention to continue the buying momentum. To take advantage of the long opportunity, you can buy at the current market price while you can also wait for price to drop to N42.95. The stop can be at N37.70 while the target are N47.85 and N63.50 (final target). If this zone should fail, then the next long opportunity will be at N33.50 with a stop at N30.35 based on market structure.
Confluences for the long idea:
1. Trendline and resistance breakout with a strong bullish weekly candle.
2. Strong volume momentum on the volume indicator.
3. Market structure is bullish.
Disclaimer: This is not a financial advice. The outcome maybe different from the projection. Don't take the signal if you're not willing to accept the risk.

FIDELITYBK: HOLD OR SELL?FIDELITYBK is running up towards its target after mitigating a valid demand zone within the discount level at a price of N17.25. If you have this stock in your portfolio, it's a good idea to hold the stock as it has a potential to go as high as N24.95. Although, the weekly swing high is the actual target, which is at a price of N21.55. Afterwhich, a drop in price is anticipated in order to create another long opportunity. Nevertheless, with the market structure being bullish, it's a good idea to ride on the higher prices that can be created in a bullish market.

PayPal: Rebound or Rerun?PayPal in 2025: A breakout with backbone or just another spineless fintech?
PayPal is still in the rehabilitation ward after its fall from grace in 2021. Management drama, growth slowdown — the full fintech fatigue package. But something has shifted behind the scenes. A new CEO is cutting costs, AI integration is being whispered about, and earnings have started to surprise again. Wall Street pretends not to notice — but volume tells a different story.
Technically, we’re looking at a well-formed inverse head and shoulders. The neckline stretches from $72.00 to $74.76, aligning with the 0.5 Fibonacci level. A confirmed breakout above this zone opens the path to a clear target at $93.66 — the 1.0 Fibonacci extension. Multiple EMA clusters and strong pattern symmetry reinforce the setup. But no fairy tales here: the real entry comes after a retest. Without confirmation, it’s just another pretty formation for chart enthusiasts.

WHAT'S THE FATE OF INTEL CORPORATION STOCK?From the perspective of technical analysis, INTC is approaching a key psychological level at $19. In addition, it's in a downtrend. If the key level should hold by pushing price higher, leading to a break out of the downtrend line and closing with a strong bullish candle above the down trend line and resistance level around $22, this will indicate a strong bullish signal. Likewise, this is supported by a bullish divergence signal from the awesome oscillator. Otherwise, a failure of the psychological level of $19 may lead to price dropping further.
Furthermore, we need to look beyond technical analysis. Fundamental analysis also has some insights for our decisions.
Fundamentals for INTC established a bearish bias. The summary is as follows:
Financial Health:
• Negative EPS (-$4.47): Intel is losing money.
• High Debt ($50B): This can limit growth and increase risk.
• Declining Revenue: Sales dropped from $80B (2021) to $51B (2024).
Valuation:
• Cheap P/S (1.66x), but no P/E (due to negative earnings).
• Dividend yield (2.56%) is at risk of being cut.
Sentiment:
Stock price fell from $56 to $19.55 (65% drop). Institutional investors may be wary.
Fundamentally, INTC is weak — best suited for speculative, long-term bets (if you believe in a turnaround).
Strategy for Traders:
1. Conservative Approach:
- Wait for:
- Break out of downtrend line and resistance around $22 and positive earnings/news.
- Rising volume to confirm momentum.
- Target: $27–$30
- Stop-loss: Below $17 (apply proper risk management).
2. Aggressive Approach:
- Buy near $18–$19 with tight stop-loss ($16).
- Target resistance level at $22.
3. Avoid If:
- You’re risk-averse or prefer stable companies.
- Intel’s debt/revenue trends worsen.
Note:
- Short-Term Trade: Only if breakout confirms ($22+). High risk, but possible 20% bounce.
- Long-Term Investment: Avoid unless Intel shows profit/debt improvement.
Always use stop-losses —Intel’s fundamentals make it volatile.
Disclaimer: This is not a financial advice. The outcome maybe different from the projection. Don't take the signal if you can't accept the risk.

WHAT'S THE FAITH OF INTEL CORPORATION STOCK? From the perspective of technical analysis, INTC is approaching a key psychological level at $19. In addition, it's in a downtrend. If the key level should hold by pushing price higher, leading to a break out of the downtrend line and closing with a strong bullish candle above the down trend line and resistance level around $22, this will indicate a strong bullish signal. Likewise, this is supported by a bullish divergence signal from the awesome oscillator. Otherwise, a failure of the psychological level of $19 may lead to price dropping further.
Furthermore, we need to look beyond technical analysis. Fundamental analysis also has some insights for our decisions.
Fundamentals for INTC established a bearish bias. The summary is as follows:
Financial Health :
• Negative EPS (-$4.47): Intel is losing money.
• High Debt ($50B): This can limit growth and increase risk.
• Declining Revenue: Sales dropped from $80B (2021) to $51B (2024).
Valuation:
• Cheap P/S (1.66x), but no P/E (due to negative earnings).
• Dividend yield (2.56%) is at risk of being cut.
Sentiment:
Stock price fell from $56 to $19.55 (65% drop). Institutional investors may be wary.
Fundamentally, INTC is weak — best suited for speculative, long-term bets (if you believe in a turnaround).
Strategy for Traders:
1. Conservative Approach:
- Wait for:
- Break out of downtrend line and resistance around $22 and positive earnings/news.
- Rising volume to confirm momentum.
- Target: $27–$30
- Stop-loss: Below $17 (apply proper risk management).
2. Aggressive Approach:
- Buy near $18–$19 with tight stop-loss ($16).
- Target resistance level at $22.
3. Avoid If:
- You’re risk-averse or prefer stable companies.
- Intel’s debt/revenue trends worsen.
Note:
- Short-Term Trade: Only if breakout confirms ($22+). High risk, but possible 20% bounce.
- Long-Term Investment: Avoid unless Intel shows profit/debt improvement.
Always use stop-losses —Intel’s fundamentals make it volatile.
Disclaimer: This is not a financial advice. The outcome maybe different from the projection. Don't take the signal if you can't accept the risk.

WATCH OUT FOR VERITASKAPFrom around 0.83, VERITASKAP created an all-time high of around 1.81. This happened between August 2024 and September 2024. Then, price dropped into the discount level where is currently. The current price action shows that price is in a discount level, at a demand zone and within a falling wedge.
From a chart pattern perspective, falling wedge can be seen on the chart and a break out of the downtrend and resistance level around 1.06 with a bullish candle closing above these levels will serve as a strong indication that the stock is ready to rally up as much as the all-time high.
From a technical indicator perspective, awesome oscillator is below 0, showing that the stock is oversold. In addition, there is a bullish indication on the awesome oscillator as shown by its colour and upward movement. This is pointing to the fact that the value of the awesome oscillator is moving towards 0 and can cross over it which can be a good indication for a rise in price as well.
From a smart money concept perspective, a break of the last high (around 1.27) that led to the last bearish internal break of structure will as serve as indication of a bullish trend. Hence, the target will the all-time high.
Either way, the stock has a good potential. An aggressive trader or investor may buy at the current market price. While a conservative trader or investor may wait for a breakout.
Watch out for the confluences indicating potential rise in price so as to not miss out on the benefit.

NEM SHORT IDEANEM Insurance stock is ready to have a drop. There's a bearish divergence signal from the awesome oscillator showing that there's a high tendency for the price of the stock to drop as much as to 11.65 and below that value. Any value below 11.50 is the discount level where there can be a potential for the next long opportunity.
Looking at the past data, some patterns were revealed. In September 2016, there was a bearish divergence signal and the price dropped from around 3.71 to around around 1.51. Likewise, in September 2022, there was a bearish divergence and the price dropped from around 5.65 to around 3.71. Similar pattern is what is repeating itself showing that there's a higher probability that the price dropped into the discount level. For an investor holding this stock, this maybe a signal to sell and wait for another long opportunity. For a trader, it's an opportunity to short the stock, targeting the discount price around 11.65.
Confluences for the short signal:
1. Price is showing higher high while awesome oscillator is showing lower high indicating bearish divergence.
2. When similar patterns occured in the past, price dropped into the discount level.
3. A bearish engulfing candlestick had been formed showing that price is likely going to drop further.
Disclaimer: This is not a financial advice. The outcome maybe different from the projection. If you can't accept the risk, don't take the signal.

NASCON LONG IDEA CONTINUATIONNASCON stock reached its all time high value of around 77 in January 2024. This happened after a bearish divergence signal from the awesome oscillator. Then, it dropped into the discount level. After which a bullish divergence signal was given, followed by a breakout. Since that breakout, price has been going up and rally for the all-time-high value. The first long opportunity could have been in November 2024 when the price was around 30. The next opportunity was when the price was around 44. Then the next opportunity was when price was around 54. Joining the rally now is not too late since the stock has a potential to hit 77.
Confluences for the long idea
1. Price was coming from the discount level.
2. Price broke out of a down trend line.
3. Price has been rally after a bullish divergence signal given by the awesome oscillator.
4. Bullish engulfing candlestick was formed recently after breaking a key level.
Disclaimer: this is not a financial advice. The outcome maybe different from the projection. If you can't accept the risk, don't take the signal.

RT BRISCOE PLC LONG IDEART BRISCOE PLC stock, after reaching its all time high, dropped to discount level. Currently, it has broken out of down trend line with a strong weekly bullish candle closing above a the down trend line and resistance level. The awesome oscillator is also in the oversold region with a bullish signal. An aggressive trader or investor can buy at the current price while a conservative trader or investor may wait for a drop to around 2.20 and 2.30 to place a buy. While you can also so spread your risk by buying at the current market price and add more positions when price drop towards the resistance turned support.
The entry is at the current market price or buy at 2.20 while the stop can be at 1.73 and the target can be around 2.90 and 4.30.
Confluences for the long signal:
1. Price is in discount level
2. Price broke out of a down trend line and resistance level with a strong bullish candle.
3. Awesome oscillator is in oversold region and showing bullish signal.
Disclaimer: this is not a financial advice. The outcome maybe different from the projection. If you can't accept the risk, don't take the signal.

Gold Fields Limited $GFI: A Golden Opportunity in 2025? Gold Fields Limited ( NYSE:GFI ): A Golden Opportunity in 2025? 🏅💰
1/10
Gold production at NYSE:GFI declined 4% to 2.30 million ounces in 2023, but the company's All-In Sustaining Costs (AISC) stayed strong at US$1,295/oz, beating expectations. Stable cost control is key here. 📉 Can gold prices lift revenues?
2/10
Gold Fields' Salares Norte project is set to ramp up production in 2025. Investors see potential— NYSE:GFI rose 4.1% on Feb 3, 2025, closing at $17.63. Optimism is brewing. 🌄 Will Salares Norte be a game-changer?
3/10
Gold stocks are heating up! NYSE:GFI is outperforming peers like Harmony Gold and AngloGold Ashanti in 30-day returns. Yet analysts hold a neutral "hold" rating. 🏆 Are they underestimating future upside?
4/10
Gold Fields is focused on high-grade gold projects while controlling costs. Market valuation may not yet reflect its potential gains if gold prices keep rising due to inflation and geopolitical tensions. 📊
5/10
But there are risks... Gold price volatility remains a double-edged sword. Economic conditions, inflation, and sentiment can drive sharp swings in gold demand and prices. ⚖️ Can NYSE:GFI weather these storms?
6/10
Strengths: Gold Fields boasts efficient cost management and diversified operations across multiple countries. Geographic diversification helps mitigate risks tied to any single government or policy change. 🌍
7/10
Weaknesses: High capital expenditures for projects like Salares Norte could weigh on short-term cash flow. Plus, Gold Fields has limited growth prospects outside current regions. 🏗️ How fast can expansion pay off?
8/10
Opportunities: The Salares Norte project is a major catalyst. If successful, it could significantly boost production and revenue. Rising gold prices further enhance this outlook. 🚀
9/10
Threats: Delays or operational hiccups at Salares Norte could derail projections. Global economic downturns might also reduce investor appetite for gold. 🛑 Can GFI stay on track?
10/10
What’s your take on Gold Fields Limited NYSE:GFI ? Will it shine or stumble in 2025? Vote below! 🗳️
Golden buy opportunity 🏆
Hold for now 🔄
Too risky, avoid ⚠️

Barrick Gold Corporation ($ABX): Golden Opportunity or Risky
Barrick Gold Corporation (ABX): Golden Opportunity or Risky Prospect? 🏆💰
1/10
Barrick Gold TSX:ABX has seen a solid financial performance recently. EPS for the last quarter hit C$0.42, with next quarter estimates at C$0.63. They beat estimates 75% of the time in the past year. 📈
2/10
Analysts are bullish! The average price target is C$33.57, implying a potential upside of 50.13% from the current C$22.36 price. Strong Buy ratings dominate: 10 Buy, 2 Hold. 🔍 What do analysts know that the market doesn’t?
3/10
However, ABX is facing operational challenges. A suspension in Mali due to government intervention highlights geopolitical risks in mining. 🛑 Regulatory challenges are part of the gold mining game.
4/10
Stock price check: ABX currently trades at C$23.15. That’s 20.94% below its 52-week high of C$29.28 but 21.59% above its low. What does this tell us? Room for recovery, but risks loom. 📊
5/10
Valuation time! Compared to sector peers, Barrick offers an attractive price level, especially given the 50% upside target. Analysts love undervalued plays like this, but what about the risks? 🤔
6/10
Strengths: Barrick operates across multiple countries, ensuring diversified production. That’s crucial in a volatile gold market. 🌍 Diversification is a key defensive strategy here.
7/10
Challenges: High operational costs are always a concern. Pair that with political instability, like the Mali suspension, and ABX faces a steep uphill climb. 🏔️ How much risk are you willing to take on?
8/10
Opportunities: Expansion is always on the table. With gold prices looking stable, Barrick could capitalize on new projects or mines. But timing matters in this market. ⛏️
9/10
Threats: Regulatory and political risks never sleep. Changes in mining laws or political unrest can hit Barrick hard—Mali’s situation is a prime example. Always know your risks. ⚠️
10/10
What’s your take on Barrick Gold TSX:ABX ? Will it strike gold again? Vote here! 🗳️
Buy for the long term 📈
Hold and watch growth 🔄
Too risky, avoid 🚫

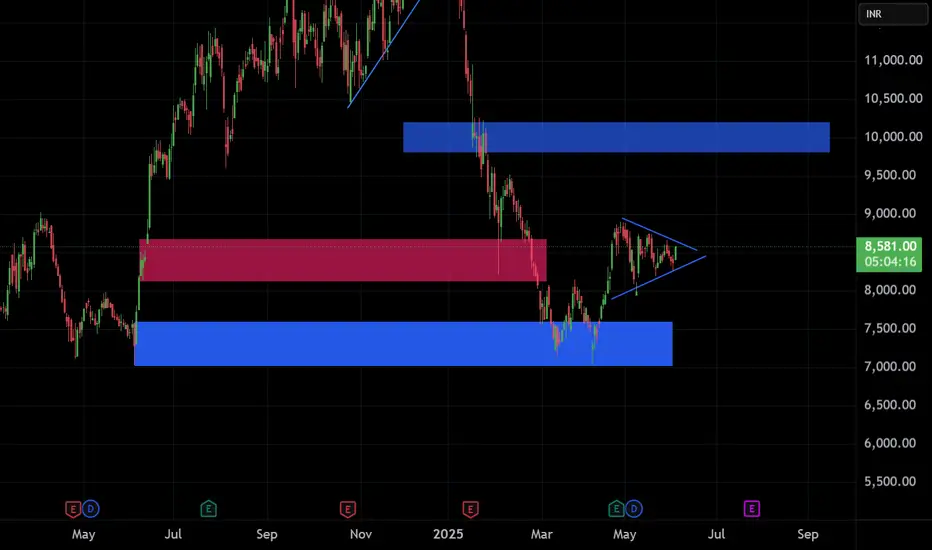
TBO TEK LTD – 19 May Trendline Resistance Test Incoming 📌 Trade Plan (Aggressive Swing Setup):
Buy above: ₹1,250 (on breakout + volume confirmation)
Stoploss: ₹1,195
Target 1: ₹1,310
Target 2: ₹1,385
Sell Below: ₹1,180 (if price rejects the trendline with high volume)
🔎 Technical Insights:
Strong volume buildup near resistance
RSI trending upwards with bullish momentum
Trendline acting as dynamic resistance since Nov 2024
For Education Purposes Only
