Is TSLA setting the tone!Bulls found some sort of solidarity in the FEDs minutes today. And showed it with a strong stance by buyers closing the day with strength and displaying the majority will of todays retailers. And their desire to reap profit from this shopping season .
We need to consider that the big institutions where not actively trading today. And yet Volume on some stocks did not decline by much.
Question can this be a definitive stance?
Or a retest of resistances in $184 and $187 since we are still in a macro Bear trend.
Bear will attempt a stance at $183 but if a Daily open is above this price they will not be able to hold and I would be looking for $187 and $190 for next targets.
A rejection of $183 will be decided between $181 and $180 with potential selloff if Buyers are unable to keep price above $180
Stockanalysis

S&P500 - The Maker Of Kings (and bull runs) 👑After one of the biggest rallies since 2020, we take a look at the SP500 Daily chart.
We've thrown on our US equity gap & stock market breadth indicator to show some potential price targets.
It’s looking like we might be after the 4100 gap before falling to the 3400 gap.
The breadth indicator buying (bottom indicator in screenshot) hit numbers similar to 2020 during Covid crash/rebound. Which could drive us back up to 4100 IF the bulls keep showing up like they did today. 🐂
If 4100 is on the way first, then the bears need to come back in hard to drive to new lows.
Until Fed comes in to save the day & money printers are engaged, I don’t think we’ve seen the worst of it.
Right now they’re still slow controlling the bear market. Still waiting for an “event” or “oh boy moment” to pull the rug.
We shall see. Stay safe & eyes peeled!
-TucciNomics
Chief Overlord, AlgoBuddy

PAYPAL HOLDING Short PositionWe expect that the price will decrease to the support level gradually. After rising wedge broke down, the Heikin Ashi candles show us that the price started to decrease. Moreover, MACD and DMI indicate that the price will decrease. Further, Divergence for many indicator shows us that 102 resistance level was selling time.
Entry, stop-loss, and target levels are in the chart.

GRANULES INDIA Rectangle Pattern Breakout*GRANULES INDIA*
Time Frame: Daily
Observation:
* Rectangle Pattern Breakout
* Swing High Break
Resistance/Target: 362 396 428
Support: 295 273

SPX Daily TA Cautiously BearishSPXUSD daily guidance is cautiously bearish. Recommended ratio: 20% SPX, 80% Cash.
* BOUNCE WATCH . Equity Indexes and Equity Futures are down, as are Commodities, GBPUSD and EURUSD... meanwhile DXY, US Treasuries, VIX and Cryptos are up. Interestingly, Cryptos have been defiant recently in the sense that they have held key supports in what can be seen as an attempt to decouple from Equities that have continued to crash as DXY keeps pushing higher. Though decoupling sounds nice in theory, until it is confirmed this is likely a delayed reaction for Equities considering that Ethereum fell ~80% from its ATH and SPX has fallen ~25% from its ATH. Key Upcoming Dates: September US Consumer Confidence Index at 10am EST 09/27 ; August US New-Home Sales at 10am EST 09/27 ; 14th GDPNow US Q3 GDP estimate at 10am EST 09/27 ; Final US Q2 GDP revision at 830am EST 09/29; August US PCE price index at 830am EST 09/30.*
Price is currently trending down at ~$3660 as it risks losing $3707 minor support, if it can't bounce here then the next support (minor) is at $3516. Volume is currently Low and on track to favor sellers for a fifth consecutive session if it closes today in the red. Parabolic SAR flips bullish at $3945, this margin is mildly bullish. RSI is currently trending down at 27.25 and is still technically testing 28.63 minor support as well as the uptrend line from August 2015 (32). Stochastic remains bearish and is currently attempting to complete a trough formation at max bottom. MACD remains bearish and is currently trending down at -92.25 as it's still technically testing both -76.22 minor support and the uptrend line from August 2015 (~-82) as support. ADX is currently trending up at 25 as Price continues to fall, this is bearish.
If Price is able to bounce here it will have to close above $3707 minor support for it to potentially retest the lower trendline of the descending channel from August 2021 at ~$3800 as resistance . However, if Price continues to fall here then it will likely retest $3517 minor support for the first time since November 2020. Mental Stop Loss: (two consecutive closes above) $3707.

SPX Daily TA Cautiously BearishSPXUSD Daily guidance is cautiously bearish. Recommended ratio: 15% SPX, 85% Cash.
* BOUNCE WATCH. Equities and Futures continue to plummet after a hawkish FOMC meeting has investors bracing for more rate hikes in 2023. Meanwhile, Commodities, Cryptos, DXY, EURUSD, VIX and US Treasuries are either up or flat. Very 2022. Unfortunately, with Putin's latest recruitment efforts and nuclear/chemical warfare posturing it's starting to feel like that time when Russia/Ukraine headlines may another run at being market catalysts. Key Upcoming Dates: S&P US September Manufacturing PMI at 945am EST 09/23; September US Consumer Confidence Index at 10am EST 09/27; August US New-Home Sales at 10am EST 09/27; Final US Q2 GDP revision at 830am EST 09/29; August US PCE price index at 830am EST 09/30.*
Price is currently trending down at ~$3767 as it risks breaking down out of the descending channel from August 2021 at ~$3825 if it's unable to stop going lower in today's session. Volume is currently Moderate and on track to favor sellers for three consecutive sessions if it closes today in the red. Parabolic SAR flips bullish at $4025, this margin is mildly bullish at the moment. RSI has officially broken below the uptrend line from 01/27/22 and is currently testing the uptrend line from August 2015 at 32 as support, the next support (minor) is at 28.63. Stochastic remains bearish and is currently trending down at 5 as it approaches max bottom with no signs of trough formation. MACD remains bearish and is currently trending down at -68 as it approaches -76.22 minor support which will likely coincide with a retest of the uptrend line from March 2020 (when the Fed started QE and 0%-0.25% FFR) at ~-78. ADX is currently trending up at 22 as Price continues to fall, this is mildly bearish; should ADX get above 25 and Price continue to go down, this would be very bearish and would increase the likelihood of a retest of $3500 minor support for the first time since November 2020.
If Price is able to resist going any lower in today's session and then follow that up with a Bullish Engulfing Candle in tomorrow's session, then it will likely test the lower trendline of the descending channel from August 2021 at ~$3825 as resistance . However, if Price continues selling off, it will likely retest $3707 minor support . Mental Stop Loss: (two consecutive closes above) $3825.

US500 | The Bearish Volume Is High! Further Decline Is ExpectedUS500 | The Bearish Volume Is High! Further Decline Is Expected
After the price tested the resistance trend line in August 16, 2022, we saw that the sellers
gained the price control again.
Yesterday's price broke down the daily support area of 3890
The price looks headed down now and immediate support will be found near 3784, 3723 and 3655
The market is pricing in the next FOMC decision which will be on September 21st.
Thank you and Good Luck!

O-I Glass, Inc. Direction is down.Weekly technical indicators
RSI(14) 46,756 Neutral
STOCH(9,6) 50,797 Nötr
STOCHRSI(14) 36,376 Sell
MACD(12,26) -0,020 Sell
ATR(14) 1,3104 Less Volatility
ADX(14) 20,816 Sell
CCI(14) -80,2280 Sell
High/Lovs(14) 0,0000 Neutral
UO 47,885 Sell
ROC -9,153 Sell
WilliamsR -56,522 Sell
BullBear(13) -0,7380 Sell

GE | General Electric | Potential Inverse Head & ShouldersGE | General Electric | Potential Inverse Head & Shoulders
General Electric is showing the potential for an "Inverse Head & Shoulder Pattern"
The price should bounce above $81 in order to confirm
this pattern.
Targets:
🎯 95.61
🎯 102.58
🎯 114.73
Thank you and Good Luck!
PS: I know that the economy may face a recession soon so let's say out of this topic😂
I am discussing only the technical perspective and what I see on the charts:)

SPX Daily TA Cautiously BearishSPX Daily cautiously bearish. Recommended ratio: 15% SPX, 85% Cash.
* BOUNCE WATCH . Equities and Cryptos continue to sell off in favor of DXY and US Treasuries as Russia halts the Nordstream natural gas pipeline indefinitely (renewing fears of a brutal European winter energy crisis). Key Upcoming Dates: 10th GDPNow US Q3 GDP Estimate at 830am EST 09/07 ; 6th Beige Book at 2pm EST 09/07 ; August CPI at 830am EST 09/13; The Merge (Ethereum) at 8am EST 09/14; FOMC meeting 09/20-09/21 (Statement Released at 2pm EST on 09/21).*
Price is currently trending down at ~$3908 as it risks losing $3938 minor support; the next support is the lower trendline of the descending channel from August 2021 at ~$3875. Volume is currently Moderate (high) and is on track to favor sellers for a second consecutive session if it closes today in the red; if this happens then sellers will have dominated six of the last seven sessions. Parabolic SAR flips bullish at $4065, this margin is mildly bullish at the moment. RSI is currently trending sideways at 35 after being rejected by the uptrend line from 01/27/22 as resistance at 38 resistance, the next support is the uptrend line from August 2015 at ~31. Stochastic remains neutral and continues to trend sideways at max bottom for what is now seven consecutive sessions. MACD remains bearish and is currently trending down at -36 with no signs of trough formation, the next support is at -44. ADX continues to trend sideways at 24 for a twelfth consecutive session as Price continues to see selling pressure, this is neutral at the moment.
If Price is able to bounce here then it will have to turn $3938 minor resistance back to support before it can continue higher to retest the 50 MA as resistance at $4k psychological resistance . However, if Price continues to break down here, it will likely retest the lower trendline of the descending channel from August 2021 at ~$3875 as support . Mental Stop Loss: (two consecutive closes above) $3938.

AAPL , Advanced Trade Setup - Apple Spread Option AnalysisFor Monday, Aug. 8th
📉 We are looking to position ourselves into Apple (AAPL) for short term DOWNSIDE MOVEMENT.
- We will be most likely Selling Calls to benefit from this position. We would also consider a Bear-Call Spreads, or Bear-Put Spreads.
(These are types of
spread options, sometimes referred to as Vertical Spreads, and Credit/Debit Spreads. If you have never heard of these, they are similar
to options, but lower risk with a set max profit. These differ from traditional Calls & Puts, by not needing to move for them to close
successfully. If we use apple as an example, we are going to do a Bear-Call Spread for $164, with a day expiration. If apple is $164 on
the dot, or less we close the trade with max profit.
- 👨🏼🏫 These Spreads, both the Bear-Put & Bear-Call are placed the same way. You will sell a Put or Call for the lower stock value, and at
the same time buy a Put or Call respectively, for the higher value stock price.) For this route, we are doing a
Bear- Call Spread for August 26, for $162.5 - $165. ❗We will be closing the position, or putting a Stop-Loss to
close in profit once the trade is at %50 ROI
- For those deciding to go the Option Puts, we suggest going 30 days out, @ $162.5-$165 Strike. We suggest reading below and considering why
an expiration up to 45-60 days away could lead to more profit if taking the Traditional Put route .
🛣️ For our route, we will be SELLING CALLS for the Strike Prices of $165 & $ 162.5, both EXPIRING August 26th .
📋 BREAKDOWN
We feel that AAPL will be peaking and rounding out this weekend. We can see this happening Wednesday-Friday, but we are so confident in this trade succeeding, we will be putting half our position in on Monday.
Apple we think has a high probability to fall a minimum of 4.8% over the next 3 weeks, with it initiating this week.
With September being the worst trading month of the year, we can see this precipitating well longer than the 5 weeks we stated, and going further than our nearly 5 % predicted drop.

Apple Advanced Trade Setup , AAPL Options Analysis📉 We are looking to position ourselves into Apple ( AAPL ) for short term DOWNSIDE MOVEMENT.
- We have SOLD Calls to benefit from this position.
🛣️ For our route, we will be SELLING CALLS for the Strike Prices of $165 & $ 162.5, both EXPIRING August 26th .
- For those deciding to go with Option Puts, we would go 30 days out, @ $162.5-$165 Strike. We suggest reading below, and considering why
an expiration up to 45-60 days away could lead to more profit, if taking the Traditional Put route.
📋BREAKDOWN
We feel that AAPL will be peaking and rounding out this weekend. We can see this happening Wednesday-Friday, but we are so confident in this trade succeeding, we will be putting half our position in on Monday.
Apple we think has a high probability to fall a minimum of 4.8% over the next 3 weeks, with it initiating this week.
With September being the worst trading month of the year, we can see this precipitating well longer than the 5 weeks we stated, and going further than our nearly 5% predicted drop.
📉 We would also consider a Bear-Call Spread, or Bear-Put Spread.
(These are types of spread options, sometimes referred to as Vertical Spreads, and Credit/Debit Spreads. If you have never heard of these, they are similar
to options, but lower risk with a set max profit. These differ from traditional Calls & Puts, by not needing to move for them to close
successfully. If we use apple as an example, we are going to do a Bear-Call Spread for $164, with a day expiration. If apple is $164 on
the dot, or less we close the trade with max profit.
- 👨🏼🏫 These Spreads, both the Bear-Put & Bear-Call are placed the same way. You will sell a Put or Call for the lower stock value, and at
the same time buy a Put or Call respectively, for the higher value stock price.) For this route, we are doing a
Bear- Call Spread for August 26, for $162.5 - $165. ❗We will be closing the position, or putting a Stop-Loss to
close in profit once the trade is at %50 ROI

SPX Daily TA Neutral BearishSPXUSD Daily neutral with a bearish bias. Recommended ratio: 47% SPX, 53% Cash .
*I incorrectly mentioned that PCE numbers would be released today, they are scheduled for release tomorrow at 830am EST. The 2nd US Q2 GDP estimate was reported today at -0.6% compared to the previous Advanced estimate of -0.9% , the third and final Q2 estimate will be reported on 09/29/22. Equities, Cryptos and Energy are up while VIX, DXY, US Treasuries and Commodities (aside from Energy) are all down or flat. St. Louis Fed President James Bullard made a pitch for more frontloading to bring down inflation and mentioned that he'd like to see EOY FFR at 3.75%-4%. Bullard isn't a voting member on the rates but his view could gain momentum depending on tomorrow's July PCE report and August's Jobs + CPI numbers. The Risk-On appetite seems to be growing ahead of the anticipated speech by Jerome Powell at Jackson Hole tomorrow. Market consensus is that Powell will remain hawkish but tomorrow's PCE numbers may inspire a more dovish tone regarding end of year expectations. Key Upcoming Dates: US July PCE at 830am EST 08/26 ; UofM Final August Sentiment Survey Index at 10am EST 08/26 ; Jackson Hole Economic Symposium on 08/25-08/27 (Fed Chair Jerome Powell scheduled to speak at 10am EST on 08/26).*
Price is currently trending up at $4199 and is still technically testing $4175 support. Volume remains Moderate (high) and has favored buyers in both of the last two sessions as Price tests $4175 support. Parabolic SAR flips bullish at $4290, this margin is neutral at the moment. RSI is currently trending up at 56.73 after forming a trough at, and bouncing off of, 52.68 support. Stochastic crossed over bullish in today's session and is currently trending up at 12 as it approaches 18.32 resistance. MACD remains bearish and is currently beginning to form a trough at 55.35 minor support. ADX is currently beginning to form a trough at 25 as Price is pushing higher, this is mildly bullish at the moment.
If Price is able to close above $4175 in tomorrow's session, it will likely retest $4254 minor resistance before potentially retesting the upper trendline of the descending channel from November 2021 at ~$4300 as resistance . However, if Price breaks down here, the next likely target would be a retest of the uptrend line from 06/16/22 at ~$4100 as support . Mental Stop Loss: (two b2b closes above) $4175.

SPX Daily TA Cautiously BearishSPXUSD Daily cautiously bearish. Recommended ratio: 10% SPX, 90% Cash.
*Equities and Cryptos are getting smashed as DXY and US Treasuries rally higher. Quite simply this is a response to global recessionary fears (amplified by last week's disappointing global economic data) and a commitment by the Fed to continue FFR hikes for the rest of the year. It seems as though investors are preparing for more hawkishness from Jerome Powell's upcoming speech in Jackson Hole on 08/26; which leaves tremendous surprise upside to markets if he gives any hints of dovishness. Key Upcoming Dates: S&P US August PMI at 945am EST 08/23 ; US Q2 Final GDP Estimate at 830am EST 08/25; US July PCE at 830am EST 08/26; UofM Final August Sentiment Survey Index at 10am EST 08/26; Jackson Hole Economic Symposium on 08/25-08/27.*
Price is currently trending down at $4138 and is still technically hanging on to $4175 support. Volume remains Moderate (high) and has favored sellers for two consecutive sessions; Price is currently trading in the second largest medium-term supply/demand zone on the chart. Parabolic SAR flips bullish at $4323 (this coincides with the 200 MA + the upper trendline of the descending channel from November 2021), this margin is neutral at the moment. RSI is currently trending down at 51 with no signs of trough formation and is technically testing 52.68 support; the next support is the uptrend line from 01/27/22 which coincides with 38 support. Stochastic remains bearish and is currently testing 18.32 support with no sign of trough formation. MACD finally crossed over bearish today after 56 days being bullish and is currently trending down at 74; the next support (minor) is at 55.35. ADX is currently trending down at 29 as Price continues to fall, this is neutral at the moment.
If Price is able to bounce here it will have to close above $4175 resistance to flip it back to support before it can attempt to retest $4254 minor resistance . However, if Price continues to break down here, it will likely retest the uptrend line from 06/16/22 at ~$4k psychological support . Mental Stop Loss: (two b2b closes above) $4175.

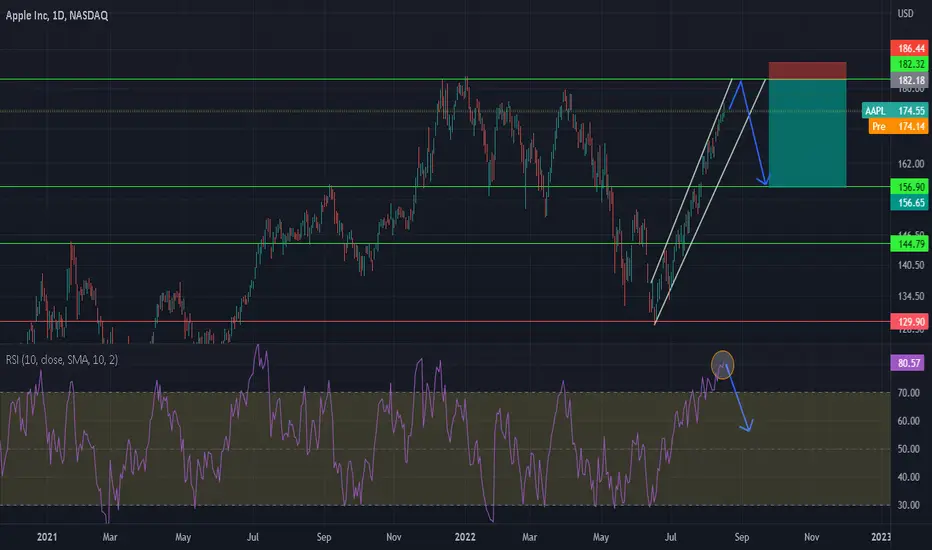
APPLE Short Position (NEW)We expect that the price will increase to the 180 price levels and then the price will drop to the 160 price levels. RSI is overbought. On 4h we can see that potential bearish divergences forming , but we still wait for bearish divergences on 1D timeframe to get more confirmation which may come at the key resistance.
Entry, stop-loss, and target levels are in the chart.

SPX Daily TA Cautiously BullishSPXUSD Daily cautiously bullish. Recommended ratio: 75% SPX, 25% Cash . *The BLS reported PPI numbers this morning and they followed in the footsteps of CPI by coming in lower than the month prior, from a 1% rise in June to a -0.5% drop in July. This was a surprise because consensus estimates had PPI rising by 0.2%, such a dramatic fall can largely be attributed to the 19% decline in national average retail gas prices since last month. Year over year, PPI registered its lowest rise from the 12 months prior at 7.6% (this is the lowest it's been since October 2021). This inflation data has markets believing that inflation has peaked and July's PCE numbers due on 08/26/22 will help to clarify whether the drawdown in inflation was largely due to a big pullback in gas prices. June's PCE numbers came in higher than estimates and, all things considered, the supply chain situation has only improved nominally which brings a bit of uncertainty regarding whether or not PCE will follow in the footsteps of CPI and PPI. Key dates next week: US Housing Starts and Building Permits at 830am EST 08/16; 5th GDPNow US Q3 GDP estimate at 915am EST 08/16 ; US Retail Sales at 830am EST 08/17.* Price is currently testing $4254 minor resistance (new resistance) after breaking out above $4175 resistance and flipping it to support (two consecutive closes above $4175). Volume remains Moderate and has favored sellers in three of the past four sessions even as Price is going higher, this is mildly bearish at the moment. Parabolic SAR flips bearish at $4109, this margin is mildly bearish. RSI is currently trending down at 67 after being rejected at 68.42 resistance, the next support is at 53. Stochastic is currently crossing over bullish at 91, the next resistance is max top while the next support is at 76. MACD remains bullish for a 48th consecutive session and is currently beginning to form a soft peak at 74, the next support (minor) is at 55 and the next resistance is the ATH at 91.78. ADX is currently trending up at 25 as Price is pushing higher, this is bullish. If Price is able to break out above $4254 minor resistance then the next likely target is a retest of the upper trendline of the descending channel from November 2021 at ~$4300 as resistance (which would probably coincide with the 200 MA). However, if Price is rejected here, it will likely formally retest $4175 support . Mental Stop Loss: (two consecutive closes) below $4175.

SPX Daily TA Neutral BearishSPXUSD Daily neutral with a bearish bias. Recommended ratio: 40% SPX, 60% Cash . * CRITICAL RESISTANCE WATCH . Equities finished the session relatively flat as markets are sending mixed signals ahead of CPI and PPI data on 08/10 and 08/11. Crypto, Gold, VIX and Oil are trending higher while DXY and Treasuries are down. Palantir reported an earnings miss and revenue beat and forecasted weaker revenue guidance for the second half of 2022; this likely isn't a market moving event but is important because it not only reflects a slowdown in growth stock interest but it hints at a slowdown in economic activity ( due to their significant number of government contract delays ). Key dates this week: COIN earnings 08/09; 4th US Q3 GDP estimate at 10am (EST) 08/10 ; CPI at 830am (EST) 08/10 ; Disney earnings 08/10; and PPI at 830am (EST) 08/11 .* Price continues to retest $4175 major resistance and briefly broke above it in today's session. Volume remains Moderate and fairly balanced between buyers and sellers reaffirming that Price is trading at a critical resistance. Parabolic SAR flips bearish at $4060, this margin is mildly bearish. RSI is currently trending down slightly at 63 after peaking at 66, it is also exhibiting minor Bearish Divergence; the next resistance is at 68 and next support at 53. Stochastic is currently crossing over bearish at 92 as it continues to trend sideways in the 'bullish autobahn'; the next support is at 76. MACD is currently beginning to form a soft peak at 68 and is still technically testing 55 minor resistance. ADX is currently trending up at 22.50 as Price continues its attempt to break above $4175, this is mildly bullish. If Price is able to bounce here then it will need to close above $4175 major resistance for two consecutive sessions in order to flip it to support; only after this will it be able to retest the upper trendline of the descending channel from November 2021 at ~$4300 as resistance . However, if Price breaks down here, it will likely retest $4100 before potentially retesting the uptrend line from 06/16/22 at $4k psychological support . Mental Stop Loss: (two consecutive closes above) $4175 .


SPX Daily TA Neutral BearishSPXUSD Daily neutral with a bearish bias. Recommended ratio: 45% SPX, 55% Cash. * JOBS REPORT WATCH . The Employment Situation is released tomorrow (08/05) at 830am (EST) and markets seem to be rallying as if unemployment is going to stay flat or go up insignificantly. If this scenario plays out, it will be interesting considering labor force participation continues to trend down from March , weekly jobless claims went up , there's been a notable increase in layoffs over the past few months and many corporations announced they are going to slow hiring through the end of the year. Equities continue their rally with the S&P posting its biggest bounce of the year (13%) since its June 16th low, reflecting that consumer sentiment regarding inflation, supply chains, FFR and Russia/China is very optimistic heading into 2023. Yesterday, OPEC+ agreed to raise output by 100,000bpd starting in September, compared to the ~600,000bpd increases in July and August this sent the price of Oil back up heading into September; which is likely to result in more inflationary pains for consumers. Taiwanese news agencies have reported that China has been conducting the closest military drills yet and have launched a record number of cyberattacks at Taiwan since Pelosi's visit . Blackrock will be offering crypto to their ~200 institutional investors through Coinbase Prime and Coinbase partnered with Meta to allow for NFTs to be shared on Instagram from Coinbase Wallet ; both of these reports sent COIN up 45% in today's session and probably made Cathie Wood shite her pant$ after selling 1.133m shares at ~$55 last week (Price is currently ~$88). The Atlanta Fed released their third Q3 GDP estimate and it came in higher than the last going from 1.3% to 1.4%. Apparently today the White House joined the WHO in labeling Monkeypox a public health emergency . Key dates: July Jobs Report at 830am (EST) 08/05; July CPI at 830am (EST) 08/10; 4th Atlanta Fed Q3 GDP Estimate 08/10; July PPI at 830am (EST) 08/11.* Price is currently testing $4175 resistance as it awaits the Jobs Report tomorrow morning. Volume remains Moderate (high) and has favored sellers in two of the past three sessions, indicating that $4175 resistance is seeing quite a bit of selling pressure. Parabolic SAR flips bearish at ~$4k (-3% from current Price), this margin is mildly bearish. RSI is trending down slightly at 65 after forming a peak at 66, this is currently exhibiting mild Bearish Divergence from Price; a potential Double Top formation is also forming just below 68 resistance which is something to watch for. Stochastic remains bearish but is currently attempting to cross over bullish at 93; the next support is at 76. MACD remains bullish for the 41st consecutive session and is currently trending up at 65 with no signs of peak formation; it is still technically testing 55 minor resistance. ADX is currently trending up at 22 as price pushes higher, this is mildly bullish. If Price is able to break above $4175 resistance then it will likely retest the 200 MA + the upper trendline of the descending channel from November 2021 at ~$4300 . However, if Price is rejected here, it will likely retest $4100 before potentially retesting the uptrend line from 06/16/22 at $4k psychological support . Mental Stop Loss: (two consecutive closes above) $4175.

SPX Daily TA Neutral BearishSPX Daily neutral with a bearish bias. Recommended ratio: 48% SPX, 52% Cash. * NANCY PELOSI WATCH. S&P Global released their final July US Manufacturing PMI estimate this morning and it came in at 52.2, slightly lower compared to both June's PMI and the consensus estimate of 52.3; this is the lowest it has been since July 2020. The Atlanta Fed released their second GDPNow Q3 estimate today and it came in at +1.3%, down from the initial estimate of +2.1% on 07/29/22. According to Reuters, CNN and 'Taiwanese media', Nancy Pelosi is scheduled to visit Taiwan tomorrow against the wishes of the PRC; though military countermeasures have been promised but are not expected, if this does happen it would surely shake up markets due to the uncertainty regarding how mainland China will respond. Key dates remaining this week: Nancy Pelosi potentially visiting Taiwan tomorrow night (08/02) and speaking to lawmakers and human rights groups on Wednesday (08/03); St. Louis Fed President James Bullard speaks @ 645pm EST (08/02); Cleveland Fed Loretta Mester speaks 12pm EST (08/03); July BLS Employment Situation @ 830am EST (08/04).* Price is currently facing some selling pressure at ~$4120 as it aims to retest $4175 resistance. Volume is Moderate and on track to favor buyers for a fourth consecutive session if it can close today in the green. Parabolic SAR flips bearish just below the 50 MA at $3900. RSI is currently trending down slightly at 65 after forming a peak at 66 (just below 68.42 resistance); Hidden Bearish Divergence between Price and RSI can be seen from 06/02/22, this is significant due to the potential local Double Top formation. Stochastic remains bullish but is trending down at 98.5 after testing max top for the first time in ten sessions; if it breaks below 93.5 it would be a bearish crossover. MACD remains bullish for the 38th consecutive session and is currently trending up at 49.50 as it approaches 55 minor resistance with no signs of peak formation. ADX is currently trending up at 19 as Price pushes higher, this is mildly bullish. If Price is able to push higher then it will likely formally retest $4175 resistance where it may see a bit of selling pressure. However, if Price breaks down here, it will likely retest the uptrend line from 06/16/22 as support at ~$4k . Mental Stop Loss: (one close above) $4175.

SPX Daily TA Cautiously BullishSPX Daily bullish. Recommended ratio: 88% SPX, 12% Cash. * CRITICAL RESISTANCE WATCH . The BEA reported June PCE numbers this morning and both came in higher than last month: Core PCE (sans Food and Energy) came in at 4.8% vs 4.7% last month (also had a 4.7% consensus estimate) and PCE Index came in at 6.8% (20 year high) vs 6.3% in the previous two months. Although the move in Core PCE wasn't too significant, it's the Fed's preferred gauge of inflation which leaves the possibility of a 75bps hike in September on the table. BLS reported Q2 ECI numbers and compensation stayed relatively flat while wages/salaries increased and benefits decreased compared to Q1, this is perhaps indicative of businesses cutting perks and profit sharing in exchange for higher wages to lure in talent during an inflation induced consumer slowdown. Compensation, Wages/Salary and Benefits all went down for State and Local Government employees. The U of M Sentiment Survey came in at 51.5, a 3% gain from last month's (50); if next month's is higher, this would imply that consumers are becoming more optimistic about the worst being behind us in 2022. The Atlanta Fed posted their first GDPNow Q3 estimate and to the surprise of many they anticipate a quarter of +2.1% GDP growth. Earnings this quarter are so far proving to be resilient as well and provide additional confidence for investors going into Q3. Equities, Cryptos, Gold and Oil are up while VIX, DXY, and Treasuries are down as more investors begin to transition to risk-on with hopes that the worst is behind us. Though I still think it's premature to assume money markets have bottomed until after September, there is a lot of upside potential here compared to downside.* Price is continuing the FOMC rally and is currently trending up at $4130 as it approaches a test of $4175 resistance (which is a critical resistance). Volume remains Moderate (high) and is on track to favor buyers for a third consecutive session if it can close today in the green. Parabolic SAR flips bearish at $3862, this margin is mildly bearish at the moment. RSI is currently trending up and beginning to form a soft peak at 66 as it approaches 68.42 resistance. Stochastic remains bullish and is currently trending up at max top. MACD remains bullish and is currently breaking above 33 resistance and trending up at 42.65 with no sign of peak formation, the next resistance is at 55. ADX is currently trending up at 18 as Price is pushing higher, this is bullish. If Price is able to continue up here then it will likely test $4175 major resistance before potentially testing the upper trendline of the descending channel from November 2021 at ~$4300 as resistance . However, if Price breaks down here, it will likely test $4k psychological support before potentially retesting $3938 minor support . Mental Stop Loss: (one close below) $4k.

SPX Daily TA Neutral BullishSPX Daily neutral with a bullish bias. Recommended ratio: 55% SPX, 45% Cash. * BULL TRAP WATCH . META missed on both earnings and revenue estimates in addition to seeing their first drop in revenue growth; they predict that this trend will continue in Q3 and perhaps the rest of the year. Fed announced a 75bps hike today and Chairman JPow iterated that we aren't in a recession because the labor market continues to be resilient (stagflation), assuring investors that a soft landing is still not out of reach. Interestingly, he also mentioned that "another unusually large rate hike could be appropriate at the next meeting", "path to a soft landing is narrowing", "likely full effects of rate hikes have not been felt yet", and that inflation could get worse going into year end. Somehow, investors are rejoicing as if a bottom is in; but if you look at what happened when the last FOMC statement was released, SPX rallied 2% from $3762 to $3841 to close 06/15 and then fell 5% from $3841 to $3642 to start the next session (06/16). The TA this time around looks a bit different but it's something to be mindful of going in to tomorrow. Key dates remaining this week: 1st Q2 GDP estimate at 830am EST tomorrow (07/28), AAPL and AMZN earnings after-hours tomorrow (07/28), PCE Index report at 830am EST (07/29) and University of Michigan Consumer Sentiment Index (07/29). If the first GDP estimate comes in at -1.2% (current GDPNow estimate) or less, it will likely add bullishness to hopes of a 'mild recession' or no 'recession' at all. If PCE numbers (the Fed's preferred gauge of inflation) show that they are declining somehow, the Fed will likely interpret that as inflation starting to wind down and will look to raise FFR by 50bps in September (which money markets would likely perceive as bullish). It's still too premature to call for a bottom but if Price is able to close above $3938 for the rest of the week, there is a good chance that it tests the upper trendline of the descending channel from August 2021 at ~$4300 riding into September.* Price is currently breaking out above $3938 minor resistance after bouncing from a very critical support juncture in response to the FOMC statement today. Volume remains Moderate (high) and has been alternating between buyer and seller dominance over the past four sessions. Parabolic SAR flips bearish at $3809, this margin is mildly bearish. RSI is currently trending up at 60 (3-month high) with no signs of peak formation after bouncing from 53 support, the next resistance is at 68. Stochastic bounced off 76 support and is currently trending up at 80, if it can break above 81 it would be a bullish crossover. MACD remains bullish and is currently trending up at 20 after breaking above 10.73 support, the next resistance is at 33. ADX is completing a trough and is currently trending up slightly at 16 as Price is pushing higher, this is mildly bullish. If Price is able to close above $3938 for one more session then the next likely target is a retest of $4175 resistance . However, if Price breaks back down here it will likely retest $3938 minor support before potentially heading lower. Mental Stop Loss: (one close below) $3915 .
