Primoris Services: A Long-Term Pick in US Energy Infrastructure◉ Abstract
Our latest analysis focuses on the booming U.S. utility and energy sector, set to hit a massive $1.1 trillion! Learn about the key drivers fueling this growth, from our increasing electricity needs and the electric vehicle revolution to the exciting rise of clean energy.
We have also given a “Buy” rating on Primoris Services Corporation NYSE:PRIM , a major player in building this energy infrastructure. Our analysis reveals their strong financial performance, attractive valuation compared to its peers, and promising technical indicators. While acknowledging potential headwinds like regulatory shifts, we believe Primoris presents a compelling long-term investment opportunity with significant upside potential. Read detailed analysis here and invest smartly.
Read full analysis here...
◉ Introduction
Imagine the companies that bring electricity to your home, the gas for your stove, and are building the future of clean energy. That's the U.S. utility and energy sector! It's a massive part of the American economy, and it's getting even bigger. By 2025, experts predict it will be worth a whopping $1.1 trillion! This includes everything from generating electricity to delivering it through power lines and pipelines, as well as distributing natural gas across the country.
This sector has been steadily growing at about 2.7% each year between 2020 and 2025, and it looks like this growth is going to continue. This article will give you a snapshot of the major reasons behind this growth, top players in this sector, and investment opportunities.
◉ Major Factors Behind the Growth of US Energy Sector
1. Electricity Use is Climbing: Americans are using more power than ever. The EIA expects electricity consumption to hit 4,205 Billion kWh in 2025, up from 4,097 Billion kWh in 2024. This surge is fuelled by increased usage in residential, commercial, and industrial sectors.
2. Everything’s Going Electric: Think about electric cars, heat pumps that heat and cool homes, and even cleaner machines in factories. More and more things are switching to electricity, which means we need even more power! This big shift towards using electricity is called electrification, and it's a major driver for the energy sector.
3. Clean Energy on the Rise: Solar panels and wind turbines are becoming a bigger part of how we get our electricity. These renewable energy sources are growing fast. By 2026, it's expected that they will provide about 27% of all the electricity in the U.S., up from around 25% in 2024. This move towards cleaner energy is really important for the future.
4. Massive Investments Ahead: To keep up with this growing demand and the shift to new technologies, utility companies are investing a lot of money. They are upgrading power grids (the network of lines that deliver electricity), building charging stations for electric vehicles (EVs), and using smart technologies to manage energy better. Experts at S&P Global predict that total spending on these things could be over $790 Billion between 2025 and 2030!
◉ Big Players in Building the US Energy Infrastructure
1. Quanta Services, Inc. NYSE:PWR : A premier provider of specialized infrastructure solutions for the electric power and oil & gas sectors. They are also heavily involved in renewable energy projects like solar and wind farms. You can learn more about them on their official website .
2. Primoris Services Corporation NYSE:PRIM : They provide construction and engineering services for the energy, utility, and infrastructure markets. They are increasingly focusing on building projects related to renewable energy. You can explore their details on their official website .
3. MasTec, Inc. NYSE:MTZ : This is a top infrastructure company in North America, working on energy, utility, and communication projects. This includes building renewable energy facilities, telecom networks, and oil & gas pipelines. You can find more information on their official website .
This report offers an in-depth analysis of Primoris Services Corporation , a prominent player in the U.S. energy infrastructure space.
Our long term recommendation is backed by Primoris Services Corporation ’s technical analysis and fundamental performance.
◉ Investment Advice
💡 Buy Primoris Services Corporation NYSE:PRIM
● Buy Range - 67 - 68
● Sell Target - 88 - 90
● Potential Return - 30% - 45%
● Approx Holding Period - 12-14 months
◉ Revenue and Profit Analysis
● Year-on-Year
- In FY24, Primoris reported revenue of $6,367 Million, marking an 11% increase from $5,715 Million in FY23.
- EBITDA grew to $415 Million, up from $366 Million the previous year, with the EBITDA margin slightly improving to 6.5% from 6.4%.
● Quarter-on-Quarter
- Q4 FY24 revenue reached a record $1,741 Million, up from $1,649 Million in Q3 and 14.9% higher than $1,515 Million in Q4 FY23.
- Despite the revenue growth, Q4 EBITDA declined to $110.6 Million from $123 Million in Q3.
- Diluted EPS (LTM) rose to $3.30 in Q4, up from $3.00 in Q3 FY24, indicating solid earnings momentum.
◉ Valuation
1. P/E Ratio (Price-to-Earnings)
● Compared to Peers:
- PRIM’s P/E is 17.9x, much lower than the peer average of 32.7x. This means the stock is cheaper than most competitors based on earnings.
● Compared to Industry:
- With a P/E ratio of 17.9x, PRIM trades below the industry average of 26.4x, suggesting it offers strong value within the sector.
2. P/B Ratio (Price-to-Book)
● Compared to Peers:
- PRIM’s P/B is 2.6x, while peers average 4.5x—again showing the stock may be undervalued.
● Compared to Industry:
- Compared to the industry average of 4.4x, PRIM still appears to be a bargain.
3. PEG Ratio (Price/Earnings to Growth)
PRIM’s PEG ratio is 0.43, which suggests the stock is not only cheap but also expected to grow earnings strongly—an attractive combination for investors.
◉ Cash Flow Analysis
- Primoris saw a strong improvement in operating cash flow, which jumped to $508 Million in FY24 from $196.8 Million in FY23—a sign of better cash generation from its core business.
◉ Debt Analysis
- With a debt-to-equity ratio of 0.42, the company maintains a solid financial position, suggesting its debt levels are well under control and not overly risky.
◉ Top Shareholders
- The Vanguard Group holds a substantial 11.6% stake in Primoris, reflecting strong confidence in the company.
- BlackRock also increased its investment by 9.65% from Q3 FY24 and now owns approximately 11.3% of the company.
◉ Technical Aspects
- On the monthly chart, the price is in an overall uptrend and has bounced off the trendline support, indicating continued upward momentum.
- On the daily chart, the price has broken through a rounding bottom pattern and is holding above the breakout zone, suggesting a potential for further upside movement.
◉ Potential Risks & Challenges
1. Regulatory Uncertainty: Ongoing concerns about global trade policies, tariffs, and regulatory changes, especially in the solar and battery storage markets, could impact future project economics and timing.
2. SG&A Expenses: Increased by $10.9 Million year-over-year, driven by higher personnel costs and $3.2 Million in severance expenses.
3. Energy Segment Backlog: Experienced a decrease due to the timing of new solar awards, potentially affecting future revenue visibility.
◉ Conclusion
Primoris Services Corporation NYSE:PRIM stands out as a promising investment, backed by consistent growth, strong financials, and a strategic focus on renewable energy and infrastructure. Despite facing risks like regulatory changes and backlog fluctuations, its solid position in the U.S. energy sector—especially with increased demand for clean energy solutions—gives it a clear path forward. With a competitive valuation and support from major investors like Vanguard and BlackRock, Primoris is poised for sustainable growth, making it an attractive long-term opportunity for investors.
Stockanalysis

NASDAQ Fall? US100 AnalysisHello everyone.
We had a volatility at stock market last 2 month, it looks like market had good correction and found new buyer. BUT I DON'T THINK LIKE THAT.
After MR. Trump inauguration we saw bear market signals, it was like hedge funds dumped stocks, but after strong sell new buyers came at market and show us pretty good market correction but what will be next? The last 2 months brought intense volatility post-Trump’s inauguration. Hedge funds sold off heavily (S&P 500 dropped ~8% from its December high), but buyers stepped in, pushing a 5% retracement. RSI on SPY shows oversold conditions fading, yet I’m skeptical of this bounce.
Why? Bearish signals linger. VIX remains elevated (>20), and volume on up days is weaker than selloffs. Plus, geopolitics could derail this rally. Over the weekend, Ukraine and Russia discussed a 30-day ceasefire. If talks fail, the West’s new sanctions could spike oil prices (Brent crude already testing $80) and hammer energy-heavy indices like XLE or European markets (DAX).
I’m watching SPY’s 200-day MA (~510) as key support. A break below could signal a deeper pullback to 480. Energy and tech (QQQ) look vulnerable if sanctions hit. What’s your take—buying this dip or bracing for more downside?
Here is my 2 scene what i am expect from market, for me Scene and technical view scene 2 is more logical bur we will see what will be next step for stock market.
For collaboration text me in DM!!!
Always make your own research!!!

Breakout in Dave Inc...Chart is self explanatory. Levels of breakout, possible up-moves (where stock may find resistances) and support (close below which, setup will be invalidated) are clearly defined.
Disclaimer: This is for demonstration and educational purpose only. This is not buying or selling recommendations. Please consult your financial advisor before taking any trade.

Walt Disney Co | DISThe Walt Disney Company is reportedly exploring options to sell or find a joint venture partner for its India digital and TV business, reflecting the company's ongoing strategic evaluation of its operations in the region. The talks are still in the early stages, with no specific buyer or partner identified yet. The outcome and direction of the process remain uncertain. Internally, discussions have commenced within Disney's headquarters in the United States as executives deliberate on the most viable course of action. These deliberations signify the company's willingness to adapt and optimize its business operations to align with changing market dynamics. The Wall Street Journal reported on July 11 that Disney had engaged with at least one bank to explore potential avenues for assisting the growth of its India business while sharing the associated costs. This approach suggests a proactive stance by the company to explore partnerships or arrangements that can drive growth while minimizing financial burdens. While it is too early to ascertain the exact direction this exploration will take, the developments in Disney's India business warrant attention, as they may shape the future landscape of the company's presence in this all-important region.
The ongoing shift from traditional TV to streaming has placed Disney and its competitors in a costly and transformative phase. As part of this transition, Disney is actively cutting costs amid macroeconomic challenges that have impacted its advertising revenue and subscriber growth. CEO Bob Iger has been at the forefront of these changes, and his contract was recently extended through 2026 to allow him sufficient time to make transformative changes while strengthening the bench with future leaders of the company.
One of the key considerations for Disney is evaluating its portfolio of TV networks, including ABC and ESPN. Bob Iger has expressed a willingness to be expansive in assessing the traditional TV business, leaving open the possibility of selling certain networks while retaining others acknowledging that networks like ABC may not be core to Disney's new business model. ESPN, as a cable TV channel, is being approached differently. Disney is open to exploring strategic partnerships, such as joint ventures or offloading ownership stakes, to navigate the challenges faced by the sports network. CEO Iger, who had previously expressed pessimism about the future of traditional TV, has found the situation to be worse than anticipated since his return to Disney.
Although the linear networks segment, which accounts for Disney's TV properties such as ABC, National Geographic, FX, and FreeForm, has struggled to grow in the recent past, this segment is still an important part of the company's business, which is evident from the positive operating income reported by this segment in fiscal 2022. As below data reveals, the DTC business and content licensing made operating losses in FY 2022 which were offset by the operating income reported by linear networks. For this reason, investors will have to closely monitor a potential sale of TV assets to evaluate the impact of such a decision on Disney's profitability.
The broadcasting landscape is experiencing a significant shift, with uncertainties surrounding its future and the changing nature of consumer preferences. While linear television channels are not expected to disappear immediately, their consumption continues to decline as viewers increasingly favor OTT platforms. This transition represents a fundamental trend shaping the industry. In terms of business models, subscription video-on-demand (SVOD) services will continue to grow with targeted advertising.
As the ascent of streaming video continues, cable, satellite, and internet TV providers in the United States faced their most significant subscriber losses to date in the first quarter of 2023. Analyst estimates indicate a collective shedding of 2.3 million customers during this period. Consequently, the total penetration of pay-TV services in occupied U.S. households, including internet-based services like YouTube TV and Hulu, dropped to its lowest point since 1992, standing at 58.5%, according to Moffett's calculations.
In Q1, pay-TV services in the U.S. witnessed a nearly 7% decline in customers compared to the previous year, with cable TV operators experiencing a 9.9% decline, while satellite providers DirecTV and Dish Network registered subscriber losses of 13.4%. Virtual MVPDs, which are multichannel video programming distributors, also suffered significant losses, shedding 264,000 customers during the quarter. Comcast, the largest pay-TV provider in the country, lost 614,000 video customers in Q1, and Google's YouTube TV was the only tracked provider to experience subscriber growth, adding an estimated 300,000 subscribers during the period. These trends illustrate the challenges faced by the pay-TV industry, with factors like increasing sports-broadcast fees driving retail prices higher, leading to cord-cutting and subsequent price adjustments by distributors. By 2026, e-Marketer predicts that the number of non-pay TV households will surpass pay TV households by over 25 million.
In efforts to achieve profitability in the streaming business, Disney has implemented significant cost-cutting measures, including saving $5.5 billion through cost reductions and layoffs, and a focus on making Disney+ and Hulu more profitable. Disney aims to enhance Hulu integration, seeing it as a vital component of the company's transition from TV to a streaming-only model. Discussions are also underway for Disney to acquire Comcast Corporation's (CMCSA) stake in Hulu, as Disney currently holds 66% ownership. The company believes that the integration of Hulu and Disney+ will bolster the streaming business and contribute to its profitability. While the negotiations with Comcast over Hulu's valuation are ongoing, the combined offering of Disney+ and Hulu is expected to be available to consumers by the end of the calendar year. Although Disney's plans for ESPN+ and the fate of its other cable channels, such as the Disney Channel, remain uncertain, Bob Iger expects ESPN to eventually move to a streaming-only model, acknowledging the disruptive nature of the traditional TV business model.
The discussions surrounding Walt Disney's TV and streaming business in India come at a critical juncture for the company, as it grapples with intensified competition and significant challenges in the market. The emergence of Reliance Industries' JioCinema streaming platform has posed a considerable threat to Disney's dominance, especially after Reliance secured digital rights for the highly popular Indian Premier League cricket tournament. This strategic move by Reliance, which offered free access to the tournament earlier this year, caused a substantial decline in Disney+ Hotstar's subscribers, a popular streaming service under Disney's India business.
Additionally, Viacom18, which is backed by Reliance and Paramount Global (PARA), made a significant impact on Disney's market position in India. Through its partnership with Warner Bros, Viacom18 secured content rights to popular shows on HBO including Succession, previously aired on Disney's platform. This collaboration forms a formidable alliance challenging Disney's dominance in the Indian market. Reliance's freemium model poses the most significant threat to Disney's current position. By offering content for free on its streaming platform, JioCinema attracted a substantial number of subscribers through the broadcast of IPL. With its ample cash reserves, Reliance has the advantage of focusing on subscriber growth without immediately focusing on monetization strategies. The loss of streaming rights for the IPL, combined with a subsequent decline in paid subscribers, had a profound impact on Disney's reputation in India in the first quarter of this year, which could very well be the most challenging Q1 Disney has had in India for a long time.
A report on video consumption trends in India by Media Partners Asia sheds light on the dynamic landscape of the online video sector in India. For the 15 months that ended in March 2023, total consumption across the online video sector reached a staggering 6.1 trillion minutes. During this period, Disney+ Hotstar emerged as the dominant player in premium VOD, capturing 38% of viewing time. The report attributes Hotstar's success to its strong sports offerings and the depth of its Hindi and regional entertainment content.
During the survey period, Zee and Sony together held a 13% share of the Indian premium video sector viewing time. While the two companies are expected to merge pending regulatory approval, they are projected to operate independently for another year, benefiting from strong engagement across sports as well as regional, local, and international content. Prime Video and Netflix, Inc. (NFLX) collectively accounted for a 10% share of viewership in the premium VOD category. Prime Video also garnered a significant portion of viewership from regional Indian titles. The report emphasizes that local content dominates premium VOD viewership, particularly outside the sports category, while international content leads paid tiers. Catch-up TV is prevalent in the free tier across freemium streaming platforms.
Although Disney was the clear winner in 2022, this report highlights a significant shake-up in the market brought about by the transformation of JioCinema. JioCinema, which previously held a mere 2% share of the premium video market, experienced a major upswing in growth since April. This surge can be attributed to JioCinema's decision to offer free live streaming of the popular IPL cricket tournament, a property that was previously exclusive to Disney-owned media in India. Despite technical glitches impacting user experience, JioCinema witnessed a more than 20-fold increase in consumption in April 2023, enabling it to dominate the premium VOD category. The report raises questions about JioCinema's ability to sustain this growth and scale in the absence of IPL action after June 2023. That being said, this could be an early indication of growth challenges Disney-owned brands may face in India.
Star India, now known as Disney Star following the rebranding last year, is expected to experience a revenue drop of around 20% to less than $2 billion for the fiscal year ending September 2023. Additionally, EBITDA is projected to decline by approximately 50% compared to the previous year. Furthermore, Hotstar is estimated to lose 8 to 10 million subscribers in its fiscal third quarter as well.
Given the current scenario, finding an outright buyer for Disney's India business is expected to be challenging. When Disney acquired the entertainment assets of 21st Century Fox in 2019, the enterprise value of the Indian business was estimated at around $15-16 billion. This high valuation, coupled with the intense competition and declining subscriber base, presents a complex landscape for potential buyers or partners.
I believe Disney stock is attractively valued today given that the company's streaming business has a long runway for growth internationally while its brand assets will continue to drive revenue higher. As an investor, I am both concerned and curious about what the future holds for Disney's linear networks segment. Going by the recent remarks of CEO Iger, major changes are on their way. A strategic decision to divest non-core assets, in my opinion, will trigger a positive response from the market. That being said, a major divestment of TV assets could materially impact the company's profitability in the next 3-5 years until its streaming business scales enough to replace lost revenue from the linear networks segment. Investors will have to closely monitor new developments to identify a potential inflection point in Disney's story.

Intel Corporation | INTCIntel reported second quarter earnings on Thursday, showing a return to profitability after two straight quarters of losses and issuing a stronger-than-expected forecast. the stock rose 7% in extended trading.
Here’s how Intel did versus Refinitiv consensus expectations for the quarter ended July 1:
Earnings per share: 13 cents, adjusted, versus a loss of 3 cents expected by Refinitiv.
Revenue: $12.9 billion, versus $12.13 billion expected by Refinitiv.
For the third quarter, Intel expects earnings of 20 cents per share, adjusted, on revenue of $13.4 billion at the midpoint, versus analyst expectations of 16 cents per share on $13.23 billion in sales.
Intel posted net income of $1.5 billion, or 35 cents per share, versus a net loss of $454 million, or a loss of 11 cents per share, in the same quarter last year.
Revenue fell 15% to $12.9 billion from $15.3 billion a year ago, marking the sixth consecutive quarter of declining sales.
Intel CEO Pat Gelsinger said on a call with analysts the company still sees “persistent weakness” in all segments of its business through year-end, and that server chip sales won’t recover until the fourth quarter. He also said that cloud companies were focusing more on securing graphics processors for artificial intelligence instead of Intel’s central processors.
David Zinsner, Intel’s finance chief, said in a statement that part of the reason the report was stronger than expected was because of the progress the company has made toward slashing $3 billion in costs this year. Earlier this year, Intel slashed its dividend and announced plans to save $10 billion per year by 2025, including through layoffs.
“We have now exited nine lines of business since Gelsinger rejoined the company, with a combined annual savings of more than $1.7 billion,” said Zinsner.
Revenue in Intel’s Client Computing group, which includes the company’s laptop and desktop processor shipments, fell 12% to $6.8 billion. The overall PC market has been slumping for over a year. Intel’s server chip division, which is reported as Data Center and AI, saw sales decline 15% to $4 billion plus Intel’s Network and Edge division, which sells networking products for telecommunications, recorded a 38% decline in revenue to $1.4 billion.moreover Mobileye, a publicly traded Intel subsidiary focusing on self-driving cars, saw sales slip 1% on an annual basis to $454 million and Intel Foundry Services, the business that makes chips for other companies, reported $232 million in revenue.
Intel’s gross margin was nearly 40% on an adjusted basis, topping the company’s previous forecast of 37.5%. Investors want to see gross margins expand even as the company invests heavily in manufacturing capability.
In the first quarter, the company posted its largest loss ever as the PC and server markets slumped and demand declined for its central processors. Intel’s results on Thursday beat the forecast that management gave for the second quarter at the time.
Intel management has said the turnaround will take time and that the company is aiming to match TSMC’s chip-manufacturing prowess by 2026, which would enable it to bid to make the most advanced mobile processors for other companies, a strategy the company calls “five nodes in four years.” Intel said on Thursday that it remained on track to hit those goals.
Nvidia has had an amazing run, but any emerging technology, such as AI, which is bottlenecked by a single company will have issues in growth. Consulting firm McKinsey has pegged the AI market to be worth $1 trillion by 2030, but also that it was in an experimental and in early phases of commercial deployment.
While Nvidia will likely retain its leadership in GPU hardware as applied to AI for the foreseeable future, it is likely that other hardware solutions for AI systems will also be successful as AI matures. While technologist may quibble on specifics, all major AI hardware today are based on GPU architectures, and as such I will use the terms and concepts of AI hardware and GPU architecture somewhat interchangeably.
One likely candidate for AI related growth may be AMD (AMD), which has had GPU products since acquiring ATI in 2006.However, unlike Nvidia, which had a clear vision for of general-purpose GPU products (GPGPU), historically, AMD had largely kept its focus on the traditional gaming applications. AMD has developed an AI architecture called XDNA, and an AI accelerator called Alveo and announced its MI300, an integrated chip with GPU acceleration for high-performance computing and machine learning. How AMD can and may evolve in the AI may be subject of a different article.
Another contender for success in the AI applications using GPU is Intel, who is the focus of this article. Intel has maintained a consistent, if low key focus on GPU hardware focused on AI applications over the last decade. Intel’s integrated HD Graphics is built into most modern processor ICs; however, these are insufficient compared to dedicated GPUs for high-end inferencing or machine learning tasks.
It has 2 primary GPU architectures in production release:
In 2019 Intel Corporation acquired Habana Labs, an Israel-based developer of programmable deep learning accelerators for the data center for approximately $2 billion. Habana Labs’ Gaudi AI product line from its inception focused on AI deep learning processor technologies, rather than as GPU that has been extended to AI applications. As a result, Gaudi microarchitecture was designed from the start for the acceleration of training and inferencing. In 2022 Intel announced Gaudi2 and Greco processors for AI deep learning applications, implemented in 7-nanometer (TSMC) technology and manufactured on Habana’s high-efficiency architecture. Habana Labs benchmarked Gaudi2’s training throughput performance for the ResNet-50 computer vision model and the BERT natural language processing model delivering twice the training throughput over the Nvidia high end A100-80GB GPU. So, Gaudi appears to give Intel a competitive chip for AI applications.
Concurrent with the Habana Labs’ Gaudi development, Intel has internally developed the Xe GPU family, as dedicated graphics card to address high-end inferencing or machine learning tasks as well as more traditional high-end gaming. Iris® Xe GPU family consists of a series of microarchitectures, ranging from integrated/low power (Xe-LP) to enthusiast/high performance gaming (Xe-HPG), data center/AI (Xe-HP) and high-performance computing (Xe-HPC). The architecture has been commercialized in Intel® Data Center GPU Flex Series (formerly codenamed Arctic Sound) and Intel® Arc GPU cards. There is some question on Xe GPU future and evolution. Intel has shown less commitment to the traditional GPU space compared to Gaudi. Nonetheless, it does demonstrate Intel ability to design and field complex GPU products as its business requires.
Intel has many other AI projects underway. The Sapphire Rapids chips implements AI specific acceleration blocks including technology called AMX (Advanced Matrix Extensions), which provides acceleration inside the CPU for efficient matrix multiplications used in on-chip inferencing and machine learning processing by speeding up data movement and compression. Intel has supporting technologies such as Optane, which while cancelled as a production line, is available for their needs of a high-performance non-volatile memory, one of the intrinsic components in any AI product.
Based on the above, Intel appears to have competitive hardware solutions, however if we look at Nvidia success in AI, it is a result of a much a software and systems focus as it is the GPGPU hardware itself. Can Intel compete on that front. Ignoring for the moment that Intel has a huge software engineer (approx. 15,000) resource, it also has- access to one of the leading success stories in perhaps the most competitive AI application – self driving cars.
Mobileye, who was acquired by Intel in 2017, has been an early adopter and leader, with over 20 years of experience in automotive automated driving and vision systems. As such, Mobileye has a deep resource of AI domain information that should be relevant to many applications. Mobileye has announced that it is working closely with Habana, as related divisions within Intel. While Intel is in the process of re-spinning out Mobileye as public company, Mobileye Global Inc. (MBLY), at present Intel still owns over 95% of shares, keeping it effectively an Intel division.
In looking at Intel, we have a company with the history, resources, and technology to compete with Nvidia and infrastructure. They have made significant investment and commitment to the emerging AI market, in times when they have exited other profitable businesses. It should also be understood that AI related product are a small percentage of overall Intel revenues (INTC revenue are more than twice NVDA, even if NVDA has 6x its market cap), and continues to keep its primary business focus on its processor and foundry business.
Hopefully for shareholders, Intel continues to push their AI technology and business efforts. Their current position is that this is strategic, but Intel is in a very fluid time and priorities may change based on business, finances, and of course the general interest and enthusiasm for AI. It is always worth noting that AI as a technical concept is mature, and appears to be cyclical, with interest in the technical community rising and falling in hype and interest once every decade or so. I remember working on AI applications, at the time labeled as expert systems in the 1980s. If we are currently at a high hype point, this may be temporary, based on near term success and disappointment in what AI does achieve. Of course, as always, “this time is different” and the building blocks of effective AI systems currently exist, where for previous iterations, it was more speculative.

Take Two | TTWO & GTA VI. Part IITakeTwo Interactive is preparing for the biggest catalyst in the company's history with the release of GTA 6. Although no definitive timetable has been set for GTA 6, the game will almost certainly release in 2024 or 2025 at the latest given all the information that has come out. Moreover, TTWO itself has started opening up about GTA 6, which is a hint that an announcement is near. The impact that GTA 6 will have on TTWO cannot be understated, given how much resources have been spent developing GTA 6 and the growing consumer frenzy surrounding the title.TTWO could see more upward momentum as GTA 6's release closes in.
GTA 6 is by far the most anticipated video game in the industry's history. The game is so hyped, in fact, that individuals have crashed televised events purely to protest for the release of GTA 6. Even Starfield, which is an incredibly hyped game in its own right, had it Gamescon presentation disrupted by a fan calling for GTA 6. GTA 6 has not even been announced yet, and it seems to have fully captured the attention of the gaming world.
This level of organic hype is an incredibly positive sign for TTWO and its investors. Despite the fact that GTA 5 had nowhere near the hype as GTA 6 at similar stages in their development, GTA 5 still managed to become the best-selling triple A game ever made, with ~185 million units sold. This is a testament to GTA 6's potential, both on a commercial and even cultural standpoint.
If GTA 6 manages to meet or exceed consumer expectations, TTWO should see its shares surge. Given the hysteria surrounding the title, positive reviews will only supercharge demand as consumers will likely find any reason to get their hands on the game. Considering the amount of resources TTWO is rumored to be spending on developing GTA 6, coupled with Rockstar's track record of producing masterpieces, there is very little chance that GTA 6 disappoints.
While GTA is TTWO's most important IP, the company also boasts a strong lineup beyond GTA. In fact, some of its other franchises are bestsellers in their own right. Red Dead Redemption, for instance, has sold more than 55 million units and continues to sell at a solid pace despite the game being nearly 5 years old. Red Dead Redemption has also been critically praised as one of the best triple A games ever made.
TTWO currently has one of its most robust product pipelines in the history of the company across all of its studios. The company has even diversified into mobile gaming, which is proving to be an increasingly large segment in the gaming industry. In fact, TTWO made a huge acquisition in Zynga for a whopping $12.7 billion. Zynga is one of the largest mobile gaming studios in the world and owns massively popular IPs like FarmVille.
Despite TTWO's growing pipeline, the company is still relatively top-heavy compared to peers like EA (EA) or Activision Blizzard (ATVI). This means that underperformance for its flagship franchises, especially GTA, will almost certainly cause the company's value to plummet. So much of TTWO's future prospects are dependent upon the success of GTA 6, especially considering how much revenue the game is expected to pull in.
To gain some perspective on how important the GTA franchise is for TTWO, GTA has generated over $8 billion in revenue since GTA 5's release in 2013. TTWO itself is only worth ~$23 billion. GTA online, for instance, still contributes heavily to the company's recurring revenue and bookings, which came in at $1.2 billion in its most recent quarter.
TTWO has a huge opportunity with GTA 6. The game has garnered unprecedented hype that is starting to grow to a fever pitch. If TTWO delivers a solid sequel, GTA 6 could potentially deliver revenues upwards of ~$20 billion over the next decade, given the revenue trajectory of GTA sequels. At TTWO's current valuation of $23 billion, the company has far more upside, given the potential of GTA 6 and the company's growing pipeline of popular titles.

Microsoft (MSFT) Share Price Jumps Nearly 9% – What’s Next?Microsoft (MSFT) Share Price Jumps Nearly 9% – What’s Next?
As the chart shows, Microsoft (MSFT) shares surged sharply, forming a large bullish gap: while trading closed around $391 on 30 April, yesterday’s candlestick closed just below the $425 mark.
What Drove the Rally in Microsoft Shares?
Microsoft released its financial results for the first quarter of 2025, exceeding Wall Street expectations on both revenue (actual = $70.1 billion, 2.4% above forecasts) and earnings per share (actual = $3.46, 7.4% above forecasts).
Particular attention was drawn to the strong performance of Azure – revenue from Azure and other cloud services soared by 33% year-on-year. A significant part of this growth was fuelled by robust demand for artificial intelligence services, which helps ease concerns about the return on large-scale infrastructure investments related to AI.
In addition, Microsoft issued an upbeat outlook for the next quarter, which ultimately triggered the sharp rise in its share price.
Technical Analysis of MSFT Chart
Yesterday’s candlestick closed near its low (highlighted by the arrow), indicating that bears were active during the trading session. From a technical analysis perspective, this can be explained by the proximity of the price to two key resistance lines:
1 → The upper boundary of a descending channel drawn from significant price action patterns (marked in red). The relevance of this channel is confirmed by the price’s behaviour near its median line (dashed).
2 → A former trendline that served as support throughout 2024.
Therefore, a short-term correction cannot be ruled out following the sharp rally in MSFT shares, potentially tempering some of the enthusiasm generated by Microsoft’s strong quarterly report.
This article represents the opinion of the Companies operating under the FXOpen brand only. It is not to be construed as an offer, solicitation, or recommendation with respect to products and services provided by the Companies operating under the FXOpen brand, nor is it to be considered financial advice.

Fall Down to $70 ApproachingWith the RSI above average since mid-April 2025, the trend has been steadily rising up to $82 per share even breaking the highs from late February and March.
Price projected onto both (A and B) Inside pitchforks is well above the median line. In the pitchfork A the price is even directly touching the upper parallel line.
Reversal near the highest achieved price this year on 21st February is probable
Based on these indications, we can expect a fall to around $70 somewhere in the middle of May.
Key details:
RSI over "overbought" level
Price in both Inside pitchforks near the upper parallel line
Longer uptrend = breakdown necessary

Invest in STRL: Ride the Coming US Digital Infrastructure Surge◉ Abstract
Sterling Infrastructure (NASDAQ: STRL) is a top pick to benefit from America's digital infrastructure boom, with the sector expected to grow 26% annually through 2034. The company specializes in data centers, 5G networks, and smart city projects, supported by a $1 billion backlog and improving profit margins. While risks like regional market shifts and housing demand exist, STRL's fundamentals are strong—revenue grew 7% in 2024, debt is manageable, and its P/E ratio (17.9x) looks cheap compared to peers (70.5x).
Technically, the stock shows bullish patterns after pulling back 35% from highs. With government infrastructure spending rising and strategic acquisitions likely, STRL could deliver 35-40% returns in the next 12-14 months. A good option for long term investing!
Read full analysis here...
◉ Introduction
The U.S. digital infrastructure market, valued at approximately USD 140 billion in 2024, is expanding rapidly, with a projected CAGR of 26.4% through 2034. This growth is driven by factors like the expansion of 5G networks, increased demand for data centers, rising cloud services adoption, AI automation, and investments in smart cities and edge computing. The 5G infrastructure segment alone is expected to grow at a CAGR of 20.2%, reaching USD 17.26 billion by 2030. North America holds a 42.8% share of the global market.
◉ Key Trends and Opportunities
1. Data Centers: Demand continues to rise, driven by cloud computing, AI, and data-intensive applications. Power availability and location are becoming critical, with providers moving to secondary markets to secure reliable energy sources.
2. Fiber Networks: Expansion is underway to support new data centers and remote connectivity needs. Middle-mile and long-haul fiber, as well as fiber-to-the-home (FTTH), are key areas of investment and consolidation.
3. 5G and Wireless: Ongoing rollout of 5G networks is fueling growth in hardware and network densification, with increased activity expected in wireless infrastructure and tower markets.
4. Edge Computing and Smart Cities: The proliferation of IoT devices and smart city initiatives is driving demand for edge data centers and low-latency networks.
5. Mergers and Acquisitions: The market is seeing consolidation, especially in fiber and data center segments, as major players acquire smaller firms to expand their footprint and capabilities.
Today, we’ll focus on Sterling Infrastructure (STRL), a key player navigating the U.S. infrastructure market.
This report provides a detailed look at STRL's technical and fundamental performance.
◉ Company Overview
Sterling Infrastructure Inc. NASDAQ:STRL is a U.S.-based company specializing in e-infrastructure, transportation, and building solutions. It operates through three key segments: E-Infrastructure Solutions, which focuses on site development for data centers, e-commerce warehouses, and industrial facilities; Transportation Solutions, handling infrastructure projects such as highways, bridges, airports, and rail systems for government agencies; and Building Solutions, providing concrete foundations and construction services for residential and commercial projects. Originally founded in 1955 as Sterling Construction Company, the firm rebranded to its current name in June 2022. Headquartered in The Woodlands, Texas, the company serves a wide range of sectors, including logistics, manufacturing, and public infrastructure.
◉ Investment Advice
💡 Buy Sterling Infrastructure NASDAQ:STRL
● Buy Range - 148 - 150
● Sell Target - 200 - 205
● Potential Return - 35% - 40%
● Approx Holding Period - 12-14 months
◉ SWOT Analysis
● Strengths
1. Strong E-Infrastructure Backlog – With over $1 billion in backlog, Sterling has a robust pipeline of future projects, ensuring sustained revenue growth.
2. Higher-Margin Services Shift – The company’s strategic focus on higher-margin work (21% gross profit margin in Q4) improves profitability without relying solely on volume.
3. E-Infrastructure Growth Potential – Expected 10%+ revenue growth and 25%+ operating profit growth in 2025 position Sterling for strong earnings expansion.
4. Strategic M&A Opportunities – Strong liquidity allows for accretive acquisitions, enhancing market share and service offerings.
5. Share Repurchase Program – Active buybacks reduce outstanding shares, potentially boosting EPS and shareholder value.
● Weaknesses
1. Texas Market Transition Risks – Moving away from low-bid work in Texas may slow revenue growth in the Transportation segment if not managed well.
2. Revenue Loss from RHB Deconsolidation – Excluding $236 million in RHB revenue could distort growth metrics and reduce reported earnings.
3. Residential Market Pressures – A 14% decline in residential slab revenue (due to DFW affordability issues) could persist if housing demand weakens further.
4. Geographic Expansion Challenges – High costs and logistical hurdles in expanding data center projects outside core regions may limit growth opportunities.
5. Competitive Bidding & Acquisition Risks – Difficulty in securing profitable acquisitions or winning competitive bids could hinder margin and revenue growth.
● Opportunities
1. Data Center & E-Commerce Boom – Rising demand for data centers and distribution facilities presents long-term growth potential for E-Infrastructure.
2. Government Infrastructure Spending – Federal and state investments in highways, bridges, and airports could boost Transportation Solutions revenue.
3. Strategic Acquisitions – Pursuing complementary M&A deals could expand capabilities and market reach.
4. Diversification into New Regions – Expanding into underserved markets could reduce dependency on Texas and mitigate regional risks.
5. Operational Efficiency Improvements – Further margin expansion through cost optimization and technology adoption.
● Threats
1. Economic Slowdown Impact – A recession could reduce demand for residential and commercial construction, affecting Building Solutions.
2. Rising Interest Rates – Higher borrowing costs may pressure profitability and delay large-scale projects.
3. Labor & Material Cost Inflation – Increasing wages and supply chain disruptions could squeeze margins.
4. Intense Competition – Rival firms competing for the same infrastructure projects may drive down pricing and profitability.
5. Regulatory & Permitting Delays – Government approvals and environmental regulations could slow project execution.
◉ Revenue & Profit Analysis
● Year-on-Year
➖ FY24 sales reached $2,116 million, reflecting a 7.28% increase compared to $1,972 million in FY23.
➖ EBITDA rose to $334 million, up from $264 million in FY23.
➖ EBITDA margin improved to 15.8%, up from 13.4% in the same period last year.
● Quarter-on-Quarter
➖ Q4 sales decreased to $499 million, down from $593 million in Q3, but showed a slight increase from $486 million in Q4 of the previous year.
➖ Q4 EBITDA was $80.3 million, down from $105 million in Q3.
➖ Q4 diluted EPS saw a notable rise, reaching $8.27 (LTM), up from $5.89 (LTM) in Q3 2024.
◉ Valuation
1. P/E Ratio (Price-to-Earnings)
● Current vs. Peer Average
➖ STRL’s P/E ratio is 17.9x, much lower than the peer average of 70.5x, suggesting the stock is undervalued compared to peers.
● Current vs. Industry Average
➖ Compared to the broader industry average of 22.9x, STRL again looks relatively inexpensive at 17.9x.
2. P/B Ratio (Price-to-Book)
● Current vs. Peer Average
➖ STRL’s P/B ratio stands at 5.7x, slightly higher than the peer average of 5x, indicating overvaluation.
● Current vs. Industry Average
➖ Against the industry average of 3.6x, STRL’s 5.7x P/B ratio suggests a noticeable overvaluation.
3. PEG Ratio (Price/Earnings to Growth)
➖ STRL’s PEG ratio is 0.21, which means the stock appears undervalued relative to its strong expected earnings growth.
◉ Cash Flow Analysis
➖ Sterling Infrastructure's operating cash flow grew to $497 million in FY24, up from $479 million in FY23, showing steady financial strength.
◉ Debt Analysis
➖ The company's debt-to-equity ratio is 0.38, indicating a healthy balance sheet with manageable debt levels.
◉ Top Shareholders
➖ The Vanguard Group has significantly increased its investment in this stock, now owning an impressive 8.3% stake, which marks a 30% rise since the end of the September quarter.
➖ Meanwhile, Blackrock holds a stake of around 8% in the company.
◉ Technical Aspects
➖ On the monthly chart, the stock remains in a strong uptrend.
➖ On the daily chart, an Inverted Head & Shoulders pattern has formed, signaling a potential breakout soon.
➖ The stock is currently trading at about 35% below its all-time high, making it an attractive investment opportunity.
◉ Conclusion
Sterling Infrastructure (STRL) stands out as a strong investment candidate, backed by solid financial performance, a growing E-Infrastructure backlog, and a strategic focus on higher-margin projects. Its attractive valuation, healthy cash flow, and low debt levels provide further confidence in its growth potential. While there are challenges—such as market competition, geographic expansion hurdles, and economic uncertainties—Sterling’s strengths, including a robust project pipeline, strategic acquisitions, and exposure to high-growth sectors like data centers and 5G infrastructure, offer a favorable risk-reward balance. Overall, Sterling is well-positioned to benefit from the ongoing U.S. e-infrastructure boom, making it an attractive long-term investment opportunity.

IBM Share Price Falls Following Earnings ReportIBM Share Price Falls Following Earnings Report
Yesterday, after the close of the main trading session, International Business Machines (IBM) released its Q1 earnings report, exceeding Wall Street analysts’ expectations in several key areas. According to FactSet:
→ Earnings per share came in at $1.60 (forecast = $1.42), although this was below last year’s figure of $1.68.
→ Quarterly revenue reached $14.54 billion (forecast = $14.39 billion), marking a 1% increase year-on-year.
Initially, IBM shares rose on the news, but then dropped by approximately 6% during after-hours trading, according to Google Finance.
This suggests that today’s trading session may see IBM shares open below the $230 mark.
Market participants may have been disappointed by the following:
→ IBM’s mainframe business (large-scale computing systems designed for high-volume data processing) continued its decline, falling by 6% year-on-year.
→ Revenue from software and consulting divisions increased, but only by 3% compared to the same period last year.
→ The revenue forecast for Q2 stands at $6.6 billion – a 3% decline relative to the same quarter in 2024.
Technical Analysis of IBM Share Price
The chart shows signs of seller activity above the psychological level of $250. As indicated by the arrows, the price attempted several rallies above this level with varying momentum, but each time retreated back.
At the same time, price fluctuations formed a downward channel, which was extended to the downside in early April amid news regarding new tariffs in international trade.
Price stabilisation observed between 15–17 April suggests that supply and demand were temporarily balanced ahead of the earnings release. However, the negative market reaction to the report may shift sentiment and act as a catalyst for further price movement towards the lower boundary of the channel, around the key support level of $215.
This article represents the opinion of the Companies operating under the FXOpen brand only. It is not to be construed as an offer, solicitation, or recommendation with respect to products and services provided by the Companies operating under the FXOpen brand, nor is it to be considered financial advice.

Nintendo Co., Ltd. (NTDOY) – Powering Up for the Next Level Company Snapshot:
Nintendo OTC:NTDOY continues to dominate global entertainment with iconic franchises, cross-platform expansion, and the highly anticipated Switch 2 in 2025.
Key Catalysts:
Switch 2 Launch in 2025 🚀
150M+ Switch units sold → massive installed base
Backward compatibility + hardware upgrades could drive a super-cycle in hardware/software sales.
Franchise Diversification 💡
Digital Pokémon card game gaining momentum → strong in-app revenue potential
The Super Mario Bros. Movie surpassed SEED_TVCODER77_ETHBTCDATA:1B + in global box office 🍿
Expanding theme park partnerships (Universal Studios) enhance recurring brand engagement
Multi-Channel Monetization 📱🎢
Transitioning beyond consoles: movies, mobile, merchandise, and theme parks
Reinforces IP value and opens new revenue verticals
Investment Outlook:
✅ Bullish Above: $15.50–$16.00
🚀 Upside Target: $27.00–$28.00
📈 Growth Drivers: Switch 2 super-cycle, diversified IP monetization, and brand strength
🍄 Nintendo – Not just gaming, but a global entertainment powerhouse. #NTDOY #Switch2 #Nintendo

Nano Nuclear Energy – Pioneering Next-Gen Small Modular ReactorsCompany Overview:
Nano Nuclear Energy NASDAQ:NNE is revolutionizing clean, compact nuclear power with small modular reactors (SMRs), addressing data centers, remote sites, and disaster relief energy needs.
Key Catalysts:
ZEUS Microreactor Development 🚀
Successfully assembled first hardware, marking a key milestone toward commercialization & revenue generation.
Patent-Backed Innovation 🏆
Filed four new patents in February 2025 for its Annular Linear Induction Pump (ALIP).
Strengthens NNE’s edge in molten-salt & liquid-metal reactor technology.
Surging Global Electricity Demand ⚡
Aligns with the growing need for cost-effective, sustainable energy solutions.
Ideal for off-grid, military, and high-demand industrial applications.
Investment Outlook:
✅ Bullish Above: $21.50-$22.00
🚀 Upside Target: $44.00-$47.00
📈 Growth Drivers: Breakthrough SMR tech, patent leadership, and clean energy demand.
🔥 Nano Nuclear – Powering the Future, One Microreactor at a Time. #NNE #NuclearEnergy #CleanTech

Moderna (MRNA) Shares Plunge Nearly 9%Moderna (MRNA) Shares Plunge Nearly 9%
Moderna (MRNA) shares tumbled by approximately 8.9%, falling below $29—marking their lowest level since April 2020, when global markets were shaken by the COVID-19 pandemic.
Since the start of 2025, MRNA’s share price has declined by around 32%.
Why Did MRNA Shares Drop?
On Monday, MRNA led the decline among US biotech stocks following the resignation of Peter Marks, director of the FDA’s Center for Biologics Evaluation and Research. Marks had held this position for over a decade.
During Trump’s first term, Marks oversaw the rollout of COVID-19 vaccines and established guidelines for emerging treatments such as cell and gene therapy.
However, in Trump’s second term, Robert F. Kennedy Jr. now serves as Health Secretary. According to The Wall Street Journal, Marks criticised Kennedy’s stance on vaccines in his resignation letter, calling it “misinformation and lies.”
The pharmaceutical industry was already under pressure amid speculation that Trump’s tariff plans could extend to prescription drugs, which are typically exempt from such measures. Marks' departure has further intensified uncertainty regarding regulatory decisions under the new administration.
Technical Analysis of MRNA Shares
The chart indicates that:
➝ The stock remains in a downtrend that began with a sharp drop in August last year (reinforced by the moving average).
➝ Over the past five months, it has been forming a descending channel (marked in red).
➝ The lower boundary of this channel acted as support yesterday.
The formation of higher lows and highs (marked in blue) had given bulls some hope in March 2025. However, yesterday’s bearish gap appears to have shattered that optimism.
It is possible that the lower blue trendline and the median of the red channel will act as resistance moving forward, further darkening the outlook for MRNA’s share price—especially given the ongoing negative news surrounding the stock.
This article represents the opinion of the Companies operating under the FXOpen brand only. It is not to be construed as an offer, solicitation, or recommendation with respect to products and services provided by the Companies operating under the FXOpen brand, nor is it to be considered financial advice.

Comstock Resources (CRK) – Expanding U.S. Natural Gas DominanceCompany Overview:
Comstock Resources NYSE:CRK is accelerating natural gas production, reinforcing its position in the Western Haynesville play, a key U.S. gas region.
Key Catalysts:
Production Expansion & Strategic Acquisitions ⛽
Increasing drilling rigs from 5 to 7 for higher output.
Acquired 64,000 net acres in Haynesville, boosting reserves & market share.
Investment in Drilling & Midstream Infrastructure 🏗️
$1.0-$1.1 billion planned for 46 horizontal wells in 2025.
$130-$150 million allocated to midstream development, optimizing gas transport & profitability.
Market Strength & Growth Outlook 📈
Positioned to capitalize on rising U.S. natural gas demand & global LNG expansion.
Investment Outlook:
Bullish Case: We are bullish on CRK above $15.50-$16.00, supported by production growth & infrastructure investment.
Upside Potential: Our price target is $30.00-$31.00, driven by expansion, operational efficiency, and market strength.
🔥 CRK – Fueling the Future of U.S. Natural Gas. #CRK #NaturalGas #EnergyStocks

Harmony Gold Mining (HMY) – Strong Growth & Rising ProfitabilityCompany Overview:
Harmony Gold Mining NYSE:HMY continues to outperform expectations, delivering higher grades, cost efficiency, and production expansion.
Key Catalysts:
High-Quality Gold Extraction ⛏️
Underground recovered grades surged to 6.4 g/t, exceeding full-year guidance.
Reinforces HMY’s ability to extract high-quality ore.
Cost Efficiency & Rising Gold Prices 📈
All-in sustaining costs at ZAR 972,000/kg, well-managed despite inflationary pressures.
Gold’s safe-haven demand surging due to geopolitical tensions, boosting HMY’s margins.
Expansion & Future Growth 🚀
New high-grade mining site announced, set to enhance future production & revenue growth.
Investment Outlook:
Bullish Case: We remain bullish on HMY above $10.50-$11.00, supported by cost control & rising gold prices.
Upside Potential: Our price target is $17.00-$18.00, driven by high-margin production & increasing investor interest in gold.
🔥 HMY – Unlocking Gold’s Full Potential. #HMY #GoldMining #SafeHavenAsset

SNX Price ActionSNX is reporting its earnings tomorrow so below would be my estimated target.
It is expected to go as high as $132 and if the market supports could go higher .
Respecting all demand zones and expecting to eventually reach as high as $143

Boeing (BA) Share Price Rally Slows Near Key ResistanceBoeing (BA) Share Price Rally Slows Near Key Resistance
The Boeing (BA) stock chart shows that since its March low, the price has surged by approximately 25%, significantly outperforming the S&P 500 index (US SPX 500 mini on FXOpen).
This rally was driven by the news that Boeing secured a contract to develop the next generation of fighter jets for the U.S. Navy, beating its main competitor, Lockheed Martin.
According to Business Insider, this success is tied to Boeing’s development of the F-47 fighter jet under the Next Generation Air Dominance (NGAD) programme, which will bring the company contracts worth around $20 billion.
Technical Analysis of Boeing (BA) Stock
Throughout March, bulls managed to break through local resistance around $172 (as indicated by orange arrows). However, the rally has now reached a stronger obstacle—the $188 level:
This area marks the 2025 high.
Bulls also struggled to sustain prices above $188 in mid-2024.
With the RSI indicator nearing overbought levels, a correction after such an impressive two-month rally seems like a plausible scenario.
This article represents the opinion of the Companies operating under the FXOpen brand only. It is not to be construed as an offer, solicitation, or recommendation with respect to products and services provided by the Companies operating under the FXOpen brand, nor is it to be considered financial advice.

Zai Lab (ZLAB) – Biotech Growth & Profitability PathCompany Overview:
Zai Lab NASDAQ:ZLAB , a leading Chinese biotech firm, is on track for non-GAAP profitability by Q4 2025, driven by strong revenue growth & cost management.
Key Catalysts:
Financial Discipline & Expansion 💰
Operating losses fell 45% in Q4 2024, highlighting cost efficiency while scaling operations.
Analysts project $2 billion in annual revenue by 2028, reinforcing long-term value creation.
Blockbuster Drug Pipeline 💊
VYVGART generated $93.6M in its first full launch year, demonstrating strong adoption.
KarXT & bemarituzumab are key upcoming growth drivers, expanding ZLAB’s market footprint.
Investment Outlook:
Bullish Case: We are bullish on ZLAB above $34.00-$35.00, supported by financial execution & product expansion.
Upside Potential: Our price target is $54.00-$55.00, driven by strong product adoption & long-term growth trajectory.
🔥 Zai Lab – Unlocking the Future of Biotech Innovation. #ZLAB #Biotech #GrowthStocks

TTD LONG SET UP (The Trade Desk)Entry 1 $55.50
Entry 2 $45.50
Stop loss $35.50
Take profit 1- $65.50
(Close 25%)
Take profit 2- $75.50
(Close 50%)
Take profit 3-$90.50
(Close 75%)
Take profit 4-$110.50
(Close 100%)

BRK.B Share Price Reaches All-Time HighBRK.B Share Price Reaches All-Time High
As shown on the chart, the Class B shares of Berkshire Hathaway (BRK.B) have surpassed $520 for the first time in history. Notably, US stock indices remain below their record highs, further highlighting Warren Buffett’s investment acumen.
In late December, we noted that:
→ Berkshire Hathaway (BRK.B) had significantly reduced its position in Apple (AAPL) and refrained from making new purchases.
→ This suggested that Warren Buffett believed US stocks were overvalued and that a market correction was likely.
Once again, Buffett has been proven right. The Telegraph reports that the legendary investor correctly anticipated that Donald Trump would send Wall Street tumbling.
Additionally, Berkshire Hathaway’s latest earnings report, released yesterday, revealed that the company has been investing in the Japanese stock market—likely contributing to the optimism surrounding BRK.B shares.
Technical Analysis of BRK.B Shares
Key points for constructing the upward price channel are marked in blue, with:
→ The median line shifting from resistance to support (as indicated by arrows).
→ The price approaching the upper boundary of the channel, which could act as resistance.
→ The price action following the breakout above the psychological $500 level displaying strong bullish confidence.
Given these factors, if BRK.B shares enter a correction phase after the sharp rally (potentially reversing from the upper channel boundary), the $500 level is likely to act as support.
Another key support level is $483, which served as resistance in 2024 but has yet to be tested following the bullish breakout.
This article represents the opinion of the Companies operating under the FXOpen brand only. It is not to be construed as an offer, solicitation, or recommendation with respect to products and services provided by the Companies operating under the FXOpen brand, nor is it to be considered financial advice.

Spotify (SPOT) Shares Rise by Nearly 7%Spotify (SPOT) Shares Rise by Nearly 7%
According to the stock chart of music streaming giant Spotify (SPOT), the share price:
→ Increased by almost 7% by the end of trading on Friday.
→ Has surged approximately 28% since the start of 2025—one of the strongest performances in the stock market.
→ Has nearly doubled over the past 12 months.
Why Is Spotify (SPOT) Stock Rising?
As we noted late last year, investors have responded enthusiastically to the launch of the “Premium” plan, which offers higher-quality, ad-free music streaming and is expected to boost the company’s revenue.
Additionally, on Friday, Spotify announced that it had paid out around $10 billion in royalties to artists during 2024. By comparison, in 2014, this figure was “just” $1 billion.
Technical Analysis of Spotify (SPOT) Stock
Drawing a parallel with musical notes on a staff, the price action appears to be playing a "bullish melody," rising while interacting with a structure of four ascending lines that alternate between support (one of many examples marked with an arrow) and resistance.
In March, the price tested support at Line Two, which was reinforced by the psychological level of $500 per share. If bullish momentum remains strong, buyers may attempt to push the stock back into the range between Lines Three and Four.
Spotify (SPOT) Stock Forecast
According to TipRanks:
→ Analysts have an average 12-month price target of $671 for SPOT shares.
→ 17 out of 26 analysts recommend buying SPOT stock.
This article represents the opinion of the Companies operating under the FXOpen brand only. It is not to be construed as an offer, solicitation, or recommendation with respect to products and services provided by the Companies operating under the FXOpen brand, nor is it to be considered financial advice.

Rocket Companies (RKT) – Fintech-Driven Mortgage GrowthCompany Overview:
Rocket Companies NYSE:RKT is a fintech leader in mortgage and real estate solutions, leveraging AI-driven efficiency to enhance profitability and market share.
Key Catalysts:
Surging Profitability & Efficiency 💰
Adjusted EBITDA margin rose to 18% in Q4 2024, up from 2% a year prior, reflecting strong financial performance.
Rocket Mortgage Growth 📊
Net rate lock volume surged 47% YoY to $23.6 billion, far outpacing industry trends.
Expanding Servicing Portfolio 📈
The $593 billion servicing portfolio (+17%) provides stable revenue and cross-selling opportunities, acting as a hedge against rate volatility.
Resilient Market Share Expansion 🏆
Despite industry headwinds, Rocket continues to grow market share, proving its competitive edge in mortgage lending.
Investment Outlook:
Bullish Case: We are bullish on RKT above $11.80-$12.00, driven by profitability gains, market expansion, and portfolio strength.
Upside Potential: Our price target is $20.00-$21.00, reflecting sustained growth and operational efficiency.
🔥 Rocket Companies – Powering the Future of Mortgage & Fintech. #RKT #MortgageTech #FintechGrowth

$CDRE: Cadre Holdings – Riding the Safety Wave?(1/9)
Good afternoon, everyone! 😊
NYSE:CDRE : Cadre Holdings – Riding the Safety Wave?
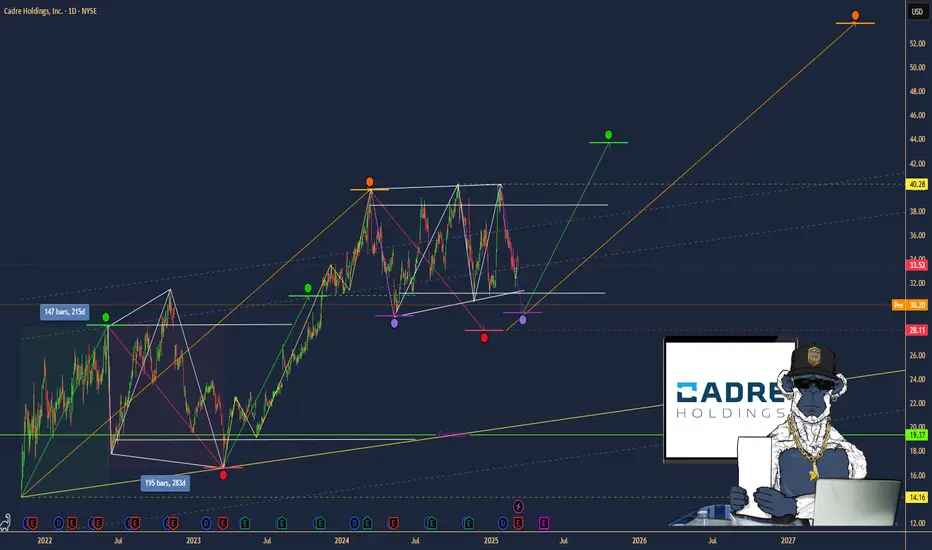
With CDRE at $30.20, is this stock a safe bet or a risky ride? Let's dive into the world of safety gear and see if Cadre's holdings hold up! 😎
(2/9) – PRICE PERFORMANCE
• Current Price: $30.20 as of March 12, 2025 😏
• Recent Moves: Down 11% from $34.02 a week ago 😬
• Sector Vibe: Safety equipment sector is growing, driven by stricter regulations and demand for safer workplaces. 📈
Short commentary: The stock's taken a hit, but the sector's looking good. Maybe it's just a temporary dip? 🤔
(3/9) – MARKET POSITION
• Market Cap: Approximately $1.23 billion 💰
• Operations: Manufacturing and distributing safety and survivability products for law enforcement, first responders, military, and now, the nuclear market. 🛡️
• Trend: Expanding into new markets with the acquisition of nuclear safety brands. 🚀
Short commentary: They're diversifying, which is usually a good sign. More markets mean more opportunities. 😉
(4/9) – KEY DEVELOPMENTS
• Acquisition of Carr's Engineering Limited's Engineering Division for nuclear safety solutions, announced on January 16, 2025. 📈
• Expected to close in the first half of 2025. ⌛
• Market Reaction: The stock has seen a recent dip, possibly reflecting integration concerns or broader market volatility. 😐
Short commentary: This should bring in new revenue streams and expand their international presence. Let's see how it plays out. 🌍
(5/9) – RISKS IN FOCUS
• Integration risks from the acquisition. ⚙️
• Supply chain disruptions. 🚚
• Regulatory changes in the nuclear sector. 📜
Short commentary: These are all things to keep an eye on, but every company has some risks. Stay vigilant! 🕵️
(6/9) – SWOT: STRENGTHS
• Strong reputation in safety equipment. 🏆
• Diverse product portfolio. 🌈
• Recent acquisition expanding into the nuclear market. 🌟
Short commentary: They're well-known and have a broad range of products, which is great. Keep up the good work! 👍
(7/9) – SWOT: WEAKNESSES & OPPORTUNITIES
• Weaknesses: Potential over-reliance on government contracts, integration challenges. ⚠️
• Opportunities: Growth in nuclear safety market, increasing global demand for safety products. 🌐
Short commentary: They need to manage their dependencies and make sure the acquisition goes smoothly, but there's a lot of potential for growth. Let's hope they nail it! 📈
(8/9) – CDRE at $30.20 – what's your call? 🗳️
• Bullish: Price could rise to $35+ soon, due to successful acquisition and sector growth. 🚀
• Neutral: Price remains steady, as the market digests the acquisition news. 😐
• Bearish: Price could drop to $25, due to integration risks and market volatility. 📉
Drop your pick below! 💬
(9/9) – FINAL TAKEAWAY
Cadre Holdings' $30.20 stance shows a robust portfolio and strategic expansion, but recent price dips and integration risks are concerns. Volatility’s our ally—dips are DCA treasure. Snag low, soar high!