JD.com (JD) AnalysisCompany Overview:
JD.com NASDAQ:JD is one of China’s leading e-commerce and logistics giants, rapidly expanding into cloud computing and AI-driven solutions. With a strong focus on efficiency, retail innovation, and policy-driven tailwinds, JD.com is well-positioned for long-term growth.
Key Catalysts:
Chinese Government's “Trade-In” Policy Boost 📈
The extended consumer electronics trade-in policy is expected to accelerate sales, driving demand across JD’s platform.
Full Acquisition of Dada Nexus 🚚
JD’s 100% ownership of Dada Nexus strengthens its last-mile delivery efficiency, improving logistics and customer satisfaction.
Omnichannel Expansion: JD MALL & JD E-Space 🏬
JD is expanding its offline footprint with JD MALL and JD E-Space, enhancing its omnichannel retail strategy for deeper customer engagement.
AI & Cloud Computing Growth ☁️
JD’s investment in cloud and AI positions it as a tech-driven e-commerce leader, driving new revenue streams.
Investment Outlook:
Bullish Case: We are bullish on JD above $34.00-$35.00, supported by policy tailwinds, logistics integration, and AI-driven retail innovation.
Upside Potential: Our price target is $60.00-$62.00, reflecting enhanced logistics, e-commerce expansion, and growing cloud adoption.
📢 JD.com—Innovating E-Commerce with AI & Logistics. #JD #ECommerce #AI #CloudComputing
Stockanalysis

Jyoti CNC Trying to make a comeback. Jyoti CNC Automation Ltd. engages in the provision of manufacturing solutions for computerized machine cutting tools. It operates under the Within India and Outside India geographical segments.
Jyoti CNC Automation Ltd. CMP is 1273.05. The Positive aspects of the company are Company with Low Debt, Company able to generate Net Cash - Improving Net Cash Flow for last 2 years and Companies with rising net profit margins. The Negative aspects of the company are extremely high Valuation (P.E. = 105.5), High promoter stock pledges, Increasing Trend in Non-Core Income and Companies with growing costs YoY for long term projects.
Entry can be taken after closing above 1293Targets in the stock will be 1337, 1368 and 1406. The long-term target in the stock will be 1434, 1463 and 1513. Stop loss in the stock should be maintained at Closing below 1157 or 1079 depending on your risk taking ability.
Disclaimer: The above information is provided for educational purpose, analysis and paper trading only. Please don't treat this as a buy or sell recommendation for the stock or index. We do not guarantee any success in highly volatile market or otherwise. Stock market investment is subject to market risks which include global and regional risks. I or my clients might have positions in the stocks that we mention in our posts. We will not be responsible for any Profit or loss that may occur due to any financial decision taken based on any data provided in this message. Do consult your investment advisor before taking any financial decisions. Stop losses should be an important part of any investment in equity.

Persistent can be persisted withPersistent Systems Ltd. is a technology services company. It engages in delivering digital business acceleration, enterprise modernization, and next generation product engineering services. The firm operates through the following segments: Banking, Financial Services & Insurance, Healthcare & Life Sciences, and Technology Companies & Emerging Verticals.
Persistent Systems Ltd. CMP is 6090.90. The Positive aspects of the company are Company with Low Debt, Company with Zero Promoter Pledge, Stocks Outperforming their Industry Price Change in the Quarter and Company able to generate Net Cash - Improving Net Cash Flow for last 2 years. The Negative aspects of the company are high Valuation (P.E. = 77), Companies with growing costs YoY for long term projects and MFs decreased their shareholding last quarter.
Entry can be taken after closing above 6094 Targets in the stock will be 6241, 6392 and 6547. The long-term target in the stock will be 6704 and 6810. Stop loss in the stock should be maintained at Closing below 5850 or 5566 depending on your risk taking ability.
Disclaimer: The above information is provided for educational purpose, analysis and paper trading only. Please don't treat this as a buy or sell recommendation for the stock or index. We do not guarantee any success in highly volatile market or otherwise. Stock market investment is subject to market risks which include global and regional risks. I or my clients might have positions in the stocks that we mention in our posts. We will not be responsible for any Profit or loss that may occur due to any financial decision taken based on any data provided in this message. Do consult your investment advisor before taking any financial decisions. Stop losses should be an important part of any investment in equity.

Vistra Corporation (VST) AnalysisCompany Overview:
Vistra Corporation NYSE:VST is a prominent U.S. integrated power company, combining retail and wholesale energy services. The company is actively transitioning toward renewable energy while maintaining a balanced portfolio with its conventional energy assets. Vistra's commitment to sustainability is reflected in the recent development of solar projects, positioning it well for the future of energy.
Key Growth Drivers
Renewable Energy Expansion:
Large Solar Projects in Illinois: Vistra's recent connection of two significant solar projects underscores its push to diversify into clean energy. This not only aligns with consumer demand for green energy but also supports regulatory trends favoring sustainability.
Strategic Diversification: By enhancing its portfolio with renewables, Vistra is positioning itself as a leading player in the transition to cleaner energy sources.
Operational Adaptability with Conventional Assets:
Baldwin Power Plant Extension (1,185 MW): The extension of this key asset through 2027 allows Vistra to maintain reliable power generation in the MISO market while transitioning to renewables. The move exemplifies strategic balance, ensuring reliability while supporting green energy goals.
Operational Flexibility: Vistra's ability to adapt its mix of assets enables it to capitalize on diverse market conditions.
Leadership and Regulatory Expertise:
Rob Walters Appointment: The recent addition of Rob Walters as an independent director strengthens Vistra’s regulatory and strategic leadership. This move enhances the company’s ability to navigate the evolving energy landscape, building investor confidence in its long-term strategy.
Investment Thesis:
Vistra is well-positioned to capitalize on both renewable energy growth and conventional energy reliability. The company's expansion into solar power and commitment to sustainable energy solutions, combined with the extension of key assets like Baldwin Power Plant, reinforces its competitive edge in a transforming energy market.
Bullish Case:
Target Price Range: $210.00–$220.00
Entry Range: $140.00–$142.00
Upside Potential: Strong growth potential due to diversified energy portfolio, renewable energy investments, and strategic leadership appointments.

Sanmina Corporation (SANM) AnalysisCompany Overview:
Sanmina Corporation NASDAQ:SANM is a global leader in advanced manufacturing solutions, offering end-to-end services from design and engineering to logistics. Serving diverse industries such as healthcare, defense, automotive, and cloud computing, the company has built a reputation for quality and innovation. Sanmina's broad industry reach mitigates dependency on any single market, ensuring stable and resilient financial performance.
Key Growth Drivers
Diverse Industry Exposure:
Sanmina serves a broad spectrum of industries, including:
Healthcare: Demand for high-quality medical devices and diagnostic equipment.
Defense & Aerospace: Focus on mission-critical electronics and systems.
Automotive: Growth in electric vehicles (EVs) and autonomous technology.
Cloud Computing: Rising demand for advanced data center and networking solutions.
This diversification ensures consistent revenue generation and reduces the impact of sector-specific downturns.
Strategic Joint Venture in India:
49.9% Stake in Reliance JV:
Sanmina's partnership with Reliance Strategic Business Ventures provides access to the fast-growing Indian market, which is a hub for electronics manufacturing and technological innovation.
This joint venture positions the company to capture significant market share in India, leveraging Reliance’s local expertise and Sanmina’s manufacturing capabilities.
Focus on High-Growth Sectors:
Sanmina's emphasis on medical, defense, and cloud computing aligns with global trends, including:
Increasing healthcare investments.
Rising defense budgets globally.
The ongoing digital transformation driving demand for cloud and edge computing solutions.
Financial Highlights and Tailwinds
Steady Revenue Growth:
Sanmina's diversified portfolio and global footprint have enabled consistent financial performance, even amid economic fluctuations.
Operational Excellence:
The company’s focus on operational efficiency, including cost optimization and technological innovation, supports profit margin improvements.
Position in Emerging Markets:
With the Indian government promoting domestic manufacturing, Sanmina’s joint venture is poised to benefit from favorable policies and strong regional demand.
Stock Outlook
Bullish Momentum Above $67.00-$68.00:
The company’s strategic positioning and exposure to high-growth sectors support a positive long-term outlook.
Upside Target: $100.00-$102.00, reflecting confidence in its ability to expand revenue and enhance shareholder value.
Institutional Confidence:
Sanmina’s strong financial foundation and growth prospects make it an attractive investment for both institutional and retail investors.
Conclusion
Sanmina is well-positioned to capitalize on its global reach, diverse industry exposure, and strategic presence in high-growth markets like India. Its focus on advanced manufacturing for critical industries ensures long-term relevance and growth potential.
📈 Recommendation: Bullish on SANM above $67.00-$68.00, targeting $100.00-$102.00.

LONG: Mahindra & Mahindra on the Rise: Targeting New Highs!🔍 Technical Analysis Report: NSE:M_M
Current Overview: 📈 NSE:M_M have shown a strong reversal from its recent low of ₹2,665.55. This recovery is significant as it has crossed the 0.382 Fibonacci retracement level, with the highest reference point being the level 1 Fibonacci at ₹3,214.95.
Key Observations:
Volume Analysis: Over the past 3-5 trading days, the stock has displayed consistent positive volume, indicating sustainable upward movement. 📊🔼
Critical Resistance: Since mid-June, the stock has been approaching a key resistance level. It briefly breached the 0.5 Fibonacci level yesterday but closed near the 0.382 Fibonacci level. 🚧
Price Movement: Today, the stock opened around the 0.382 Fibonacci level at ₹2,827.10 and is inching upwards. 📈
Technical Indicators:
MACD Analysis: The current MACD (Moving Average Convergence Divergence) shows an impending buying crossover. If market conditions stay favorable, we anticipate the MACD histogram turning green tomorrow, reinforcing the bullish trend. 🔄🟢
Target Levels:
🎯 First Target: ₹2,942.15
🎯 Second Target: ₹3,005.10
🚀 Extended Target (if resistance is broken): Around ₹3,100.00
Risk Management:
Primary Stop-Loss: ₹2,800.00 to protect against downside risk. ⚠️
Extended Stop-Loss: ₹2,720.85 for those accommodating broader market volatility. 📉
Conclusion: 🟢 If M&M opens in the green tomorrow, this will confirm the buying trend, potentially reaching the target levels mentioned above. However, cautious trading is advised, particularly around the set stop-loss thresholds, to manage inherent market risks effectively. ⚖️
#Hashtags: #MahindraAndMahindra #StockAnalysis #TechnicalAnalysis #FibonacciLevels #MACD #TradingInsights #StockMarketIndia #BullishTrend #InvestmentStrategy #RiskManagement #FinogentSolutions
Disclaimer: This analysis is for educational purposes only and should not be considered financial advice. Trading and investing involve significant risk, and you should conduct your own research or consult with a financial advisor before making any investment decisions.

Linde plc | LIN Linde, Timeless Excellence
Linde is a timeless business with even better stability than other basic materials businesses. The company works in gases and has a near-unbroken EPS growth record of 8% annually
Linde is a market leader, and if you invest in the company, you're investing in the world's largest company for industrial gases. The company was originally a result of a takeover of British BOC in 2006, and again the 2018 merger of Linde and Praxair, a US company.
On the macro upside, there was a 1) supportive regulatory framework in the USA and in the EU on green opportunities and hydrogen, 2) the Ukraine invasion was also a key catalyst towards the energy transition, 3) the EU chip acts with €43 billion in supporting funds as well as the United States Chips and Science Act development for a value of approximately $52 billion, and 4) higher needs of specialty gas in EV car. Related to the micro upside, the company is more diversified on a GEO revenue basis and sells different product solutions starting from cylinders to bulk liquid. In addition with a follow-up note titled "Positive News Ahead", we reported Linde's lower cost structure with the Frankfort delisting. Aside from removing the dual listing expenses, we positively view this development because US companies' P/E multiple are usually higher compared to the EU one.
To support our MACRO buy case recap, in the second quarter, Linde announced two new projects with Evonik and Heidelberg Materials (both companies covered by our internal team). The company signed a long-term agreement to produce green hydrogen for Evonik in a 9-megawatt alkaline electrolyzer plant in Singapore. With Heidelberg, Linde will build a large-scale carbon capture close to the Lengfurt plant in Germany. As a reminder, cement production is estimated to be responsible for around 7% of global
in 2022, APD's earnings per share were at $8.38, and Linde's earnings per share were fairly similar at $8.23. For 2023, Air Products and Chemical EPS guide a midpoint at $11.40 while Linde's EPS is forecasted at $13.65. Looking at the ROCE, in Q4 2022, APD stood at 11.7% and Linde at 13.4%. In the last quarter, APD’s ROCE was flat on the two-year comparison, while Linde’s after-tax ROCE reached 24.0%.
While there are some business & regional nuances between the two leading companies (for instance, APD is lacking U.S. packaged gas business), here at the Lab, we believe are more inclined toward Linde, particularly when organic growth has been fairly similar. Cross-checking APD and Linde's last quarter results, we should recall that on a comparable basis, the German player volumes were flat with an average selling price up by 8%. On the other hand, APD increased its volume by 6% with an increase in the average selling price of 8% too. APD adj EBITDA grew by 13% while Linde achieved a plus 11%. However, Linde's EU exposure is greater than APD. Therefore, this is supportive of Linde's bottom line. In numbers, excluding the Engineering divisional performance, Linde's EMEA sales reached $2,177 million and represented 29.72% of the company's total sales. Compared to Q1 2022 number, turnover grew by 10% and was driven by a 13% of cost pass-through increase.

Shopify Inc | SHOP & AIShopify stock has seen sideways momentum for the last few weeks despite posting good results in the recent quarter. One of the reasons is the bull run in early 2023 due to which the stock has seen over 60% jump in year-to-date. Shopify has been able to reignite revenue growth in the last few quarters and there are strong tailwinds that can help the company improve its topline. At the same time, Shopify has been able to improve the conversion of Gross Merchandise Value or GMV into revenue due to better services. Shopify’s GMV has increased 11x between the last quarter of 2016 and the last quarter of 2022. During this time, Shopify’s quarterly revenue base has increased from $130 million to $1.7 billion or 13x.
Shopify’s GMV for 2022 was $195 billion and rapid growth in this key metric should help the company improve monetization. The company has also undertaken some cost-cutting which is having a positive impact on the bottom line. Analysts have forecasted Shopify’s EPS at $1 for fiscal 2025 which means that the stock is trading 60 times the EPS estimate of 2025. However, better monetization and focus on cost optimization could help the company deliver good EPS growth in the next few quarters. The PS ratio is also at 12 which is significantly lower than the pre-pandemic years. Shopify stock can deliver good returns in the long term as the company adds new services and improves its GMV growth trajectory.
Shopify reported a GMV of $5.5 billion in December 2016 quarter. This has increased to $60 billion in the recent December 2022 quarter. Hence, Shopify’s GMV has increased to 11 times within the last seven years. On the other hand, Shopify’s revenue during the December quarter has increased by 13 times, from $130 million to $1.7 billion. This growth trend shows that the company is able to convert more GMV into actual revenue. One of the main reasons behind this trend is that Shopify is adding new services and it can charge customers a higher commission for these services.
Shopify’s GMV for 2022 was a staggering $195 billion. The company has been able to reignite revenue growth in the last few quarters. The YoY revenue growth hit a bottom of 15% in June 2022. Since then the YoY revenue growth has picked up again as the company faces easier comps. In the recent quarter, the company reported YoY revenue growth of over 30% which is quite high when we consider that the GMV base of Shopify is more than $200 billion.
The revenue growth will not build a bullish momentum for the stock unless the company can deliver sustainable profitability. During the pandemic years, Shopify’s revenue growth and high EPS helped the stock reach its peak. The company would need to focus on profitability in the next few quarters in order to rebuild a long-term bullish rally. Shopify has divested from its logistics business which should help improve the bottom line. We should also see better monetization of current services as the company tries to build new AI tools.
The EPS estimates for 2 fiscal years ahead have steadily improved in the last few quarters. According to current consensus, Shopify should be able to deliver EPS of $1 in fiscal year 2025. However, it is highly likely that Shopify will beat these estimates as the company launches new initiatives to improve monetization of its massive GMV base. Shopify’s trailing twelve months EPS during the peak of the pandemic went to $2.6. If the company can get close to this EPS rate by 2025, we should see a significant bullish run in the stock. The recent cost-cutting should also help the company improve the bottom line. We have seen a similar trend in all the Big Tech companies who have reported a rapid growth in EPS as their headcount was reduced.
While most analysts agree over the long-term revenue growth potential of Shopify, some of them are wary of the pricey valuation of the stock. Shopify is trading at 12 times its PS ratio. This is quite high when we compare with most of the other tech players and even Shopify’s peer like Wix (WIX), Etsy (ETSY), and others. However, it should be noted that Shopify’s PS ratio is significantly lower than the average PS multiple prior to the pandemic when the stock had an average PS ratio of over 20.
Shopify’s revenue estimates for 2 fiscal years ahead is close to $10 billion which is equal to annualized revenue growth of over 25%. If we look at this metric, Shopify stock is trading at 7 times the revenue estimate of fiscal year 2025. This looks reasonable if the company can also manage to improve its EPS trend over the next few years.
The long-term tailwind from ecommerce growth is still very strong. Shopify will benefit from an increase in GMV and a higher ecommerce market share in key markets. This should help the company gain pricing leverage over other competitors and also improve its monetization momentum
Shopify has reported a faster revenue growth rate compared to its GMV growth in the last few years. This shows that the company is able to charge higher rate for additional services. There has been an acceleration in revenue growth over the last few quarters. Shopify has also divested from logistics services which were pulling down the profitability of the company.
Shopify could deliver over 20% YoY revenue growth for the next few years as the company gains from strong tailwinds within the ecommerce business. If Shopify regains its earlier ttm EPS of $2 by 2025, we could see a strong bull run within the stock. While the stock is not cheap, it seems to be reasonably valued and longer-term investors could gain a better return from Shopify, making the stock a Buy at current price.

GDS Holdings (GDS) AnalysisCompany Overview:
GDS Holdings NASDAQ:GDS , a leading provider of high-performance data center solutions in China and Southeast Asia, is well-positioned to benefit from the exploding demand for data centers driven by cloud adoption, AI proliferation, and digital transformation across the region.
Key Catalysts:
Capital Injection to Fuel Growth:
GDS secured an upsized Series B equity raise of $1.2 billion, led by key backers like SoftBank Vision Fund and Kenneth Griffin, reflecting significant investor confidence.
The capital will enable GDS to develop over 1 GW of new data center capacity, fast-tracking its expansion plans across its key markets.
Strong Regional Demand:
Rising data consumption and the rapid digitalization in China and Southeast Asia position GDS to capitalize on surging regional demand for premium data centers.
GDS’s established expertise and strategic partnerships further solidify its leadership in these high-growth regions.
Long-Term Revenue Growth:
The investment supports GDS’s long-term ambitions to increase scale and market share, enabling sustainable revenue and margin growth.
Investment Outlook:
Bullish Outlook: We are bullish on GDS above the $17.50-$18.00 range, driven by its strong expansion strategy, favorable market conditions, and robust investor backing.
Upside Potential: Our upside target for GDS is $34.00-$35.00, reflecting substantial growth opportunities in data center infrastructure and the company’s ability to execute its large-scale development plans.
🚀 GDS—Expanding Capacity to Meet Surging Data Center Demand in Asia. #DataCenters #TechInfrastructure #GrowthMarkets

Taiwan Semiconductor Manufacturing Company (TSM) AnalysisCompany Overview:
TSMC NYSE:TSM is the world's leading semiconductor foundry, driving innovation in advanced chip manufacturing for critical technologies like AI, 5G, and emerging tech markets.
Key Growth Catalysts:
Strategic U.S. Expansion 🇺🇸
Arizona Fab: TSMC’s first 12-inch wafer fab begins 4 nm chip production this month, solidifying its North American presence.
$40 Billion Investment: Demonstrates TSMC's long-term confidence in U.S. chip demand and geopolitical supply chain security.
Production of 3 nm chips by 2028 highlights TSMC’s roadmap for next-gen leadership.
Rising Global Chip Demand 📈
Surging demand from AI, 5G, and cloud computing is driving industry-wide growth.
Key Clients: Apple, Nvidia, and AMD rely heavily on TSMC’s advanced node production capabilities.
Technological Leadership 🚀
4 nm Mass Production (Q1 2025): Positions TSMC at the forefront of advanced node production.
Continued R&D investments strengthen TSMC’s competitive edge in next-gen chip technologies.
Investment Outlook:
Bullish Stance: We are bullish on TSM above $172.00-$174.00, underpinned by its global dominance, strategic U.S. investments, and demand for advanced nodes.
Upside Target: Our price target is $255.00-$260.00, reflecting robust revenue growth, margin expansion, and rising semiconductor demand in AI and 5G markets.
🔹 Taiwan Semiconductor—Powering the Future of Tech! #TSM #Semiconductors #AI #5G

Tempur Sealy International (TPX) Analysis Company Overview:
Tempur Sealy International NYSE:TPX , renowned for its Tempur-Pedic, Sealy, and Stearns & Foster brands, is a dominant player in the global sleep solutions market. Its focus on premium product innovation and strategic global expansion underpins its robust growth trajectory.
Key Growth Drivers:
International Segment Growth:
A 12.4% increase in net sales reflects Tempur Sealy’s successful penetration into international markets, emphasizing its ability to diversify revenue streams and reduce dependence on North American sales.
North American Resilience:
Despite a slight sales decline, the North American segment achieved a 20.1% adjusted operating margin, highlighting efficient cost management and the enduring strength of its brands in a competitive market.
Innovation and Product Line Expansion:
Continued investment in cutting-edge sleep technology and new product launches enhances consumer appeal, supporting higher average selling prices (ASP) and boosting profitability.
Strong Brand Equity and Marketing Strategy:
Recognized as a leader in the industry, Tempur Sealy’s sustained investments in branding and marketing reinforce its dominant market position, driving customer loyalty and expanding market share.
Investment Outlook:
Bullish Stance: We are bullish on TPX above $48.00-$49.00, supported by its global expansion, operational efficiency, and innovative product strategy.
Upside Target: Our price target is $66.00-$68.00, reflecting anticipated revenue growth and market share gains as Tempur Sealy capitalizes on demand for premium sleep solutions.
🛏️ Tempur Sealy—Innovating Comfort, Globally! #TPX #SleepSolutions #GlobalGrowth

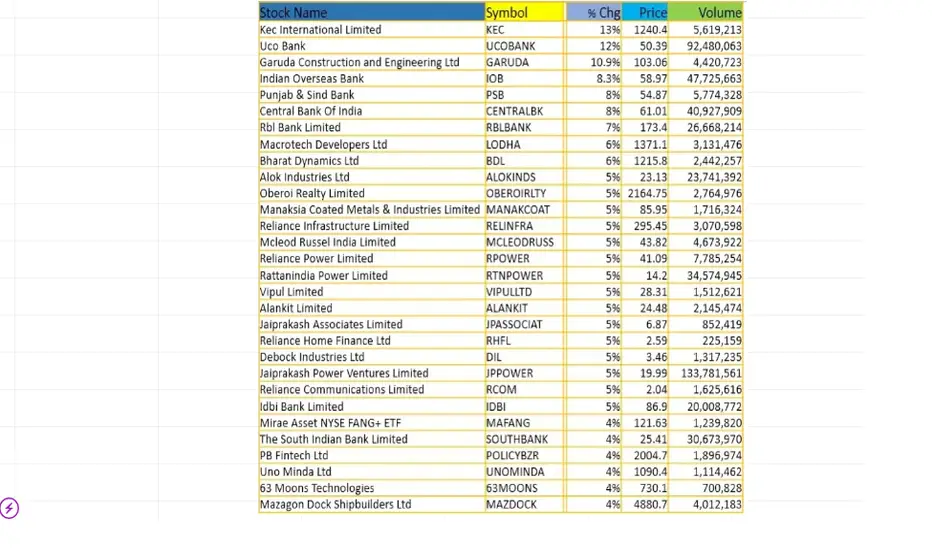
Intraday moving average stocks for (05/Dec/2024)Technical Analysis of Moving average stocks (05/Dec/2024)
follow for more updates and information
ELECON Ltd: Bullish Breakout in Motion – Ready for Your Next TrELECON Ltd is powering through with a strong bullish phase, backed by a bullish Marubozu candle and rising volume, signaling a solid uptrend. With technicals lining up for continued growth, this stock is turning heads!
📊 Donchian Bands: New highs, indicating potential breakouts ahead!
🔥 Bollinger Bands: Positive breakout confirms sustained upward momentum.
📈 RSI: At 59, there's room for more growth without hitting overbought territory.
🚀 Stochastic: A scorching 97 shows strong bullish momentum.
Looking for your next BTST or swing trade? ELECON is offering compelling potential with strong bullish momentum and excellent technical backing.
Don't miss out – keep an eye on ELECON for your next big move!

AST SpaceMobile (ASTS) Analysis Company Overview:
AST SpaceMobile NASDAQ:ASTS is pioneering a global space-based cellular broadband network, enabling mobile connectivity in remote and underserved areas. Its BlueBird satellite technology and strategic partnerships position ASTS as a disruptor in satellite communications.
Key Growth Drivers:
BlueBird Satellite Deployment:
Successful launch of the first five BlueBird satellites demonstrates AST’s ability to deliver innovative mobile broadband solutions globally.
This milestone positions the company to begin revenue generation through early adoption and partnerships.
Space Development Agency (SDA) HALO Program:
AST’s selection for the Highly Agile and Low Orbit (HALO) program opens a significant opportunity in the government and defense sectors.
This collaboration may lead to diversified revenue streams and further innovation in secure satellite communications.
Network Expansion Plans:
Agreements for up to 60 additional satellite launches in 2025-2026 will drive subscriber growth, enable broader network coverage, and accelerate revenue generation.
Strategic Partnerships and Investments:
Backing from industry giants like AT&T, Verizon, Google, and Vodafone highlights ASTS’s credibility and potential to reshape the global communications market.
These partnerships may also enhance access to established customer bases, supporting rapid scaling.
Investment Outlook:
Bullish Stance: We are bullish on ASTS above $19.50-$20.00, driven by its transformative technology, strategic partnerships, and extensive market opportunities.
Upside Target: Our price target is $40.00-$42.00, reflecting ASTS’s potential to capture a substantial share of the growing satellite broadband market.
🚀 AST SpaceMobile—Connecting the World, Beyond Boundaries! #SpaceTech #ASTS #SatelliteRevolution

Home Depot (HD) Analysis Company Overview:
Home Depot NYSE:HD , the largest home improvement retailer, leverages its extensive network of stores, robust e-commerce platform, and strategic acquisitions to maintain a dominant market position. The company continues to innovate and adapt to evolving consumer demands while capitalizing on macroeconomic trends.
Key Drivers of Growth:
Strategic Acquisition of SRS Distribution Inc.:
The acquisition enhances Home Depot’s market reach and diversifies its product offerings, particularly in specialty building materials.
This move is expected to drive revenue growth and profitability, strengthening its competitive position.
Projected Sales Growth:
Fiscal 2024 sales are projected to grow 3.8% year-over-year, showcasing Home Depot’s resilience and its ability to capitalize on consistent consumer demand for home improvement products.
Impact of Federal Reserve Rate Cuts:
Recent rate cuts are expected to stimulate housing activity, increasing demand for renovation and home improvement supplies, a key driver of Home Depot’s sales.
Strong Brand and Omni-Channel Presence:
Home Depot’s extensive store network and advanced e-commerce platform provide a seamless customer experience, offering resilience in both physical and digital retail markets.
The company’s reputation as a trusted supplier to both consumers and professionals enhances brand loyalty and repeat business.
Investment Outlook:
Bullish Stance: We are bullish on HD above $385.00-$390.00, supported by its strategic growth initiatives, favorable macroeconomic tailwinds, and robust operational performance.
Upside Target: Our price target is $570.00-$575.00, reflecting Home Depot’s strong growth potential and ability to navigate dynamic market conditions.
📈 Home Depot—Building the Future of Home Improvement! #HomeImprovement #GrowthStock #HD

NTDOY | NINTENDO & Nintendo Switch 2 🍄The next Nintendo console might arrive in 2024
Nintendo has reportedly demonstrated the Nintendo Switch 2 behind closed doors at Gamescom last month.some trusted developers got an early look at the Switch 2 and some tech demos of how games run on the unannounced system.
There was reportedly a demo of an improved version of Zelda: Breath of the Wild that’s designed to run on the more advanced hardware inside the Nintendo Switch 2, VGC corroborated the claims and revealed that Nintendo also showcased Epic Games’ The Matrix Awakens Unreal Engine 5 tech demo running on the type of hardware Nintendo is targeting for its next console. The demo reportedly used Nvidia’s DLSS upscaling technology with ray tracing enabled, suggesting Nintendo and Nvidia are working on a significant chip upgrade for this next-gen console. in July that a new Nintendo Switch is being planned for a 2024 release.
With 43 years of making immensely popular video games under its belt, you'd think that the video game pioneers at Nintendo probably have the business of success fully figured out.
But companies must change with the times and, according to Nintendo of America president Doug Bowser, that means finding a way to engage people with the legacy brand that might never pick up a video game controller.
Bowser spoke about what the company learned this year during the Nintendo Live event in Seattle, Wa. on Sept 1, referencing the enormous box office success of the "The Super Mario Bros. Movie" as one of its key indicators that Nintendo has the ability to reach an audience beyond those that naturally reach for a controller.
"We launched The Super Mario Bros. Movie, which very quickly became the second-largest box office grossing animated film of all time at $1.3 billion," Bowser said. "We launched The Legend of Zelda: Tears of the Kingdom, which, 18 million units later after a very brief period of time, it's one of our fastest launch titles ever, and then the event today. So it's really this drumbeat of activities, entertainment-based activities where we're trying to find ways to continue to introduce more and more people, not just players, but people to Nintendo IP… So that's what we're excited about."
Bowser also spoke about the launch of Super Nintendo World at Universal Hollywood, which delivered an impressive 25% bump to Comcast's Q1 earnings this year.
"And if I think about folding into the bigger strategy, this year has really been a very unique, and I dare say banner year for Nintendo in a lot of ways," Bowser said.Nintendo also continues to benefit from the sales of its aging Nintendo Switch console, with 129.53 million units sold worldwide. That makes it the company's second best-selling console of all time, right behind the handheld Nintendo DS, which sold 154.2 million units before it was discontinued in 2014.
The success of "The Super Mario Bros. Movie" drove rumors that another big feature film based on Nintendo's flagship Legend of Zelda series was coming as well, but Nintendo hasn't made a formal announcement about that ... yet.
Gaming is in the midst of an M&A arms race. The protracted pandemic has made sure of that. Companies from all sides of the market, Microsoft, Take Two, Sony to name a few, are cutting deals to secure content. The volume and scale of those deals point to where gaming is heading - the precipice of major shake-ups across its core commercial and distribution models. Microsoft's eye bulging $69 billion deal for Activision is a testament to that shift. Costly as the deal is, it's arguably a small price to pay to secure some of the biggest franchises in gaming: Call of Duty, Warcraft, Candy Crush and Overwatch. Even more so, considering those titles span a community of 400 million active monthly players. In other words, the deal is the boldest sign yet that content is the future of gaming, not consoles.
Should you invest in Nintendo?
The question comes down to whether you are willing to pay about SGX:40B for Nintendo's IP and potential earnings powers. To me, a company that continues to produce in-demand and profitable content is worth that price tag, especially after having generated a net profit of 432.7B yen, or $2.97B in FY2023. That's a P/E of about 13.5 after subtracting out Nintendo's current assets - not a hefty sum given everything Nintendo has going for it. Nintendo's strategy seems to be working, with The Super Mario Bros. Movie not only performing well on its own but also providing a boost to other Nintendo offerings. While there are concerns, there are also plenty of catalysts moving ahead. I am excited to see new Nintendo initiatives including more theatrical releases of their IP and their (positive) effects on the rest of the company's products.

NVDA Approaching Key Support Levels: Potential Pullback AheadFor NVIDIA (NVDA), heading into Monday, 11/18, the key support level to watch is $140.31. If the price breaks below this level, it could signal further downside, with the next significant support zone around $133.46. This would be a critical area for bulls to defend in order to prevent a deeper correction.
On the technical side, NVDA's recent price action suggests overbought conditions, as indicated by various momentum indicators such as the RSI and possibly the MACD nearing a bearish crossover. This setup raises the likelihood of a pullback or a consolidation phase as traders lock in profits or await fresh catalysts.

Amazon (AMZN) Long Side Analysis: Staying Bullish with CautionHey Again Folks!
Just wanted to share some thoughts on Amazon (AMZN) — I’m still leaning on the 🔵 long side here, but keeping a close eye on a few key levels.
Right now, AMZN is sitting around the $206-210 range, and it’s getting close to that resistance up at $213 🟢. This has been an important level before, so I’m watching to see if we can push through it with some strength 💪.
If we get a strong breakout above $213 🔥, I think the next target to watch is around $236 📈. That area lines up with previous highs and could be the next stop if this momentum keeps up. But if we hit resistance and start pulling back, I’ll be watching the lower boundary of the channel and especially the $190 zone for support 🛠️.

TG Therapeutics (TGTX) Analysis Company Overview: TG Therapeutics NASDAQ:TGTX is a biopharmaceutical company focused on developing and commercializing innovative treatments for B-cell diseases. The company's recent FDA approval of BRIUMVI for relapsing multiple sclerosis (RMS) marks a significant milestone, positioning TG Therapeutics to capitalize on a high-demand therapeutic area.
Key Developments:
FDA Approval of BRIUMVI: The approval of BRIUMVI for relapsing multiple sclerosis opens access to a substantial market, with nearly 1 million individuals in the U.S. affected by RMS. This provides a significant revenue opportunity, with BRIUMVI offering a new treatment option that has shown favorable efficacy, safety, and convenient dosing compared to existing therapies.
Positive Market Reception: CEO Michael S. Weiss has expressed strong confidence in BRIUMVI's potential, noting positive feedback from both healthcare providers and patients. The drug's unique value proposition lies in its twice-yearly dosing, which is more convenient than the monthly or quarterly regimens offered by competitors, enhancing patient compliance and satisfaction.
Pipeline and Future Growth: The successful launch of BRIUMVI is a testament to TG Therapeutics' ability to introduce novel treatments. This sets a strong foundation for future developments in B-cell disease therapies, as the company explores additional indications and expands its pipeline. BRIUMVI's performance in the market could pave the way for further advancements in TG Therapeutics' product offerings.
Investment Outlook: Bullish Outlook: We are bullish on TGTX above the $21.00-$22.00 range, driven by the strong initial reception of BRIUMVI and its potential to capture a significant share of the RMS market. Upside Potential: Our price target for TG Therapeutics is set at $34.00-$35.00, reflecting the expected revenue growth from BRIUMVI and the company's strategic positioning in the biopharma sector.
🚀 TGTX—Leading the Way in B-cell Disease Therapies! #BiopharmaInnovation #MultipleSclerosis #NewTreatmentOptions

AMAZON | AMZN , Jeff is back? While Jeff Bezos, fiancée Lauren Sánchez have star studded engagement party on his $500M yacht Amazon has just reported its Q2 2023 earnings result, EPS of 65 cents is not comparable on YoY basis nor to consensus due to the company booking some gains related to its Rivian Automotive, Inc (RIVN) investment. Revenue of $134.3 billion beat consensus by about 2% while showing a YoY jump by nearly 11%. As an immediate reaction, the stock is up nearly 8% after-hours, although this can turn on a dime.I wrote in my preview that Amazon still remains a revenue story and to pay attention to Q2's actual revenue and Q3's revenue guidance. Amazon hit it out of the park on both counts, with Q2 revenue showing an 11% jump and Q3 guidance of $138 billion to $143 billion, easily upping the consensus of $138.29 billion.
As a direct effect of the company reining in on its expenses, Amazon's Free Cash Flow ("FCF") in Q2 2023 improved to almost $8 billon compared to -$23.5 billion in Q2 2022. Headcount is now down 4% YoY.Advertising, which I've highlighted as the next growth driver in many of my past articles, was up 22% YoY. But, more importantly, resumed its upward trajectory on a quarterly basis. Advertising services revenue showed continuous QoQ improvement until the first blip in Q1 2023. Whether Q2's upsurge is a new trend remains to be seen, but it is encouraging that Q2 did not follow Q1 down. I am also glad that my prediction that advertising will cross $10 billion in sales came true.It appears like retail has finally stopped bleeding profusely to avoid wasting all the gains from AWS and Advertising. In my view, retail is just their medium to sell their ecosystem, and this is acceptable to me.
Heading into earnings, Amazon stock was almost into the oversold territory with a Relative Strength Index ("RSI") of 37. Revenue beat and guidance should help the stock garner more analyst support in the upcoming days, and I fully expect the stock's almost-oversold conditions to be in the stock's favor as it has plenty of room upwards technically. The after-hours move has also helped the stock clear all of the commonly used moving averages.AWS's revenue and operating income appeared to be on a perennial, mid-double-digit growth trajectory until recently. However, Q2 saw AWS' sales increase by "just" 12% while operating income fell by more than 5%. It is in this context that advertising services becomes even more important. While $22 billion is strong, it fell well short of the $25 billion I predicted, as the company aims to cross $100 billion in 2023 AWS revenue.
The stock was already up 50% YTD heading into earnings and the run appears set to continue. I am not complaining as a long, but it shouldn't surprise anyone to see the stock pullback from the highs given the market's shaky behavior the last few days.
Overall, Q2 results are much better than Q1, and that shows in the stock's performance, at least as shown in the after-hours price movement. However, Amazon has never been a single quarter or single year story for me. Amazon's ecosystem is enough reason for me to continue believing in the company long-term. The ability to leverage multiple products and services across the entire organization is not something any company can build overnight. In fact, even Amazon has taken nearly 30 years to be the company that it is today

Zebra Technologies (ZBRA) AnalysisCompany Overview: Zebra Technologies NASDAQ:ZBRA is making significant strides in AI integration within its enterprise asset intelligence and data capture services. The company is positioning itself as a leader in AI-driven innovation, with broad applications across multiple sectors. CEO Bill Burns has emphasized the strong rebound in enterprise mobile computing, reflecting sustained demand for Zebra’s innovative solutions.
Key Catalysts:
AI Integration: The use of AI in enterprise solutions is key to Zebra’s growth strategy. By enhancing its asset intelligence and data capture services, Zebra is positioned to lead in industries such as logistics, retail, and healthcare. AI can drive operational efficiency and improve decision-making for its clients, increasing demand for its advanced technologies.
Strong Enterprise Demand: The rebound in enterprise mobile computing across verticals signals long-term demand for Zebra's mobile and automation solutions, further solidifying its market leadership.
Productivity and Cost Savings Plan: Zebra’s 2024 Productivity Plan and Voluntary Retirement Plan aim to achieve $120 million in annualized savings, which should lead to improved profitability. These cost-saving measures could enhance both gross margins and operational efficiency, providing additional capital for strategic investments in technology.
Investment Outlook: Bullish Outlook: We are bullish on ZBRA above $340.00-$345.00, with the integration of AI in its services, coupled with cost-saving initiatives, positioning the company for sustained growth. Upside Potential: Our upside target is $500.00-$510.00, driven by increased AI adoption, strong demand in mobile computing, and the financial benefits from its productivity and cost-reduction efforts.
🚀 ZBRA—Leading the Future with AI and Enterprise Intelligence. #AIInnovation #MobileComputing #CostEfficiency

Sweetgreen (SG) AnalysisCompany Overview: Sweetgreen NYSE:SG is strategically expanding its footprint, with four new restaurant openings in Q2 2024, including a significant location in New Hampshire. This move underscores Sweetgreen's focus on untapped markets, aimed at driving revenue growth and geographic diversification.
Key Catalysts:
Expansion into New Markets: Opening in new locations, particularly in New Hampshire, demonstrates Sweetgreen’s plan to broaden its market presence, catering to new customer bases, which could meaningfully contribute to its overall growth trajectory.
Infinite Kitchen Concept: The successful implementation of the Infinite Kitchen at Penn Plaza is a game-changer. This innovative concept, which reduces wait times to under 3 minutes while improving operational efficiency, enhances the customer experience. As this model is scaled across more locations, Sweetgreen stands to gain from higher margins and enhanced customer satisfaction, potentially leading to stronger unit economics.
Operational Efficiency: The Infinite Kitchen rollout improves labor productivity and reduces operational bottlenecks, allowing Sweetgreen to serve more customers in less time. This could be instrumental in improving both top-line growth and profit margins.
Investment Outlook: Bullish Outlook: We remain bullish on SG above $33.00-$34.00, with the company's ability to innovate through its Infinite Kitchen model and its focus on entering new markets. Upside Potential: Our upside target for SG is $62.00-$64.00, driven by operational improvements, increased restaurant count, and scalability of its efficient kitchen model, which should bolster profitability and revenue growth.
🚀 SG—Innovating in Food Service with Efficiency and Expansion. #RestaurantGrowth #OperationalExcellence #Scalability

SoFi Technologies (SOFI) AnalysisCompany Overview: SoFi Technologies NASDAQ:SOFI has been on an impressive growth trajectory, with its member base increasing by over 40% year-over-year to reach 8.8 million as of Q2 2024. This significant expansion underscores SoFi's ability to not only acquire new members but also retain and cross-sell to its user base, positioning the company as a major player in the fintech space.
Key Catalysts:
Product Mix Shift: The strategic shift from a reliance on lending products to a broader array of financial services products—which now outpace lending offerings—boosts margins and improves the lifetime value of SoFi’s customers. This diversification strengthens the company's business model by lowering its dependence on traditional loans.
Earnings Momentum: SoFi has consistently outperformed earnings expectations, evidenced by 11 upward revisions in the last 90 days. This signals strong financial management and operational efficiency, which is expected to drive further investor confidence.
Growing Member Base: SoFi's ability to grow its member base at a 40% annual rate is a clear sign of the company’s competitive advantage in the fintech space, particularly through the seamless cross-selling of products across its ecosystem.
Investment Outlook: Bullish Outlook: We are bullish on SOFI above $9.00-$10.00, as the company’s ability to grow its member base and shift to higher-margin products sets the stage for sustained growth and stock appreciation. Upside Potential: Our upside target for SOFI is $15.00-$16.00, driven by strong earnings performance, a diversified product mix, and expanding membership, all of which contribute to improving financial metrics and stock valuation.
🚀 SOFI—Fintech Leader on a High-Growth Path. #Fintech #FinancialServices #EarningsOutperformance
