NASDAQ Literally nothing to stop this long-term rally.Earlier this month (June 07, see chart below), we explained why we were very bullish long-term on Nasdaq (NDX) using the 1W time-frame:
The price rose from 19000 to 19750 since and there is literally no technical sign of stopping this tremendous rally yet. In fact, today we bring you another approach, this time on the 2M time-frame.
As you can see, since November 2023, the index is past a Bullish Cross on the 2M LMACD. Since the 2008 Housing Crisis, we have witnessed this signal only 3 times. In fact, despite the presence of a relentless 14-year Channel Up, the most recent LMACD Bullish Cross resembles more the first one on November 2009.
Even though the 2022 Inflation Crisis wasn't the same as the 2008 Housing Crisis, it is the strongest we saw since then. The chart clearly shows that 2-year Channel Up (blue)/ Bullish Legs have been the vessels of upward continuation within the 14-year Channel, while at the same time +135% rises have been quite common.
As a result, before the current rally takes a breather, we can expect to see as high as even 24500 (+135% from the November 2022 bottom).
-------------------------------------------------------------------------------
** Please LIKE 👍, FOLLOW ✅, SHARE 🙌 and COMMENT ✍ if you enjoy this idea! Also share your ideas and charts in the comments section below! This is best way to keep it relevant, support us, keep the content here free and allow the idea to reach as many people as possible. **
-------------------------------------------------------------------------------
💸💸💸💸💸💸
👇 👇 👇 👇 👇 👇
Stockindex

DAX Medium-term buy opportunity.Last time we looked at DAX (FDAX1!) it gave us another successful sell signal (May 17) at the top (Higher Highs trend-line) of the 9-month Channel Up:
This time it is issuing a medium-term buy signal as after reaching the bottom (Higher Lows trend-line) of the 6-month Channel Up, while hitting and holding the 1D MA100 (green trend-line) as Support, it is sustaining an upward consolidation.
The last Higher Lows was also priced after the price broke below the 1D MA50 (blue trend-line) and supported by the 1D MA100 and the only confirmation left to form an identical pattern with that is for the 1D RSI to complete a Bullish Cross. As you can see, that has historically been a very reliable buy signal.
Our Target is 19300, which is marginally lower than the previous +8.80% Bullish Leg, but almost exactly on the Internal Higher Highs trend-line.
-------------------------------------------------------------------------------
** Please LIKE 👍, FOLLOW ✅, SHARE 🙌 and COMMENT ✍ if you enjoy this idea! Also share your ideas and charts in the comments section below! This is best way to keep it relevant, support us, keep the content here free and allow the idea to reach as many people as possible. **
-------------------------------------------------------------------------------
💸💸💸💸💸💸
👇 👇 👇 👇 👇 👇

S&P500 Seeking the 4H MA200 for buyersThe S&P500 index (SPX) got rejected at the top of the 2-month Channel Up that started on the April 19 bottom and is already below the 4H MA50 (blue trend-line). This is a sign of weakness for the short-term and based on the previous two times it did so, it might be accelerated.
Technically, the market should seek the 4H MA200 (orange trend-line) as the Support, which is what took place on the previous Higher Low of the Channel Up on May 31. We are looking to turn bullish again close to the 4H MA200 and target 5650, which is not only at the top of the Channel Up but also below the 2.618 Fibonacci extension, which is where the previous two Higher Highs got priced.
-------------------------------------------------------------------------------
** Please LIKE 👍, FOLLOW ✅, SHARE 🙌 and COMMENT ✍ if you enjoy this idea! Also share your ideas and charts in the comments section below! This is best way to keep it relevant, support us, keep the content here free and allow the idea to reach as many people as possible. **
-------------------------------------------------------------------------------
💸💸💸💸💸💸
👇 👇 👇 👇 👇 👇

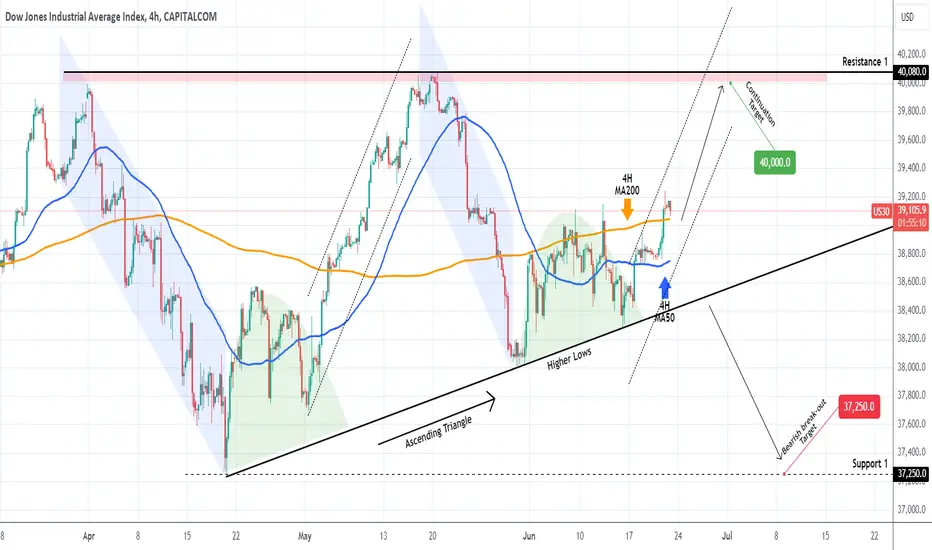
DOW JONES Ascending Triangle on its Bullish Leg.The Dow Jones Industrial Average Index (DJI) broke above the 4H MA200 (orange trend-line) again for the first time in a week, while holding the 4H MA50 (blue trend-line) as Support. The dominant pattern is an Ascending Triangle and the price action appears to be repeating the previous Leg.
As you can see, following the bottom formation and accumulation (green Arc) on the Higher Lows trend-line, which followed the Bearish Leg in the form of a Channel Down, the previous Bullish Leg (dotted Channel Up) posted a strong rally, the 2nd phase of the structure, towards the Ascending Triangle's top at 40080 (Resistance 1) when it broke above the 4H MA200.
As a result, we are bullish as long as the Asc. Triangle holds, targeting 40000 (just under Resistance 1, bottom of the red Zone). If however the price breaks below the Asc. Triangle (Higher Lows), we will take the loss on the buy and open a sell instead, targeting 37250 (Support 1).
-------------------------------------------------------------------------------
** Please LIKE 👍, FOLLOW ✅, SHARE 🙌 and COMMENT ✍ if you enjoy this idea! Also share your ideas and charts in the comments section below! This is best way to keep it relevant, support us, keep the content here free and allow the idea to reach as many people as possible. **
-------------------------------------------------------------------------------
💸💸💸💸💸💸
👇 👇 👇 👇 👇 👇
NASDAQ Minor correction expected. Where to buy?Nasdaq (NDX) has almost reached the top (Higher Highs trend-line) of the Channel Up pattern that started on the October 26 2023 bottom. The last Higher Low was made on April 19 2024 and ever since, a strong Bullish Leg in the form of a Channel Up (dotted), took the index above both the 1D MA50 (blue trend-line) and 4H MA200 (red trend-line).
Since the last Bullish Leg topped at around a +20.87% rise, we can assume that the price has entered a rejection zone. The only parameter left to confirm this, is for the 1D MACD to form a Bearish Cross. As you can see the two Bullish Legs are fairly similar so far in their price action.
With the late December 2023 - early January 2024 pull-back bottoming on the 4H MA200 exactly, we are expecting a symmetrical pull-back to that level again, where we will be looking to add more buys and target 20700 (top of the 8-month Channel Up).
-------------------------------------------------------------------------------
** Please LIKE 👍, FOLLOW ✅, SHARE 🙌 and COMMENT ✍ if you enjoy this idea! Also share your ideas and charts in the comments section below! This is best way to keep it relevant, support us, keep the content here free and allow the idea to reach as many people as possible. **
-------------------------------------------------------------------------------
💸💸💸💸💸💸
👇 👇 👇 👇 👇 👇

RUSSELL 2000 to bottom soon on the 1D MA200.Last time we looked into Russell 2000 (RUT) on May 09 (see chart below), we expected a technical pull-back, and even though it gave one more week of upside, the index eventually did start to correct:
As mentioned then, we see similarities with the January - March 2022 Bear Flag but mirrored (Bull Flag). That pattern made a Double Bottom on the 1980 Symmetrical Support. Since however it was the 1W MA50 (blue trend-line) that offered the most recent Support (April 15), we expect the Double Bottom to take place this time on it.
The 1955 symmetrical level would be a fair projection but overall even on the current prices, the index is a solid R/R buy opportunity. Our Target is intact at 2293 (Resistance 2).
-------------------------------------------------------------------------------
** Please LIKE 👍, FOLLOW ✅, SHARE 🙌 and COMMENT ✍ if you enjoy this idea! Also share your ideas and charts in the comments section below! This is best way to keep it relevant, support us, keep the content here free and allow the idea to reach as many people as possible. **
-------------------------------------------------------------------------------
💸💸💸💸💸💸
👇 👇 👇 👇 👇 👇

S&P500 targeting 5800 if this level breaks.The S&P500 index (SPX) recovered from April's correction and rebounded on the 1D MA50 (blue trend-line) during late May's consolidation, much faster than all previous corrective phases within the 1.5 year Channel Up pattern.
This has resulted in the price testing again the top of that pattern, first time since April 01. So far it has been there but failed to break it 3 days in a row, which is an accelerating bearish signal and as long as it fails to break upwards, we expect another test (at least) of the 1D MA50.
If it does break though, and since as mentioned this corrective phase has been faster and weaker than the previous, there are higher probabilities to do so, we expect a new (blue) short-term Channel Up to emerge. That would be similar to the previous 2 Bullish Legs of the long-term Channel Up, only this time it will break above it and take the index to a new dominant pattern.
In any case, our medium-term Target on that occasion wil be 5800, even though on the long-term, we can see at least a +25% rise from the April 19 bottom.
-------------------------------------------------------------------------------
** Please LIKE 👍, FOLLOW ✅, SHARE 🙌 and COMMENT ✍ if you enjoy this idea! Also share your ideas and charts in the comments section below! This is best way to keep it relevant, support us, keep the content here free and allow the idea to reach as many people as possible. **
-------------------------------------------------------------------------------
💸💸💸💸💸💸
👇 👇 👇 👇 👇 👇

NIKKEI Rather long way until it bottoms but then +60% upside!NIKKEI (NI225) offers a very consistent long-term pattern when you look at it on the 1W time-frame. As you can see periodically, every roughly 3 years it peaks and then starts to correct through a Channel Down pattern towards the 1W MA200 (orange trend-line).
It was only fairly recently (in relative 1W terms) that the index sought and found support on the 1W MA50 (blue trend-line) in October 2023, which started the rally leading to the March 2024 peak. If it follows the corrective Channel Down pattern that has been in effect for the past 9 years (since June 2015), then we may be a long way until we find a bottom.
The process doesn't need to be an aggressive one, in fact the last Channel Down that started in February 2021 bottomed in a long but very steady manner in March 2022 and even had a long bottoming process that lasted until January 2023 before the recent massive rally was initiated.
The 1W RSI patterns among those fractals are similar, so far in fact it is similar to the mid 2023 one that, as we mentioned above, 'only' corrected to the 1W MA50. As a result, we are expecting the current pull-back to extend at least as low as (near) the 1W MA50. If it breaks, we will only buy after it makes contact with the 1W MA200.
The Target process has also been very consistent throughout those 9 years, with each rise from the bottom being roughly over +60%. As a result, from the level the index bottoms, our Target will be at +60%.
-------------------------------------------------------------------------------
** Please LIKE 👍, FOLLOW ✅, SHARE 🙌 and COMMENT ✍ if you enjoy this idea! Also share your ideas and charts in the comments section below! This is best way to keep it relevant, support us, keep the content here free and allow the idea to reach as many people as possible. **
-------------------------------------------------------------------------------
💸💸💸💸💸💸
👇 👇 👇 👇 👇 👇

DOW JONES Bottom next week. 42k long-term Target.Dow Jones (DJI) is about to close a red 1W candle, staying flat basically for the 3rd week in a row. May's Double Top on Resistance 1 (40075) technically calls for an approach attempt on Support 1 (37250) but that doesn't invalidate the long-term bullish technicals as the pattern is a 1.5 year Channel Up.
As a result, with the 1W MA50 (blue trend-line) supporting since the week of October 30 2023, closing in towards Support 1, we expect a bottom to be formed next week when the 1W RSI makes a Lower Low. As you can see, the last 3 long-term buy opportunities have been when a 1W RSI Channel Down (blue) made a Lower Low.
Our long-term Target for Q4 is 42000 (just above the 0.786 Fibonacci Channel level).
-------------------------------------------------------------------------------
** Please LIKE 👍, FOLLOW ✅, SHARE 🙌 and COMMENT ✍ if you enjoy this idea! Also share your ideas and charts in the comments section below! This is best way to keep it relevant, support us, keep the content here free and allow the idea to reach as many people as possible. **
-------------------------------------------------------------------------------
💸💸💸💸💸💸
👇 👇 👇 👇 👇 👇

NASDAQ Short-term pull-back possible. Know when to buy.Nasdaq (NDX) delivered an excellent buy signal last time we looked at it (May 30, see chart below) and is approaching our 19900 Target:
The pace of this rise however has been very strong, certainly stronger than the December 2023, which we used as fractal comparison, and the price already reached the top (Higher Highs trend-line) of the 1.5 year Channel Up.
At the same time, it hit the 2.0 Fibonacci extension level from the last Lower High before the break-out, while the 1D RSI reached the 78.00 overbought level. On the past fractal, the short-term correction that followed, bottomed on January 05 2024 on the 1.5 Fib ext.
As a result, we can't dismiss a short-term pull-back now but we will expect it to find Support around 19050 (Fib 1.5). We will use it as a new buy entry and target 20500 (the 2.618 Fibonacci extension) as we expect a new, more aggressive Channel Up to emerge.
-------------------------------------------------------------------------------
** Please LIKE 👍, FOLLOW ✅, SHARE 🙌 and COMMENT ✍ if you enjoy this idea! Also share your ideas and charts in the comments section below! This is best way to keep it relevant, support us, keep the content here free and allow the idea to reach as many people as possible. **
-------------------------------------------------------------------------------
💸💸💸💸💸💸
👇 👇 👇 👇 👇 👇

NIFTY Major bullish break-out targeting 24650?The Nifty 50 Index (NIFTY) respected the former 6-month Channel Up last time we looked at it (April 30, see chart below), hit our 23100 Target and then broke the pattern:
What the latest technicals show is that the emergence of the Megaphone pattern on the 1D time-frame, resembles that of July - November 2023. That structure made a -7.00% that found Support on the 1D MA200 (similar to the current one) and then started a strong rally that broke above the Megaphone.
On the current fractal, Nifty is about to break above the Megaphone's Higher Highs trend-line and if it continues to replicated December 2023, then it should peak a little above the 2.0 Fibonacci extension. We will set a Target a little lower however, when it completes a +15.67% rise, i.e. at 24650.
On a side-note, if at any given moment, the 1D RSI hits its Support Zone, we will buy it. It has given the most optimal Buy Signal the past 3 months.
-------------------------------------------------------------------------------
** Please LIKE 👍, FOLLOW ✅, SHARE 🙌 and COMMENT ✍ if you enjoy this idea! Also share your ideas and charts in the comments section below! This is best way to keep it relevant, support us, keep the content here free and allow the idea to reach as many people as possible. **
-------------------------------------------------------------------------------
💸💸💸💸💸💸
👇 👇 👇 👇 👇 👇

FTSE on a 1-month correction. Is it over?Great display of compliance to technical dynamics by FTSE 100 (UK100) on our previous analysis (April 29, see chart below) as after hitting our 8350 Target it got rejected exactly at the top (Higher Highs trend-line) of the long-term +2 year Channel Up:
The corrective pattern broke yesterday below the 1D MA50 (blue trend-line) for the first time since April 19, which technically opens the way for a test of the next Support level, the Higher Lows Zone.
As you can see, this Zone has been providing Support (and the most optimal buy entry) since the January 17 Low. As a result, as long as the 1D MA100 (green trend-line) is holding, we will buy the next Higher Lows contact and target 8350 (Lower Highs projection similar to February 07 2024 and October 17 2023).
-------------------------------------------------------------------------------
** Please LIKE 👍, FOLLOW ✅, SHARE 🙌 and COMMENT ✍ if you enjoy this idea! Also share your ideas and charts in the comments section below! This is best way to keep it relevant, support us, keep the content here free and allow the idea to reach as many people as possible. **
-------------------------------------------------------------------------------
💸💸💸💸💸💸
👇 👇 👇 👇 👇 👇

SPY still bullish, holding both the 1D MA50 and MA100.Last time we looked at SPY (May 01, see chart below) we gave a strong buy signal following the 1D MA100 (green trend-line) bottom and we are already well into new All Time High territory:
As you can see, the price hit the top of the short-term (dotted) Channel Up and pulled back to the 1D MA50 (blue trend-line) again. This inability to break above the Channel Up, leads us to believe that it will continue to be the dominant pattern, instead of the long-term (blue) Channel Up, and will dictate the price action higher but only gradually.
Another test of the 1D MA100 is possible under those conditions that will allow for a smooth hit on our 555.00 long-term Target.
If however the dashed line holds, it is possible to see an even more aggressive Channel Up materializing, in which case we will move our Target even higher at 580.00, in order to represent a Bullish Leg similar to January - February 2024.
-------------------------------------------------------------------------------
** Please LIKE 👍, FOLLOW ✅, SHARE 🙌 and COMMENT ✍ if you enjoy this idea! Also share your ideas and charts in the comments section below! This is best way to keep it relevant, support us, keep the content here free and allow the idea to reach as many people as possible. **
-------------------------------------------------------------------------------
💸💸💸💸💸💸
👇 👇 👇 👇 👇 👇

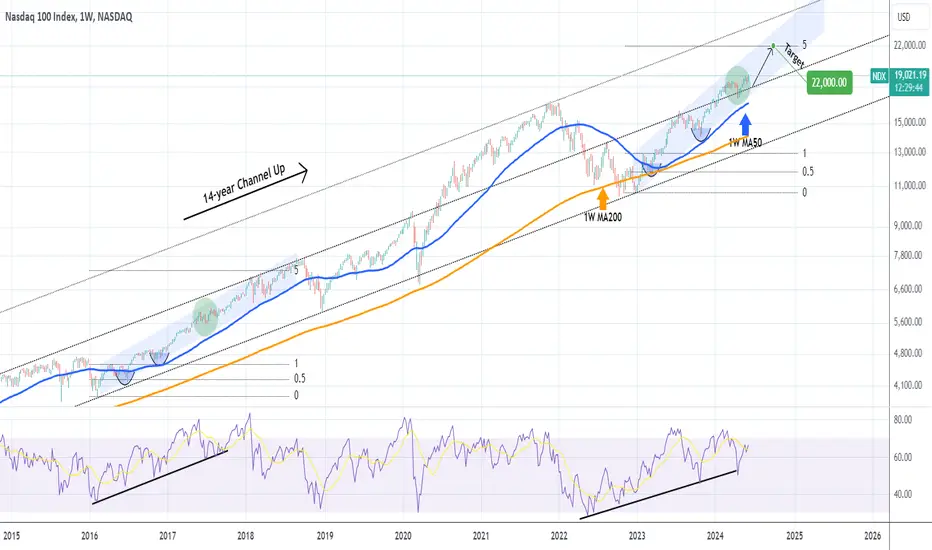
NASDAQ will continue to rise on this pattern repetition.Nasdaq (NDX) has been trading within a (blue) Channel Up since basically the market bottom of the inflation crisis in October 2022. On the bigger picture, this is the technical Bullish Leg of the 14-year Channel Up and is supported by the 1W MA50 (blue trend-line) since March 13 2023.
Based on the 1W RSI pattern, we have previously seen such Bullish Leg within the long-term Channel Up supported by the 1W MA50, back on the February 08 2016 bottom. As you can see on this 1W chart, both Bullish Legs (Channel Up patterns) made their first pull-back on the 0.5 Fibonacci retracement level. In June 2018, the previous fractal reached the 5.0 Fibonacci extension and shortly after, the index corrected aggressively back at the bottom of the 14-year Channel Up.
We expect Nasdaq to hit again the 5.0 Fib ext sooner or later but most likely before the year is over. This gives us a medium-term Target of 22000.
-------------------------------------------------------------------------------
** Please LIKE 👍, FOLLOW ✅, SHARE 🙌 and COMMENT ✍ if you enjoy this idea! Also share your ideas and charts in the comments section below! This is best way to keep it relevant, support us, keep the content here free and allow the idea to reach as many people as possible. **
-------------------------------------------------------------------------------
💸💸💸💸💸💸
👇 👇 👇 👇 👇 👇
S&P500 Short-term accumulation before strong rise.The S&P500 index (SPX) has turned sideways since practically May 16 and, supported by the 1D MA50 (blue trend-line), is consolidating. Even though this consolidation is taking place at the top of the 1.5 year Channel Up (Fibonacci 0.0 - 0.236 range), it is similar in some way to the accumulation of April - May 2023 (also a little like November - December 2023), which was again supported by the 1D MA50.
As a result, as long as the price remains above the 1D MA100 (green trend-line), which provided the crucial Support on April 19 and started the recovery from the -6.65% decline, we expect a similar Channel Up to start when the accumulation ends. Our short-term Target is 5500 (top of 1.5 year Channel Up).
-------------------------------------------------------------------------------
** Please LIKE 👍, FOLLOW ✅, SHARE 🙌 and COMMENT ✍ if you enjoy this idea! Also share your ideas and charts in the comments section below! This is best way to keep it relevant, support us, keep the content here free and allow the idea to reach as many people as possible. **
-------------------------------------------------------------------------------
💸💸💸💸💸💸
👇 👇 👇 👇 👇 👇

DOW JONES The bleeding may not be over. How low will it go?On our last Dow Jones (DJI) analysis (May 24, see chart below), we called for the high probability of a bearish break-out below the Channel Down, following the 1D MACD Bearish Cross (similar to April 02):
As you can see, Dow delivered, so our 38350 Target got hit, with minimum losses on the buy position at the bottom of the Channel Up. Yesterday's rejection on the 1D MA50 (blue trend-line) though, is far from ideal and opens the way for more downside.
The chart shows DJI's long-term pattern, which has been a Channel Up since the October 03 2022 market bottom. The periodic corrections through Bearish Legs have both declined by -9.25%, a striking resemblance indeed. Yesterday's 1D MA50 rejection basically resembles those of the past Bearish Legs on March 06 2023 and October 17 2023.
Ahead of the 1D MA50/ 100 Bearish Cross, which could be completed by tomorrow, there is high probability for a deeper Low, at least as Low as Support 1 (37250). This would be ideal as it would also make contact with the 1D MA200 (orange trend-line) for the first time in 7 months (since November 03 2023)!
After that though, we will turn into long-term buyers again, even though that wouldn't complete the -9.25% decline of the previous Bearish Legs, but in terms of R/R would be acceptable enough to aim for 40000 before the Channel Up goes for a Higher High.
-------------------------------------------------------------------------------
** Please LIKE 👍, FOLLOW ✅, SHARE 🙌 and COMMENT ✍ if you enjoy this idea! Also share your ideas and charts in the comments section below! This is best way to keep it relevant, support us, keep the content here free and allow the idea to reach as many people as possible. **
-------------------------------------------------------------------------------
💸💸💸💸💸💸
👇 👇 👇 👇 👇 👇

NASDAQ Another 2 weeks of consolidation possibleNasdaq (NDX) made the bullish break-out that we largely expected as described on our previous idea (May 15, see chart below) and almost hit our 19100 Target:
Right now we see a short-term pull-back, which based on the November - December 2023 fractal (green ellipse), should be at worst a 2 week consolidation. The 1D RSI also shows that symmetrically we should be at a point similar to December 06 2023.
That fractal then rose for a Higher High on the 2.236 Fibonacci extension. As a result, our medium-term Target is now set at 19900 (just under the 2.236 Fib and top of the 1.5 year Channel Up).
-------------------------------------------------------------------------------
** Please LIKE 👍, FOLLOW ✅, SHARE 🙌 and COMMENT ✍ if you enjoy this idea! Also share your ideas and charts in the comments section below! This is best way to keep it relevant, support us, keep the content here free and allow the idea to reach as many people as possible. **
-------------------------------------------------------------------------------
💸💸💸💸💸💸
👇 👇 👇 👇 👇 👇

S&P500 Buy opportunity on 4H.The S&P500 index is recovering from the last Higher Low at the bottom of the Channel Up, which even broke below the 4H MA50 (blue trend-line) last Thursday for the first time since May 02. The 4H MACD is forming the first Bullish Cross since that very same date, which was also a recovery sequence after a bottom on the Channel Up pattern.
Having also breached into the Ichimoku Cloud and rebounded, we expect a similar short-term rally towards the top (Higher Highs trend-line) of the Channel Up. That rally's first stop was on the 1.618 Fibonacci extension. As a result, our current Target is 5400 (marginally below the 1.618 Fib).
-------------------------------------------------------------------------------
** Please LIKE 👍, FOLLOW ✅, SHARE 🙌 and COMMENT ✍ if you enjoy this idea! Also share your ideas and charts in the comments section below! This is best way to keep it relevant, support us, keep the content here free and allow the idea to reach as many people as possible. **
-------------------------------------------------------------------------------
💸💸💸💸💸💸
👇 👇 👇 👇 👇 👇

DOW JONES Should this Bearish Cross worry us?The Dow Jones Industrial Average Index (DJIA) hit our 40000 Target that we set on our May 06 idea (see chart below) and after that experienced a sharp pull-back:
So far this is within the lines of a natural technical correction correction towards the 1D MA50 (blue trend-line), which during uptrends tends to be re-tested as a Support. Notice also that this is where the 0.382 Fibonacci level is, an important technical Support during pull-backs.
As long as it holds, the Channel Up has the much needed Higher Low that can enable it to move to a Higher High. We expect that to be around 41500 (+6.30% rise, similar to the previous Bullish Leg).
On the other hand, since the 1D MACD completed a Bearish Cross yesterday, we need to consider the possibility of a deeper pull-back, as the last 1D MACD Bearish Cross (April 02), delivered a -6.88% decline. As a result, if the 1D MA50 breaks though, we will take that small loss and go on a short-term sell instead, targeting 38350 (0.618 Fibonacci level).
-------------------------------------------------------------------------------
** Please LIKE 👍, FOLLOW ✅, SHARE 🙌 and COMMENT ✍ if you enjoy this idea! Also share your ideas and charts in the comments section below! This is best way to keep it relevant, support us, keep the content here free and allow the idea to reach as many people as possible. **
-------------------------------------------------------------------------------
💸💸💸💸💸💸
👇 👇 👇 👇 👇 👇

S&P500 Short-term buy opportunityThe S&P500 (SPX) index gave us an excellent bottom buy signal on May 02 (see chart below) that comfortably hit our 5200 Target:
The pattern that prevailed is a Channel Up, holding since the start of the month. As long as it is supported by the 4H MA50 (blue trend-line) and the 4H RSI Rectangle holds, we expect the current consolidation to give a similar 2.0 Fibonacci extension Target at 5370, such as the May 10 High.
-------------------------------------------------------------------------------
** Please LIKE 👍, FOLLOW ✅, SHARE 🙌 and COMMENT ✍ if you enjoy this idea! Also share your ideas and charts in the comments section below! This is best way to keep it relevant, support us, keep the content here free and allow the idea to reach as many people as possible. **
-------------------------------------------------------------------------------
💸💸💸💸💸💸
👇 👇 👇 👇 👇 👇

DAX Another perfect sell opportunity emerges like the last one.DAX (FDAX1!) gave as an excellent sell opportunity last month (April 11, see chart below) that hit the 17700 Target and shortly after rebounded:
The index yet again flashes a sell signal as the price got rejected yesterday exactly at the top (Higher Highs trend-line) of the 1.5 year Channel Up. In symmetrical terms, this is similar to the Higher High rejection of May 19 2023, which pulled back to the 1D MA50 (blue trend-line).
The 1D MACD is also inside a similar Falling Wedge pattern and will confirm the sell signal once it makes a Bearish Cross. Our Target now is 18350.
-------------------------------------------------------------------------------
** Please LIKE 👍, FOLLOW ✅, SHARE 🙌 and COMMENT ✍ if you enjoy this idea! Also share your ideas and charts in the comments section below! This is best way to keep it relevant, support us, keep the content here free and allow the idea to reach as many people as possible. **
-------------------------------------------------------------------------------
💸💸💸💸💸💸
👇 👇 👇 👇 👇 👇

S&P500 Ultimate 20-year cheat-sheet! See when to sell!The S&P500 index (SPX) is having another very strong bullish month, following the red 1M candle of April, which was the first after 5 straight months of profit. Many might be wondering why a deeper correction didn't come at this stage and the answer is simply that it's not yet the time for it.
We present to you today what we call the "Ultimate stock market cheat sheet" which is simply an observation of the market's Cycles of roughly the past 20 years. As you can see, since the 2007/08 Housing Crisis, there is a very consistent pattern and the Sine Waves display perfectly that frequency.
More specifically, we can see that a rough frequency when the S&P500 tops is 3.5 years. Every 42 months (3.5 years) the index either hits a High or already has and is on a minor decline before a stronger correction comes, which is always within the technical standards of pull-backs within a greater Bull Cycle expansion. Roughly also, the sell signal is given after the 1M RSI breaks below its MA trend-line having previously been on overbought territory (above 70.00).
As a result, the market still has another full year until a sell signal emerges (July 2025). Of course it is advisable to be off stocks before that date just to be on the safe side but the important conclusion of this finding is that investors can continue feel safe buying for several more months.
What's your take on this? Do you still feel safe buying?
-------------------------------------------------------------------------------
** Please LIKE 👍, FOLLOW ✅, SHARE 🙌 and COMMENT ✍ if you enjoy this idea! Also share your ideas and charts in the comments section below! This is best way to keep it relevant, support us, keep the content here free and allow the idea to reach as many people as possible. **
-------------------------------------------------------------------------------
💸💸💸💸💸💸
👇 👇 👇 👇 👇 👇

NASDAQ Invalidated the bearish scenario and marching to 19100.Three weeks ago (April 23, see chart below) we called for a relief rally on Nasdaq (NDX) 18000, right when the price was at the bottom of its correction:
The Target was the top of the Channel Down, which was the correction pattern and just below the 0.786 Fibonacci retracement level which during the July - October 2023 correction was where the uptrend was rejected and pushed the Channel Down to a Lower Low.
Well now this bearish sentiment has been invalidated as the index broke above both the top (Lower Highs trend-line) of the Channel Down, as well as the 0.786 Fib. This gives form to a Channel Up. The 1D RSI sequence is similar with the post October 26 2023 bottom and we might be in a similar situation as the November 07 2023 break-out (ellipse).
That bullish break-out topped on the 1.618 Fibonacci extension (blue pattern) before the next short-term pull-back. As a result we formulate our medium-term Target to 19100 (just below the 1.618 Fib ext).
-------------------------------------------------------------------------------
** Please LIKE 👍, FOLLOW ✅, SHARE 🙌 and COMMENT ✍ if you enjoy this idea! Also share your ideas and charts in the comments section below! This is best way to keep it relevant, support us, keep the content here free and allow the idea to reach as many people as possible. **
-------------------------------------------------------------------------------
💸💸💸💸💸💸
👇 👇 👇 👇 👇 👇
