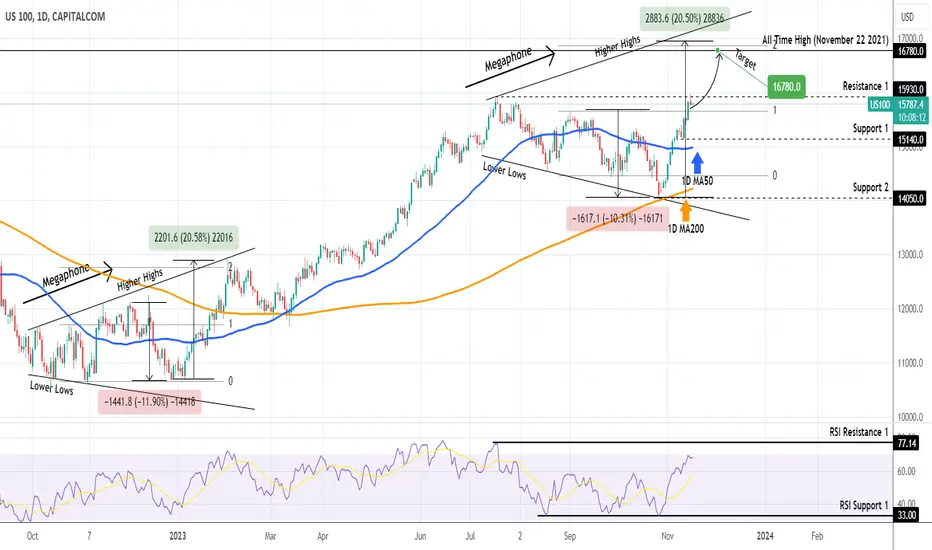
NASDAQ The target is no less than the All Time High.Nasdaq (NDX) smashed through our bullish target when we issued a buy signal (see chart below) 2 weeks ago:
Right now it is on a minor pull-back after hitting Resistance 1 (15930) yesterday, which is the July 19 High. That was the firs High of a potential Megaphone pattern and its structure so far resembles the Megaphone that formed the market bottom (October - December 2022) after the 2022 Inflation Bear Cycle.
Technically there are high probabilities that we are on the final bullish leg towards the Higher Highs trend-line, which in January 2023 extended as high as to complete a +20.50% rise. It also reached the 2.0 Fibonacci extension. A repeat of that magnitude would push the index marginally above the 16780 All Time High (ATH) of November 22 2021, and that is our current medium-term target.
-------------------------------------------------------------------------------
** Please LIKE 👍, FOLLOW ✅, SHARE 🙌 and COMMENT ✍ if you enjoy this idea! Also share your ideas and charts in the comments section below! This is best way to keep it relevant, support us, keep the content here free and allow the idea to reach as many people as possible. **
-------------------------------------------------------------------------------
💸💸💸💸💸💸
👇 👇 👇 👇 👇 👇
Stockindex
S&P500 Cup and Handle paid off. Now brace for Xmas rally.The S&P500 index (SPX) fulfilled our previous Cup and Handle (C&H) pattern, as even though it had a week closing below the 1W MA50 (blue trend-line), it eventually bottomed and has since been on a 3-week rebound that broke above the Handle, turning the 1D MA50 (red trend-line) into a Support again.
Perhaps the strongest technical development of the week is the emerging formation of a Bullish Cross on the 1W MACD. Historically those are formed in the middle of strong rallies, even during a Bear Cycle correction (such as on July 18 2022). Even though a 1 week correction similar to the October 31 2022 1W candle is possible, we expect a new All Time High (ATH) at 4900 (Target 2) at least, as every rally since the October 10 2022 market bottom, has completed at least a +20.19% rise.
Even on the short-term, we expect a 'Christmas rally' to test the bottom of the ATH Zone at 4700 by the end of December, assuming the 1D MA50 of course supports.
Our longer term perspective has the psychological 5000 target in frame as it is slightly below the 1.5 Fibonacci extension from the July 24 High. This projection is made based on that July 24 High itself, which was been on the 1.5 Fib extension from the January 30 High.
Are you looking for a 1 week pull-back to buy or you are already on board for a 'Santa rally'?
-------------------------------------------------------------------------------
** Please LIKE 👍, FOLLOW ✅, SHARE 🙌 and COMMENT ✍ if you enjoy this idea! Also share your ideas and charts in the comments section below! This is best way to keep it relevant, support us, keep the content here free and allow the idea to reach as many people as possible. **
-------------------------------------------------------------------------------
💸💸💸💸💸💸
👇 👇 👇 👇 👇 👇

DAX Watch this low risk November trading plan.It's been a bit long since we last took a trade on DAX (DE40) but it didn't disappoint as it hit both our buy and sell targets (see chart below) within the 3-month Channel Down:
The rebound took place within the 6-month Support Zone and slightly under the 1W MA100 (green trend-line), similar to the March 20 rebound. The fractals are identical as they both rebounded aggressively, indicating strong demand inside the Support Zone. Both also formed a strong 1D MACD Bullish Cross straight after they bottomed.
The price is now on the 1D MA50 (blue trend-line) at the top of the Channel Down, and the last two days failed to close the 1D candle above the MA50, despite breaking it. The Resistance pressure is getting stronger since this is also the 0.382 Fibonacci retracement level from the July 31 top.
As a result, we are willing to sell the Lower Highs top of the Channel Down and target 15050 (can go even to the 0.618 Fib level but we seek short-term exposure for now) but only as long as the candles close below the 1D MA50. Upon the first 1D candle closing above the 1D MA50, we will take the loss and resume buying, targeting the 1D MA200 (orange trend-line) at 15635.
-------------------------------------------------------------------------------
** Please LIKE 👍, FOLLOW ✅, SHARE 🙌 and COMMENT ✍ if you enjoy this idea! Also share your ideas and charts in the comments section below! This is best way to keep it relevant, support us, keep the content here free and allow the idea to reach as many people as possible. **
-------------------------------------------------------------------------------
💸💸💸💸💸💸
👇 👇 👇 👇 👇 👇

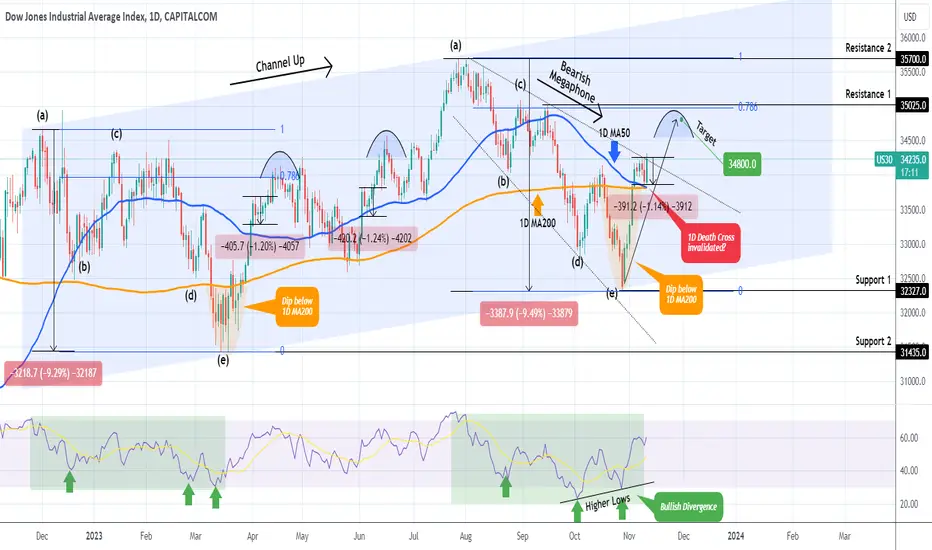
DOW JONES Strong rebound on the 1D MA50!Dow Jones (DJI) is having an excellent rebound ever since our October 31 buy signal (see chart below), which we issued after the index bottomed on the Higher Lows trend-line of the 12-month Channel Up:
The price broke today even above the 3-month Bearish Megaphone, which was the pattern that executed the Channel Up correction. Today's rebound is being done after the index hit and held the 1D MA50 (blue trend-line), which is in fact on top of the 1D MA200 (orange trend-line). If it continues, we may see this 1D Death Cross (a technically bearish pattern) getting invalidated.
However, we do lower our medium-term target from 35000 to 34800 as this rebound is coming off a -1.15% pull-back, which resembles those of June 06 and April 04, that topped on the next rise and then pulled-back to the 1D MA50.
-------------------------------------------------------------------------------
** Please LIKE 👍, FOLLOW ✅, SHARE 🙌 and COMMENT ✍ if you enjoy this idea! Also share your ideas and charts in the comments section below! This is best way to keep it relevant, support us, keep the content here free and allow the idea to reach as many people as possible. **
-------------------------------------------------------------------------------
💸💸💸💸💸💸
👇 👇 👇 👇 👇 👇
S&P500 and VIX. A tale of two opposites.It's no secret that the stock market and in this particular example, the S&P500 (chart on the left), is negatively correlated to the Volatility Index (chart on the right). What we do want to bring to your attention however is how tightly this correlation has been in the past 12 months with VIX's Falling Wedge having the price on its middle, almost on perfect symmetry with the S&P's Bullish Megaphone.
See the recurring sequences within both patterns (tops/ red, bottoms/ greens, consolidations/ blue arcs) and how inversely correlated they are. Right now VIX is headed for its Support where it ends to rebound and consolidate for around 1 month, before sharply declining for a new Lower Low.
Similarly we expect the S&P500 to rise some more before peaking for the short-term, then pull-back to consolidate and then stage an aggressive end-of-the-year rally. Can it repeat a +20% rally as the previous 2 rally legs of the past 12 months? Doubtful, but potentially taking profits when VIX bottoms is certainly a good indicator to have in mind.
-------------------------------------------------------------------------------
** Please LIKE 👍, FOLLOW ✅, SHARE 🙌 and COMMENT ✍ if you enjoy this idea! Also share your ideas and charts in the comments section below! This is best way to keep it relevant, support us, keep the content here free and allow the idea to reach as many people as possible. **
-------------------------------------------------------------------------------
💸💸💸💸💸💸
👇 👇 👇 👇 👇 👇

CHINA A50: Chinese stocks are the buy opportunity of a decade.The China A50 index (CN50) is trading within a Falling Wedge pattern and on the larger picture a Channel Up with its Higher Highs being on June 09 2015 and February 16 2021. The price is now closer to the Channel Up bottom and the pricing of a new long-term Higher Low (bottom), which already makes it a great buy opportunity. Of course the most optimal level to enter would be as close to the bottom as possible, especially of the 1W RSI makes one more Higher Low on its Triangle.
We have seen the very same 1W RSI Triangle in November 2012 - February 2014, when the index was within a similar Falling Wedge. The same RSI Bullish Divergence (Higher Lows against the price's Lower Lows) eventually caused the March 18 2014 rebound. This is why the most optimal level to buy would be on the (current) RSI Higher Lows. If that isn't materialized, we will enter when the 1D MA100 (green trend-line) breaks, which will be a bullish break-out confirmation. In either case, our long-term target is the 2.382 Fibonacci extension level at 23000.
-------------------------------------------------------------------------------
** Please LIKE 👍, FOLLOW ✅, SHARE 🙌 and COMMENT ✍ if you enjoy this idea! Also share your ideas and charts in the comments section below! This is best way to keep it relevant, support us, keep the content here free and allow the idea to reach as many people as possible. **
-------------------------------------------------------------------------------
💸💸💸💸💸💸
👇 👇 👇 👇 👇 👇

NIFTY Excellent long-term buy opportunity.Nifty 50 Index (NIFTY) has been trading within a long-term Channel Up pattern since the June 17 2022 low and recently has found itself on a correctional 1.5 month wave under the 1D MA50 (blue trend-line) towards the 1D MA200 (orange trend-line).
Last week the 1D RSI breached the 30.00 oversold mark and immediately rebounded. It hasn't been that low since June 17 2022, which was the very start of the long-term Channel Up. As a result, those are indeed technically underpriced levels and this Channel Down correction on the RSI resembles the bearish leg of August - September 2022, which stopped before the 0.5 Fibonacci retracement level and resumed the Channel Up uptrend.
As a result, if the 1D MACD forms a Bullish Cross (as October 17 2022), it will confirm the oversold bullish reversal signal of the RSI. As long as the 0.5 Fibonacci level (18530) holds, we are bullish on the index, targeting the -0.236 Fib ext at 21000 (which is where the December 01 2022 Higher High was priced). It has to be mentioned that the symmetry of the Channel Up rallies is indeed quite strong.
-------------------------------------------------------------------------------
** Please LIKE 👍, FOLLOW ✅, SHARE 🙌 and COMMENT ✍ if you enjoy this idea! Also share your ideas and charts in the comments section below! This is best way to keep it relevant, support us, keep the content here free and allow the idea to reach as many people as possible. **
-------------------------------------------------------------------------------
💸💸💸💸💸💸
👇 👇 👇 👇 👇 👇

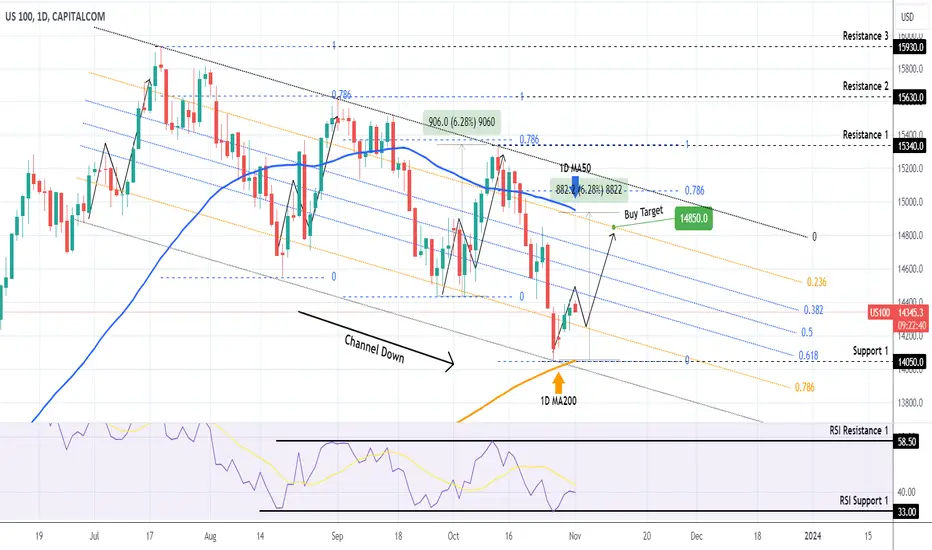
NASDAQ Can it hold the 1D MA200 ahead of the Fed and NFP?Nasdaq (NDX) has a strong rebound near the 1D MA200 (orange trend-line) last week, which formed the latest Lower Low at the bottom of the 3.5 month Channel Down. Ahead of today's Fed Rate Decision and Friday's Nonfarm Payrolls, it is important for investors to see the index holding the 1D MA200 as Support, as it will provide the technical backing for at least a short-term rise.
As long as it does, our target is 14850, which is a level that meets all 4 bullish criteria:
1) Is on the 0.236 Fibonacci Channel level (all previous 3 Channel Down bullish legs hit at least this level).
2) Is on/ below the 1D MA50 (blue trend-line).
3) Is less than +6.28% (which has been the lowest % rise of a bullish leg withi this Channel).
4) Is (quite) below the 0.786 horizontal Fibonacci level (all previous bullish legs almost hit it).
If however the 1D RSI hits the 58.50 level (Resistance 1) before the index hits the 14850 target, we will book the profit earlier, as that RSI Resistance has formed the last 2 Lower Highs of the Channel Down.
-------------------------------------------------------------------------------
** Please LIKE 👍, FOLLOW ✅, SHARE 🙌 and COMMENT ✍ if you enjoy this idea! Also share your ideas and charts in the comments section below! This is best way to keep it relevant, support us, keep the content here free and allow the idea to reach as many people as possible. **
-------------------------------------------------------------------------------
💸💸💸💸💸💸
👇 👇 👇 👇 👇 👇
DOW JONES Best buy opportunity in the last 7 months.Dow Jones (DJI) hit the bottom of the long-term Channel Up pattern by completing leg (e). This is a similar structure to the (a) - (e) sequence that bottomed on March 15. Technically this is the best buy opportunity on the index in the last 7 months. On top of that, the 1D RSI is on Higher Lows during the prices (d) - (e) wave, showcasing a huge Bullish Divergence, the first such since February 24 2022! We can't ignore however the potential 1D Death Cross formation and any bullish approach has to be adjusted short-term.
As for the target, the March rally breached marginally above the 0.786 Fibonacci retracement level, therefore giving us the framework to target 35000 (Resistance 1 + 0.786 Fib). Be careful, as failure and/ or rejection on the 34150 October 17 High, will be a bearish signal, aiming at a Lower Low, potentially near Support 2.
-------------------------------------------------------------------------------
** Please LIKE 👍, FOLLOW ✅, SHARE 🙌 and COMMENT ✍ if you enjoy this idea! Also share your ideas and charts in the comments section below! This is best way to keep it relevant, support us, keep the content here free and allow the idea to reach as many people as possible. **
-------------------------------------------------------------------------------
💸💸💸💸💸💸
👇 👇 👇 👇 👇 👇

S&P500 This trend-line separates bull from more pain.The S&P500 index had a green session yesterday as the price made a Lower Low at the bottom of the Channel Down and seems to be rebounding. Technically that is the bullish leg towards the new Lower High, with the previous being priced on the 1D MA50 (blue trend-line).
This Channel Down however, on a 1D RSI basis as well, resembles the August - October 2022 pattern. Both corrections have almost 1 year between them. If the long-term structure that connects them is a Channel Up, then there is more selling ahead, with the potential Support/ long-term Accumulation level being on the 1W MA200 (red trend-line). In October 2022, that level was continuously tested for 2 weeks in a row and held.
The bottom of that Channel Down was confirmed after the 4H MA150 (green trend-line) broke to the upside. As a result, a fair guess would be to buy if a break-out above the 4H MA150 (now at 4275) takes place again. If it does, we will buy again and target the standard +20% medium-term rise within this 12 month span (happened 3 times) aiming at 4930 (would make a new All Time High). If the index stays below the 4H MA150, we will wait until the price bounces off the 1W MA200 and buy with 4740 as the target.
-------------------------------------------------------------------------------
** Please LIKE 👍, FOLLOW ✅, SHARE 🙌 and COMMENT ✍ if you enjoy this idea! Also share your ideas and charts in the comments section below! This is best way to keep it relevant, support us, keep the content here free and allow the idea to reach as many people as possible. **
-------------------------------------------------------------------------------
💸💸💸💸💸💸
👇 👇 👇 👇 👇 👇

S&P500 That's the longest correction since 2011.More pain ahead?S&P500 (SPX) has been on a correction mode since the week of July 24, completing 13 straight weeks (91 days) of pulling-back without a 50% retracement. As you can see on the charts above, which are on the 1W time-frame, this is the strongest such correction since October 03 2011, which stretched for 21 weeks.
Even the recent Inflation Bear Cycle of 2022 had three separate correction phases of no more than 11 weeks. In total since 2011 there have been 12 such corrections (including the current), so we can realize just how long this one has gone without at least a 50% Fib retracement. This may indicate that potentially we are at or near the bottom. On the downside, it did break and close this week below the 1W MA50 (blue trend-line) and the next Support in line is the 1W MA200 orange trend-line) at 3940.
Do you think it's time to rebound to the 0.5 Fib or the index 'needs' to technically reach the 1W MA200 first?
-------------------------------------------------------------------------------
** Please LIKE 👍, FOLLOW ✅, SHARE 🙌 and COMMENT ✍ if you enjoy this idea! Also share your ideas and charts in the comments section below! This is best way to keep it relevant, support us, keep the content here free and allow the idea to reach as many people as possible. **
-------------------------------------------------------------------------------
💸💸💸💸💸💸
👇 👇 👇 👇 👇 👇

FTSE Last drop before buying for the medium-term.The FTSE 100 Index (UK100) delivered a strong short-term buy signal last time we looked at it (see chart below):
The index has been since rejected twice on the Lower Highs trend-line of what is almost a year long Descending Triangle. We will wait for a test of the Support Zone, ideally when the 1D RSI tests its Higher Lows trend-line and buy for the medium-term. Our target is the 0.618 Fibonacci retracement level at 7535.
-------------------------------------------------------------------------------
** Please LIKE 👍, FOLLOW ✅, SHARE 🙌 and COMMENT ✍ if you enjoy this idea! Also share your ideas and charts in the comments section below! This is best way to keep it relevant, support us, keep the content here free and allow the idea to reach as many people as possible. **
-------------------------------------------------------------------------------
💸💸💸💸💸💸
👇 👇 👇 👇 👇 👇

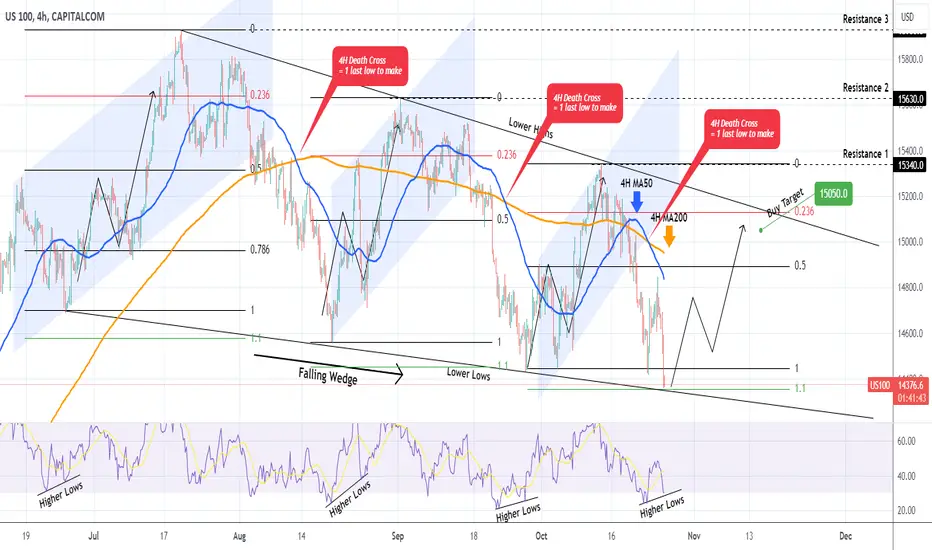
NASDAQ Numerous technical indicators call for a Buy.Nasdaq (NDX) gave us a low risk sell trade last week (see chart below), where after taking the loss on the Channel Up bottom buy, we reversed to selling on the break-out and hit 14530:
Standard 'buy low, sell the breakout if invalidated' approach that aims at assuming low risk near supports/ resistances and high return when those break.
This sell-off brought the price on the Lower Lows (bottom) trend-line of the Falling Wedge for the 4th time. Coming of a 4H Death Cross, this is the 2nd Low after its formation, which has previously been a bottom pricing and buy signal. Additionally, the 4H RSI has been on Higher Lows on every bottom. The last indication that this is a solid buy entry, is that the price hit the 1.1 Fibonacci extension (from previous Low to High), which was where the previous two bottoms where formed.
As a result of all the above parameters, we issue a buy signal on Nasdaq and since the previous Lower Highs almost hit the 0.236 Fibonacci level, we set the Target at 15050.
-------------------------------------------------------------------------------
** Please LIKE 👍, FOLLOW ✅, SHARE 🙌 and COMMENT ✍ if you enjoy this idea! Also share your ideas and charts in the comments section below! This is best way to keep it relevant, support us, keep the content here free and allow the idea to reach as many people as possible. **
-------------------------------------------------------------------------------
💸💸💸💸💸💸
👇 👇 👇 👇 👇 👇
NASDAQ flashed a 13 years old BUY SIGNAL!Nasdaq (NDX) has completed a Bullish Cross between its 1W MA50 (blue trend-line) and 1W MA100 (green trend-line). Even though it's not a Golden Cross, on the 1W time-frame it attracts particular importance as the last time we saw this bullish signal was more than 13 years ago (February 08 2010) in the (sharp) recovery process after the 2008 Housing Crisis.
The fractals of that Crisis and the (current) 2022 Inflation Crisis are similar. Both hit the 0.9 Fibonacci retracement level and got the first major rejection since the Bear Market. The current wave is ongoing but in 2010 it approached the 0.618 Fib and rebounded strongly for nearly 1 year. On the current pull-back wave the 0.618 Fib is at 14000 and thi index already hit 14420.
Is it good enough to start the new recovery wave? It certainly is low enough to give us acceptable risk for the long-term, especially after the formation of a 13 year old bullish pattern. Based on the 2010 fractal, we may see new All Time Highs on Nasdaq in less than 6 months.
Are you buying on this signal?
-------------------------------------------------------------------------------
** Please LIKE 👍, FOLLOW ✅, SHARE 🙌 and COMMENT ✍ if you enjoy this idea! Also share your ideas and charts in the comments section below! This is best way to keep it relevant, support us, keep the content here free and allow the idea to reach as many people as possible. **
-------------------------------------------------------------------------------
💸💸💸💸💸💸
👇 👇 👇 👇 👇 👇

RUSSELL 2000 Support Zone rebound?Russell 2000 (RUT) entered on Friday the wide Support Zone (1700 - 1630) that was formed on the May 12 2022 Low. The 1D candle closed inside it so unlike the bottoms that had wicks that recovered and closed above the Zone, this is most likely similar to the June 16 2022 and September 23 2022 breaches.
A low is to be expected around 1640 but the index is already a strong long-term buy, as the cyclical behavior of the Sine Waves suggests. The tops match perfectly with the Waves. In any case, from now on the first sign of 1D RSI Higher Lows (Bullish Divergence if the candles are on Lower Lows), will be the last confirmation we need of an upcoming bullish leg, which was the characteristic of all previous 3 bottoms.
On top of that, 10 days ago a 1D Death Cross was formed and even though that's a technical bearish pattern, last time it signalled the bottom. Our target is 2000, just below the 2008 - 2027 Resistance Zone.
-------------------------------------------------------------------------------
** Please LIKE 👍, FOLLOW ✅, SHARE 🙌 and COMMENT ✍ if you enjoy this idea! Also share your ideas and charts in the comments section below! This is best way to keep it relevant, support us, keep the content here free and allow the idea to reach as many people as possible. **
-------------------------------------------------------------------------------
💸💸💸💸💸💸
👇 👇 👇 👇 👇 👇

MOEX Moscow testing the All Time Highs.Pullback before breakout?The Moscow Exchange (MOEX) is about to test today the 192.50 All Time High (ATH) made on May 10 2021. It was a similar Higher Lows rally that led to the ATH as this year's dashed Higher Lows Support. The current bullish leg has completed +80% since the last Higher Low, similar to the February 27 High (+79%). Ahead of a 1D Golden Cross, this strong Resistance combination (+80% and ATH) calls for a technical pull-back. In the last 4 years, the minimum such correction has been -12.93%. A decline repeat of such magnitude gives us a 167.50 target, exactly on the Higher Low trend-line.
-------------------------------------------------------------------------------
** Please LIKE 👍, FOLLOW ✅, SHARE 🙌 and COMMENT ✍ if you enjoy this idea! Also share your ideas and charts in the comments section below! This is best way to keep it relevant, support us, keep the content here free and allow the idea to reach as many people as possible. **
-------------------------------------------------------------------------------
💸💸💸💸💸💸
👇 👇 👇 👇 👇 👇

S&P500 The most important test for a long-term uptrend is now.The S&P500 had a strong rejection on the 1D MA50 (blue trend-line) and made a 3 day bearish streak that brought it today on the verge of testing the 1D MA200 (orange trend-line) yet again. The last time it made a triple test between 4 days October 03 - 06) and managed to close all candles above it. As a result, if the S&P500 is to recover, it is critical to hold candle closings above or at least near the 1D MA200.
To get a better perspective of the important of the 1D MA200 during uptrends, it is useful to look at previous such corrections that didn't end up in deeper corrections (Bear phases) but instead extended the bullish trend with rebounds on the 1D MA200.
Such recent examples (besides the COVID recovery in 2020) are 2019 and 2018. In 2019 after two 1D candle closings under it (May 31, June 03 2019), the 1D MA200 held multiple times in July and September. Similarly in 2018, only two days (March 23 and April 02 2018) closed marginally below the 1D MA200 in multiple tests.
Bottom-line: the index MUST hold the 1D MA200 in order to overcome the 3 month correction since July and resume the long-term bullish trend it has since the start of the year.
-------------------------------------------------------------------------------
** Please LIKE 👍, FOLLOW ✅, SHARE 🙌 and COMMENT ✍ if you enjoy this idea! Also share your ideas and charts in the comments section below! This is best way to keep it relevant, support us, keep the content here free and allow the idea to reach as many people as possible. **
-------------------------------------------------------------------------------
💸💸💸💸💸💸
👇 👇 👇 👇 👇 👇

DOW JONES Inverse Head and Shoulders signals for a new buyDow Jones (DJI) has completed an Inverse Head and Shoulders (IH&S) pattern and this week's pull-back, caused by a rejection on the 4H MA200 (orange trend-line), may be the last before it starts rising to a new Higher High. We are taking this opportunity to buy for the short-term and target the top of the dashed Channel at 34200. The IH&S can complete its long-term target on the 2.0 Fibonacci level (35000) after it breaks above the Lower Highs trendline.
-------------------------------------------------------------------------------
** Please LIKE 👍, FOLLOW ✅, SHARE 🙌 and COMMENT ✍ if you enjoy this idea! Also share your ideas and charts in the comments section below! This is best way to keep it relevant, support us, keep the content here free and allow the idea to reach as many people as possible. **
-------------------------------------------------------------------------------
💸💸💸💸💸💸
👇 👇 👇 👇 👇 👇

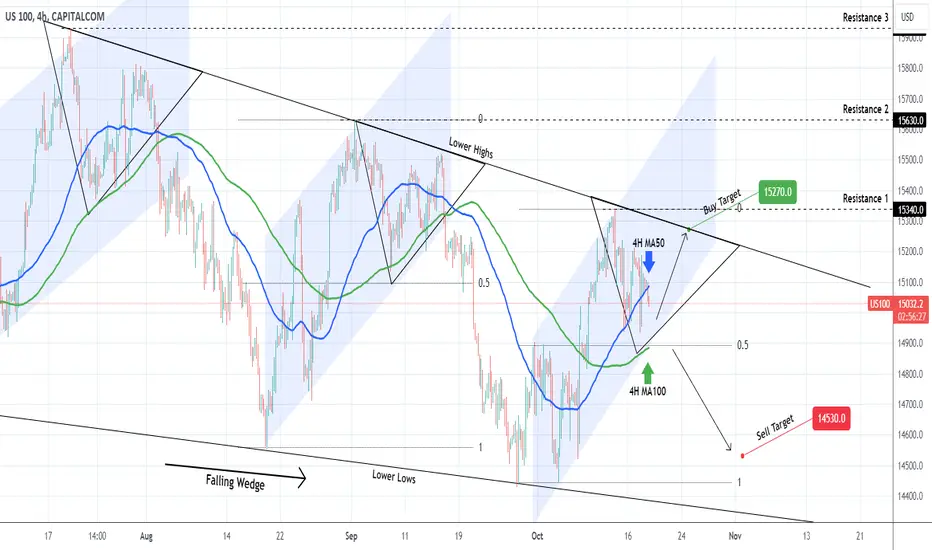
NASDAQ Best action plan for the short-term.Nasdaq (NDX) is trading on the 4H MA50 (blue trend-line), pulling back after a Lower High at the top of the Falling Wedge pattern. The formation that took it that high is a Channel Up which hasn't yet been invalidated. As a result we currently sit on a bullish short-term signal until broken, with a 15270 target (Lower Highs trend-line). If the price closes below the 0.5 Fibonacci retracement level, which would also be below the 4H MA100 (green trend-line), it will be a sell confirmation like that of September 19, and we will sell, targeting 14530.
-------------------------------------------------------------------------------
** Please LIKE 👍, FOLLOW ✅, SHARE 🙌 and COMMENT ✍ if you enjoy this idea! Also share your ideas and charts in the comments section below! This is best way to keep it relevant, support us, keep the content here free and allow the idea to reach as many people as possible. **
-------------------------------------------------------------------------------
💸💸💸💸💸💸
👇 👇 👇 👇 👇 👇
S&P500 Giant Cup and Handle completed? 5000 realistic now?The S&P500 index (SPX) has been trading within a Channel Down since the mid-July High. Last week though made a strong reversal on the 1W MA100 (green trend-line) and the 1D MA200, closed the candle in green and is about to do so again for the 2nd straight week today. Ahead of a 1W MA50/100 Bullish Cross (the first in 7 years), this Channel Down can be interpreted as nothing more than the Handle of a Giant Cup and Handle pattern. We can argue that the whole Inflation Crisis of 2022 has been a Cup and Handle with the subsequent market recovery.
The breaking of the 1W RSI Higher Lows trend-line indicates on the macro level a shift to a new, less aggressive trend, as the 2023 rally isn't easily sustainable without more fundamental catalysts. As a result, as long as the MA Support Cluster holds, we resume being bullish long-term. Target 1 is 4700 (bottom of the All Time High Resistance Zone) and by Q2 2024 Target 2 at 5000.
-------------------------------------------------------------------------------
** Please LIKE 👍, FOLLOW ✅, SHARE 🙌 and COMMENT ✍ if you enjoy this idea! Also share your ideas and charts in the comments section below! This is best way to keep it relevant, support us, keep the content here free and allow the idea to reach as many people as possible. **
-------------------------------------------------------------------------------
💸💸💸💸💸💸
👇 👇 👇 👇 👇 👇

NASDAQ Channel Down or Bullish Flag?Nasdaq (NDX) broke above the 1D MA50 (blue trend-line) and has almost reached the top (Lower Highs trend-line) of the Channel Down pattern that started after the July 19 High. The 1D STOCH RSI Bearish Cross suggests that this is a sell opportunity on the short-term at least, towards 14900 (0.5 Fibonacci retracement level).
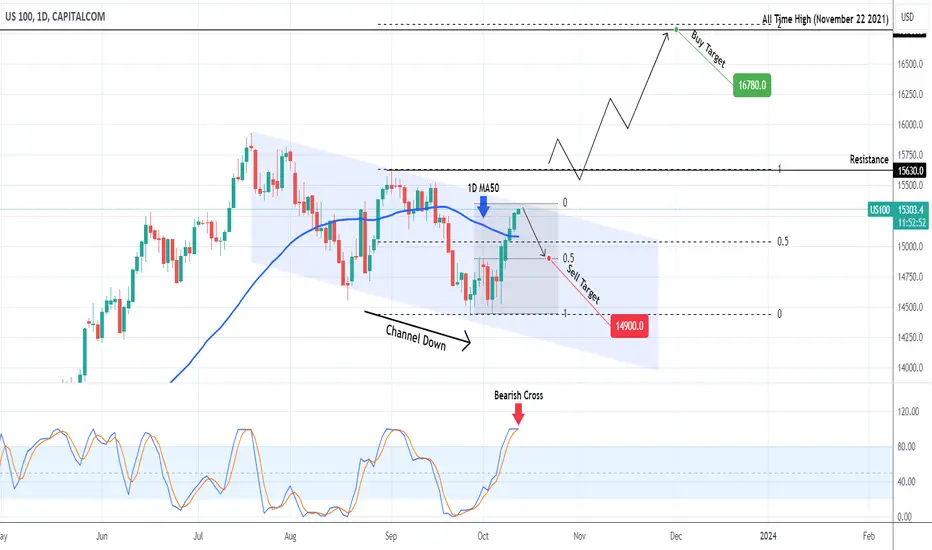
But what if this is not a Channel Down but a Bullish Flag pattern after a relentless 2023 price growth? In that case we will need to wait for confirmation in the form of a break-out above the last Lower High (and current Resistance level) at 15630. After that, we will buy the first pull-back below it and target the 16780 All Time High of November 2021, which interestingly enough is only a fraction below the 2.0 Fibonacci extension, a standard technical target in case of Bullish Flag break-outs.
-------------------------------------------------------------------------------
** Please LIKE 👍, FOLLOW ✅, SHARE 🙌 and COMMENT ✍ if you enjoy this idea! Also share your ideas and charts in the comments section below! This is best way to keep it relevant, support us, keep the content here free and allow the idea to reach as many people as possible. **
-------------------------------------------------------------------------------
💸💸💸💸💸💸
👇 👇 👇 👇 👇 👇
DAX is topping short term. Fast profit opportunity.DAX trade excatly as expected last time (chart at the bottom) making a new Low in the established Channel Down.
The price reached the 0.5 Fibonnaci level today, a reading which formed the August 31st Lower High on the other -6.50% bearish leg.
Sell now and target 15150 (Rising Support) but close if it reaches first the 1day MA50 as the MACD Buy Cross can completely reverse it long term.
Previous chart:
Follow us, like the idea and leave a comment below!!

S&P500 Potentially made the biggest rebound of the next 12monthsWe have shown numerous times that the S&P500 (SPX) was in a 2.5 month Channel Down/ corrective move but all within the larger Channel Up pattern, which keeps the long-term trend bullish ever since the bottom recovery last October (2022). Much like that bottom which was formed by the rebound on the 1W MA200 (orange trend-line), 12 months after (October 2023), the index may have just made the most important rebound for another 12-month period.
What was the 1W MA200 then, is the 1W MA100 (green trend-line) and 1W MA50 (blue trend-line), which are about to form a Bullish Cross, the first since September 2016. In fact last week's candle hit the 1W MA100 and rebounded immediately, almost closing the body candle flat, leaving a large wick underneath it, an even stronger reversal than even the October 10 2022 1W candle.
If that wasn't enough, the index hit (and as mentioned rebounded) the Former Resistance Zone of May 2022 through May 2023. In times of such transitions from a Bear to a Bull Cycle, we see the market technically testing former Resistances to make Demand Zones and turn them into Support levels.
On top of that, this week the index just entered into green Ichimoku Cloud territory for the first time since September 05 2022. All this while the 1W RSI bounced off a 18 month Higher Lows trend-line.
It is obvious that if this 5-level Support Zone holds, it can extend the 12-month Channel Up pattern to its next Higher High. Assuming a similar to the previous two bullish legs, +20% rise leg will take place, we expect the S&P500 to target 5000.
-------------------------------------------------------------------------------
** Please LIKE 👍, FOLLOW ✅, SHARE 🙌 and COMMENT ✍ if you enjoy this idea! Also share your ideas and charts in the comments section below! This is best way to keep it relevant, support us, keep the content here free and allow the idea to reach as many people as possible. **
-------------------------------------------------------------------------------
💸💸💸💸💸💸
👇 👇 👇 👇 👇 👇
