SPX climbing to short zoneDon't forget to Click the follow button for daily professional analysis, also please feel free to ask any questions you have!
Here is our SPX chart.
We may see a further drift to highs. Our bias remains short back down to key MA's and some fair support.
Market sentiment will dictate further moves.
Stockindex

UK 100 Slowly turning over..Don't forget to click on the follow button for more daily Professional analysis. Also if you have any questions, please do ask them!
Here we have our FTSE index.
We are still looking short as price returns to previous highs.
Price is now stalling on the current news sentiment and has room to fall.
We are shorting down to a comfortable area of support.
Targets and price movement is noted by directional arrows.

SPX turning over..Don't forget to click on the follow button for more professional daily analysis , also if you have any questions, please do ask them!
Here we have our SPX chart.
After todays News and CPI data, we are still looking short.
Price is bleeding down and is approaching our Previously noted target.

Overbuying. Always ends up going down..Don't forget to Click on the Follow button after reading and if you have any questions, please do ask them!
The SPX has seen a huge rally and after the small market moves of late we are still looking short back down to more comfortable support.
It is now an overbought asset.
This is noted by our directional arrow back towards Key MA's.

DAX short-term profit-taking leading to 16400Last week DAX gave the most optimal buy entry on the bottom (Higher Lows trend-line) of the long-term Channel Up as I presented on my most recent analysis:
The price hit 15840 on a strong rebound, the strongest 2 days of the year. Yesterday the price started to pull-back but shouldn't be alarming as the very same -1.30% correction took place on October 18, during the last rally wave and turned out to be just profit taking. The index traded sideways for a week and later went on a 1 month rally extension towards the 1.236 Fibonacci extension.
That extension is currently a little over 16600 and if it takes place, it would mean the break to the upside of the August Channel Up. For the time being, it is more sensible to initially target 16400 and then re-evaluate.
Notice how the 1D MACD is currently forming a Bullish Cross, which DAX typically forms at the start of its rallies.
--------------------------------------------------------------------------------------------------------
** Please support this idea with your likes and comments, it is the best way to keep it relevant and support me. **
--------------------------------------------------------------------------------------------------------

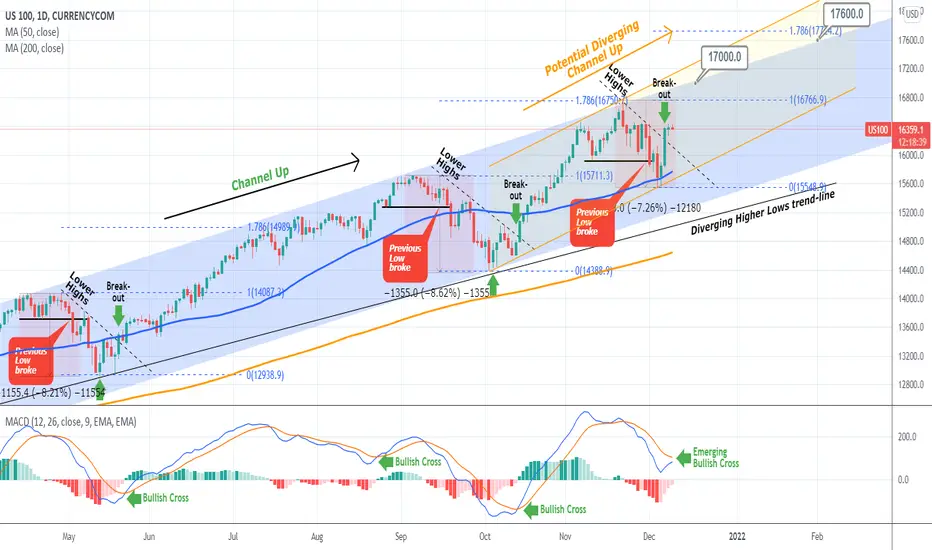
NASDAQ may break even higher than its Channel UpAs mentioned on my previous analysis, the Lower High divergence on the 1D RSI was the signal that Nasdaq would pull-back. The small technical correction eventually ended at around -7% from the top, exactly on the 1D MA50 (blue trend-line). As I've mentioned before, this is generally considered a solid first buy entry.
The current chart shows that after a similar correction (8 to 8.50% roughly), NDX always starts a 2 month rise towards the 1.786 Fibonacci extension. The point of bullish break-out is typically when the 1D MACD forms a Bullish Cross, which is currently close to happening. Previously that has coincided with the break above the internal Lower Highs trend-line.
The 1.786 Fib extension is currently a little over 17700. If that takes place within the next 2 months, we may see the dominant 9-month Channel Up break upwards and transcend into the Diverging Channel Up displayed in orange. Regardless of that, our next two long-term targets are 17000 and 17600.
--------------------------------------------------------------------------------------------------------
** Please support this idea with your likes and comments, it is the best way to keep it relevant and support me. **
--------------------------------------------------------------------------------------------------------
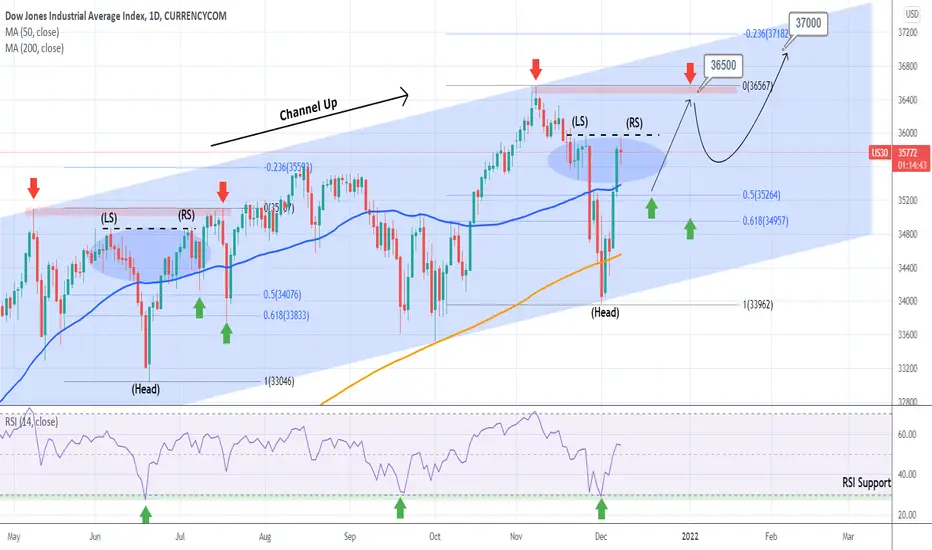
DOW JONES may give more buy opportunities on this patternThis is an update to my most recent Dow Jones idea that gave the buy signal on the bottom of the Channel Up a week ago:
The index has been rallying aggressively since then and now faces the first important Resistance (black dashed line). This may be an Inverse Head and Shoulders pattern similar to the June one. That has given two buy opportunities on the 1D MA50 (blue trend-line)/ 0.5 Fibonacci retracement level and the 0.618 Fibonacci retracement level before the final rally of that phase towards the 0.236 Fibonacci extension.
If you didn't catch the bottom buy already, be on the look out for those potential buy opportunities.
--------------------------------------------------------------------------------------------------------
** Please support this idea with your likes and comments, it is the best way to keep it relevant and support me. **
--------------------------------------------------------------------------------------------------------
S&P500 Be ready to buy the pull-back if needed.This is a short-term update on the 4H time-frame which I rarely use for S&P500 on my November 30 idea:
As you see on that recent post, the 1D MA50 worked well once more in catching the correction within the multi-month Channel Up and the index has been rebounding strongly this week. This long-term Channel has worked very well at identifying tops as well:
Anyway back to the current situation/ chart and the 4H time-frame. The index has entered the High Volatility Cluster of November, which was basically a prolonged Resistance Zone. As long as the 4745 Resistance doesn't breaks, there are high probabilities for a pull-back towards the 4H MA50 (blue trend-line), which as this long-term uptrend unfolds should form a Golden Cross over the 4H MA200 (orange trend-line). Notice also the MACD which is closer to a Bearish Cross after this very strong rally. If you missed the bottom buy around the 1D MA50, this might be the opportunity you're looking for a new entry.
--------------------------------------------------------------------------------------------------------
** Please support this idea with your likes and comments, it is the best way to keep it relevant and support me. **
--------------------------------------------------------------------------------------------------------

SPX touching back at short zones.Don't forget to make sure you click on the follow button to see daily professional analysis,
Here we have our US stock SPX chart.
We are still looking short after the current news sentiment and yesterdays plans as we approach previous highs.
Price has rallied and must be followed with a fall. Incorporate DCA Correct risk management where needed.

UK 100 Short planDon't forget to click on the follow button after reading for more daily Professional analysis.
Here we have our UK 100 chart.
On the current rise, we are now looking to short back down to some key support and MA's, with our target identified with the directional arrow.

FTSE intraday shortGood Morning, afternoon and evening traders! Don't forget to click the follow button after reading my post for more expert daily analysis.
Here we have our frequently traded FTSE 100 chart.
We are up on the day from current UK market sentiment attacking some key resistance.
We are looking for an intraday short this morning back down.

UK 100 PlanDon't forget to click the follow button to get detailed daily analysis,
Here we have our UK 100 (FTSE) chart.
This is an asset I trade daily.
With the current news sentiment we have seen a fast and sharp move down followed by a swift rebound. we are at Key MA's and some good support.
We are looking to get long again. TGT area is noted by the Blue arrow on the chart.

FTSE/UK 100 PLANFor more detailed expert daily analysis, don't forget to click the follow button.
Here we have our UK 100 or FTSE 100 chart.
Lots of news on today so we are expecting some larger movement.
As you can see with the eclipse symbol we have seen great price rejection around the 7210-7125 area.
We are now getting nearer to short positions on the day and will re long nearer this area as price falls lower.
Our directional arrows show us the movement of price.

SPX Looking ShortHere is our SPX 500 Chart.
Recovery economically and good sentiment has driven this asset class higher.
We are looking short back at the highs on previously formed resistance and price rejection arrows.
Our target is back down nearer our MA's as located by the directional arrow.

UK 100 Short on the dayFor more expert analysis of multiple assets, make sure you click the follow button!
Here we have our 4H FTSE 100 chart.
Today we are looking short on the previous rally.
We are now meeting our MA's again and looking further down for our target (noted with arrow).

SPX Turning shortFor more expert daily analysis, go ahead and click the follow button!
Here we have our SPX chart.
Price is now starting to rebound off new ATH.
We are now looking short back down to our key MA's and previous support levels.
Price movement is annotated by the directional arrow.

FTSE on the rise.. Short back down to the strong support.From a Pro FTSE Stock Index trader..
Looking for the FTSE to come back to the Support + Mixture of MA's and we will look long again. For now, It is short back down to this area, where we will then flip long.
Lets get it!

LongThe Nasdaq 100 is a beast and will allow you to gain financial freedom if you can trade and keep risk management along the way. Recent strong tech earning are allowing the upside movement of this prolific stock index. The correlation from the SP 500 has not been strong lately as Nasdaq 100 has recently shown that it has had an independent route in short-term trends. The overall trends will be correlated, but this information is essential for day traders. Trend trading is the most profitable way to gain profits using technical analysis.

NASDAQ on 1D Buy SignalPattern: Channel Up on 1D.
Signal: Buy as the price is at the bottom of the Channel Up, below the 1D MA100 (green trend-line, which has accurately given a long-term buy signal 3 times since November 2020) and the 1D CCI is on Higher Lows at its bottom.
Target: Short-term 15100 (the 1D MA50), medium-term 15700 (Resistance and All Time High) and long-term 16350 (the 1.5 Fibonacci extension).
** Please support this idea with your likes and comments, it is the best way to keep it relevant and support me. **
--------------------------------------------------------------------------------------------------------
!! Donations via TradingView coins also help me a great deal at posting more free trading content and signals here !!
🎉 👍 Shout-out to TradingShot's 💰 top TradingView Coin donor 💰 this week ==> Vergnes
--------------------------------------------------------------------------------------------------------

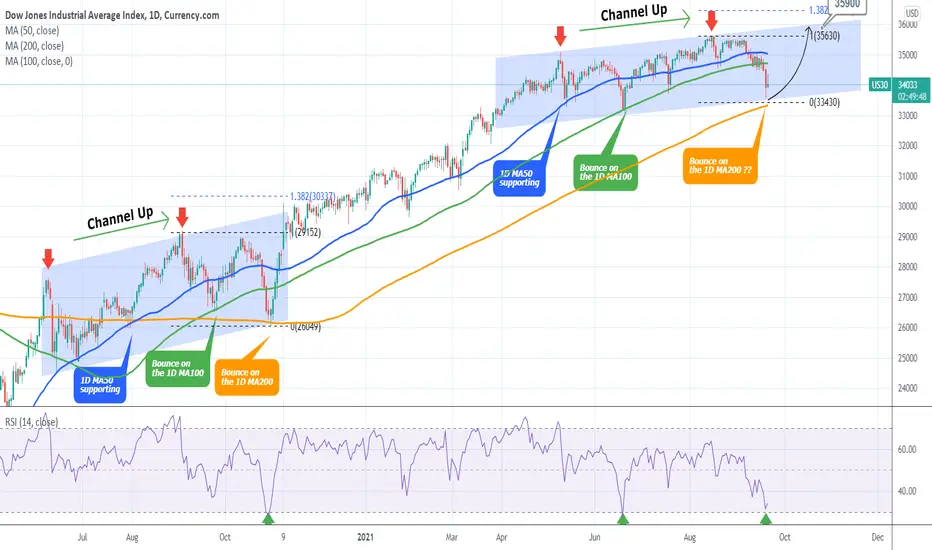
DOW JONES near the 1D MA200/ first time since October 2020!Dow Jones is trading within a Channel Up that has recently broken below the 1D MA100 (green trend-line). This is the first time in two months that is giving the first strong buy signals:
* The RSI is near the 30.000 level which has marked price bottoms on June 18 2021, October 29 2020 (in the post COVID crash era).
* The price is approaching the 1D MA200 (orange trend-line), with the last contact dating back to October 30 2020 (the line held and issued an aggressive rally post US-elections).
* The pattern resembles the June - October 2020 Channel Up. The price hit the 1D MA50 (blue trend-line), 1D MA100 and 1D MA200 in the same order and manner.
Naturally the market is waiting for Fed's confirmation tomorrow before it engages aggressively on high volume but this is the time technically to start considering a buy entry again. Based on the Fibonacci extension model, a target of 35900 seems very plausible.
** Please support this idea with your likes and comments, it is the best way to keep it relevant and support me. **
--------------------------------------------------------------------------------------------------------
!! Donations via TradingView coins also help me a great deal at posting more free trading content and signals here !!
🎉 👍 Shout-out to TradingShot's 💰 top TradingView Coin donor 💰 this week ==> Vergnes
--------------------------------------------------------------------------------------------------------
NASDAQ Start looking for a buy near the 1D MA100 after the FedTwo weeks ago NDX formed a peak formation at the top of the multi-month Channel Up (Higher Highs) and I posted the following chart calling for a strong correction:
As you see that correction is currently underway and having broken below the 1D MA50 (blue trend-line) is looking for the patterns strongest Support, the 1D MA100 (green trend-line) which has been the most optimal buy level since April 2020.
In fact more recently (March and May), the index rebounds shortly after it breaks marginally below the 1D MA100. With the Fed meeting tomorrow being crucial for the market as it either ensures the continuation of very low rate policy (bullish) or signals a start to raising rates (bearish), expect high volatility that may cross the 1D MA100 momentarily on a wick and recover quickly. If the peak I called two weeks ago is the (A) leg, then we are about to complete (B) which on a 1 year basis has been the best buy entry.
** Please support this idea with your likes and comments, it is the best way to keep it relevant and support me. **
--------------------------------------------------------------------------------------------------------
!! Donations via TradingView coins also help me a great deal at posting more free trading content and signals here !!
🎉 👍 Shout-out to TradingShot's 💰 top TradingView Coin donor 💰 this week ==> Vergnes
--------------------------------------------------------------------------------------------------------

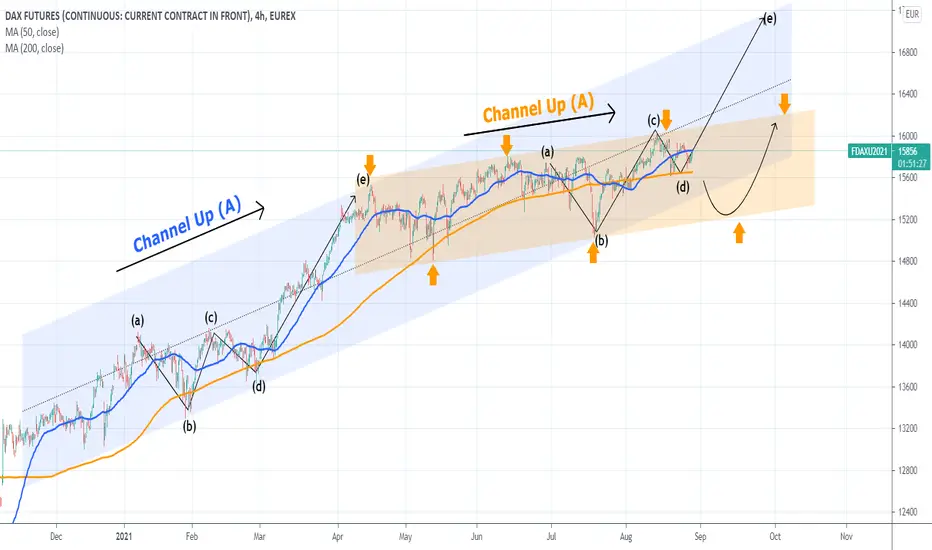
DAX Which Channel will prevail?DAX is ahead of critical crossroads as the long-term Channel Up (blue) that was formed after the November 2020 U.S. elections is on its last leg (d) before the aggressive rally that last time (March-April) led to leg (e).
If this pattern is not repeated, then there is a new Channel Up (orange) that may continue this uptrend but in a more controlled, less aggressive manner. I believe that the signal for this will be a closing below the 4H MA200 (orange trend-line).
Which Channel Up do you think will prevail?
** Please support this idea with your likes and comments, it is the best way to keep it relevant and support me. **
--------------------------------------------------------------------------------------------------------
!! Donations via TradingView coins also help me a great deal at posting more free trading content and signals here !!
🎉 👍 Shout-out to TradingShot's 💰 top TradingView Coin donor 💰 this week ==> nevada999
--------------------------------------------------------------------------------------------------------
Why the S&P500 Micro Futures is one of the best markets to trade Hey Traders so today I wanted to show you a great market to consider trading the S&P500 Micro Futures. I think it is one of the easiest markets to learn vs the Forex and others. It offers great leverage and really good risk vs reward. Of course futures are different from stocks, crypto and forex. The are considered high risk because of the volatility and leverage. But definitely I think they are a good asset class to consider adding to every traders portfolio with the right risk management. Plus this market is a great way to start capturing all the great gains that the stock market has had in the last 10 years. As long as the bull market continues I think this market will remain strong.
Enjoy!
Trade Well,
Clifford
