Flat on Nasdaq, technically bearish but I don't believe it.I don't know what to say; technically, there are various bearish signals.
But I stay long at the fundamental level in short to medium period.
I don't think there will be the start of a bearish trend. I'm flat.
Stockindex

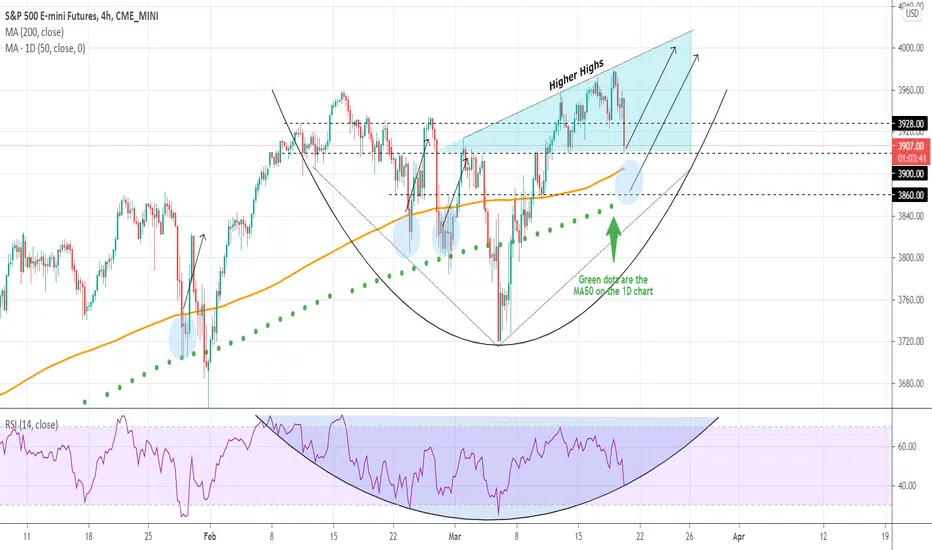
S&P500 Strong MA Support Zone belowThe 4H MA200 (orange trend-line) with the 1D MA50 (green dots) have recently provided rebounds on S&P500 more often than not, acting as a Support Zone.
As you see on the chart those happen to be also on key horizontal Support levels (3900 - 3860). With the 4H RSI making contact with its parabolic line, it is possible that the index is nearing a Support that will provide at least a short-term rebound. Use the Higher Highs line for a potential Target.
** Please support this idea with your likes and comments, it is the best way to keep it relevant and support me. **
--------------------------------------------------------------------------------------------------------
!! Donations via TradingView coins also help me a great deal at posting more free trading content and signals here !!
🎉 👍 Shout-out to TradingShot's 💰 top TradingView Coin donor 💰 this week ==> xBTala
--------------------------------------------------------------------------------------------------------
S&P500 Bullish Break-outPattern: Bullish Megaphone on 4H.
Signal: Buy as the price broke above the inner Lower Highs trend-line and is turning the 4H MA50 (blue trend-line) into Support. The RSI is on a Bullish Divergence.
Target: 4,040 long-term (the 1.382 Fibonacci extension ).
Previous S&P signal:
** Please support this idea with your likes and comments, it is the best way to keep it relevant and support me. **
--------------------------------------------------------------------------------------------------------
!! Donations via TradingView coins also help me a great deal at posting more free trading content and signals here !!
🎉 👍 Shout-out to TradingShot's 💰 top TradingView Coin donor 💰 this week ==> xBTala
--------------------------------------------------------------------------------------------------------

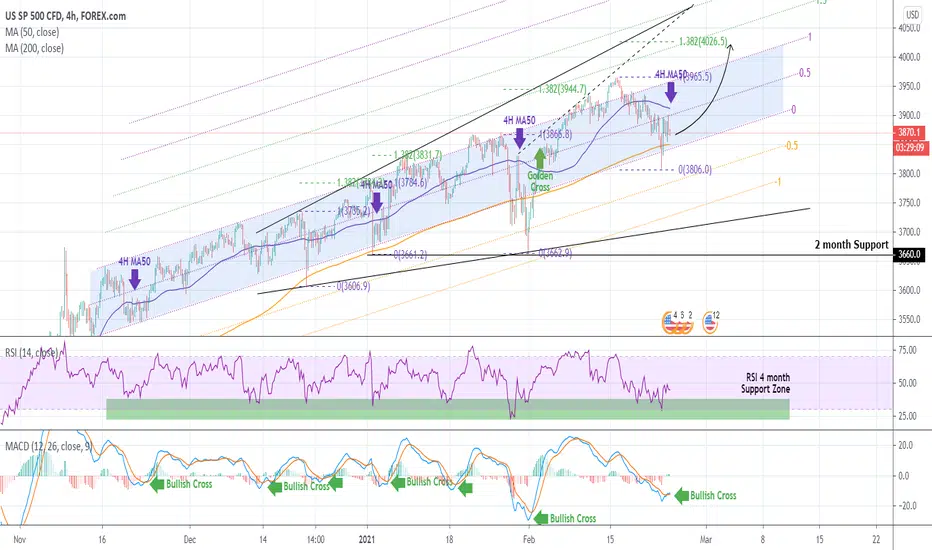
S&P500 A buy Signal from the RSI and MACDPattern: Fibonacci Channel on 4H.
Signal: Buy as every time the MACD made a Bullish Cross, while the RSI had already hit its 4 month Support Zone, the index rose and made a new High. Last confirmation will be to close one session above the 4H MA50, which has previously been a mid-term Resistance within that Channel prior to a new High.
Target: 4000 (just below the 1.382 Fibonacci extension which has been an accurate metric of the next Higher High since December).
Most recent S&P500 signal:
Please like, subscribe and share your ideas and charts with the community!
--------------------------------------------------------------------------------------------------------
!! Donations via TradingView coins also help me a great deal at posting more free trading content and signals here !!
🎉 👍 Shout-out to TradingShot's 💰 top TradingView Coin donor 💰 this week ==> SocialCryptopreneur
--------------------------------------------------------------------------------------------------------
DJI disconnects from the USTech100The disconnection of the DJI and USTech100 has happened before for short amounts of time. In the last limb of price you see this happening.
The question is 'what happens next?' Unfortunately my crystal ball broke a long time ago, and I'm not purchasing a new one on Ebay. 😂
This is one to watch. The H&S on the USTech100 is not predictive.
There are also some disconnections of the so-called 'asian' stock indices from the DJI. Some want to know what it means. I don't care what it means. I follow trends.
Disclaimers : This is not advice or encouragement to trade securities on live accounts. Chart positions shown are not suggestions. No predictions and no guarantees supplied or implied. Heavy losses can be expected if trading live accounts. Any previous advantageous performance shown in other scenarios, is not indicative of future performance. If you make decisions based on opinion expressed here or on my profile and you lose your money, kindly sue yourself.

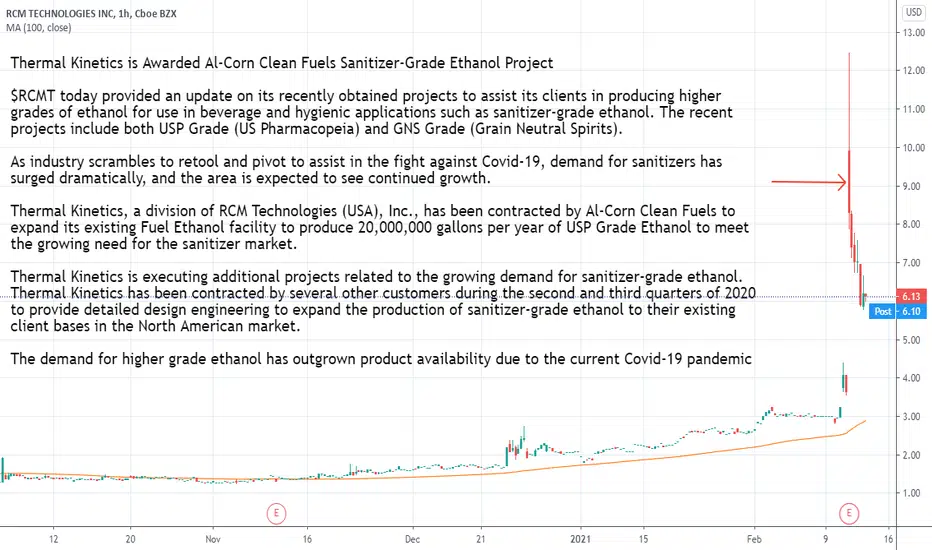
Thermal Kinetic is Awarded Al-Corn Clean Fuels Sanitizer ProjectThermal Kinetics is Awarded Al-Corn Clean Fuels Sanitizer-Grade Ethanol Project
$RCMT today provided an update on its recently obtained projects to assist its clients in producing higher grades of ethanol for use in beverage and hygienic applications such as sanitizer-grade ethanol. The recent projects include both USP Grade (US Pharmacopeia) and GNS Grade (Grain Neutral Spirits).
As industry scrambles to retool and pivot to assist in the fight against Covid-19, demand for sanitizers has surged dramatically, and the area is expected to see continued growth.
Thermal Kinetics, a division of RCM Technologies (USA), Inc., has been contracted by Al-Corn Clean Fuels to expand its existing Fuel Ethanol facility to produce 20,000,000 gallons per year of USP Grade Ethanol to meet the growing need for the sanitizer market.
Thermal Kinetics is executing additional projects related to the growing demand for sanitizer-grade ethanol. Thermal Kinetics has been contracted by several other customers during the second and third quarters of 2020 to provide detailed design engineering to expand the production of sanitizer-grade ethanol to their existing client bases in the North American market.
The demand for higher grade ethanol has outgrown product availability due to the current Covid-19 pandemic
finance.yahoo.com
S&P500 Buy conditionsPattern: Channel Up into a Bullish Megaphone.
Signal: Buy either after a pull-back within the 0.382-0.618 Fibonacci is completed (because the 4H MACD is close to forming a Bearish Cross) or if the 3870 Resistance breaks first.
Target: 3940 (top of the pattern).
** Please support this idea with your likes and comments, it is the best way to keep it relevant and support me. **
--------------------------------------------------------------------------------------------------------
!! Donations via TradingView coins also help me a great deal at posting more free trading content and signals here !!
🎉 👍 Shout-out to TradingShot's 💰 top TradingView Coin donor 💰 this week ==> TradingView
--------------------------------------------------------------------------------------------------------

Closing of $103.5 Million Upsized Initial Public OfferingLMF Acquisition Opportunities, Inc. Announces Closing of $103.5 Million Upsized Initial Public Offering, Including Full Exercise of the Overallotment Option
the closing of its upsized initial public offering of 10,350,000 units, which included the full exercise of the underwriters' over-allotment option, at a price of $10.00 per unit.
Each unit consisted of one share of Class A common stock and one redeemable warrant, each warrant entitling the holder thereof to purchase one share of Class A common stock at a price of $11.50 per share.
finance.yahoo.com

DOW JONES Buy SignalPattern: Channel Up X 2 on 4H.
Signal: Buy as the price hit the Higher Lows trend-line of the orange Channel Up. The Higher Lows trend-line of the blue Channel Up is exactly on the 4H MA200 (orange trend-line).
Target: 31500 (the 1.382 Fibonacci extension).
** Please support this idea with your likes and comments, it is the best way to keep it relevant and support me. **
--------------------------------------------------------------------------------------------------------
!! Donations via TradingView coins also help me a great deal at posting more free trading content and signals here !!
🎉 👍 Shout-out to TradingShot's 💰 top TradingView Coin donor 💰 this week ==> gunhesss
--------------------------------------------------------------------------------------------------------

CHRA Awarded Large-Scale, 12-Year Ash Marketing ContractCharah Solutions Awarded Large-Scale, 12-Year Ash Marketing Contract by Dominion Energy for Beneficial Use of 8.1 Million Tons of Reclaimed Ponded Coal Ash
For the beneficiation and utilization of up to 8.1 million tons of reclaimed ponded coal ash at its Chesterfield Power Station in Chester, VA. Dominion Energy is headquartered in Richmond, VA.
As part of the agreement, Charah Solutions will install processing and transportation infrastructure in 2021 to facilitate rail transportation of the ash from Chesterfield Power Station to cement kiln feed markets.
finance.yahoo.com


SOS to Expand into Digital Assets Security IndustryDr. Huazhong (Eric) Yan A Renowned Cryptocurrencies Security Expert Joins SOS to Spearhead SOSs Effort to Expand into Digital Assets Security Industry
Dr. Yan is expected to utilize his cryptocurrency mining, protection, insurance expertise and his industry resources to lead SOS's efforts to set up a new business to apply blockchain-based security and insurance technologies in the safeguard of cryptocurrencies and digital assets, and strategically upgrade SOS's existing portfolios of products and services. SOS plans to set up a new wholly owned subsidiary SOS Digital Technologies Inc., to be led by Dr Yan.
SOS anticipates to utilize the new subsidiary to be spearheaded by Dr. Yan to provide the infrastructure services in blockchain security for its big data insurance marketing and rescue services, and even providing insurance and banking services for digital assets and cryptocurrencies.
Dr Yan has applied seven patents in China related to decentralized cryptocurrency wallets and exchanges, the protections and insurance for digital assets and cryptocurrencies, and blockchain-based security framework and solutions.
The truly decentralized cryptocurrency wallet and exchange technologies developed by Dr Yan have been proven to be bullet-proof. Once SOS Digital Technologies Inc is created, SOS plans to launch the first digital assets insurance company and the first cryptocurrency bank in the world, backed up by Dr Yan's technologies.
This venture is urgent as about 20% of cryptocurrencies are stolen or lost every year. Such venture is highly necessary as DCEP, the sovereign cryptocurrency offered by the central Bank of China, is in its testing stage and other sovereign cryptocurrencies are coming soon."
finance.yahoo.com

Completes Sale of Cimatron and GibbsCAM Businesses3D Systems Completes Sale of Cimatron and GibbsCAM Businesses and Provides Preliminary Financial Results for Fourth Quarter 2020
- Announces Date of Fourth Quarter and Full Year 2020 Financial Results
- Close of sale of non-core software businesses for cash proceeds of approximately $64 million
- Repayment of all debt outstanding under senior secured term loan. With the paydown of the term loan, the company is now free of any outstanding debt but continues to have availability under its senior secured revolving credit facility, which remains fully undrawn at this point.
- Official termination of ‘At-the-Market’ Equity Offering Program
- Strong Q4 preliminary financial performance with expected revenues between $170 million and $176 million
- Expected revenue reflects strong organic growth exceeding 20% in both Healthcare and Industrial business units on a consecutive quarter basis.
Essentially debt-free now, and free to focus on its two core 3D printer making businesses (industrial and healthcare), the company also noted that in addition to the better-than-expected sales, it is likely to report anywhere from $11 million to $19 million in pro forma profit for Q4.
Generally accepted accounting principles (GAAP) results could still be as bad as an $8.6 million loss, but there's at least the possibility that 3D will eke out a GAAP profit of as much as $0.5 million this quarter.
finance.yahoo.com

Perion Raises Financial Outlook case studyPerion Raises Financial Outlook, Expects 31% Year over Year Revenue Growth in the Fourth Quarter of 2020
Customers Momentum for Connected TV and "Full-Funnel" Solution Propel Advertising Business
"The acceleration of Perion’s advertising revenue growth is being driven by higher-than-expected revenue synergies from recent acquisitions, as well as higher demand across our CTV and video offerings"
following the four-year renewal of our partnership with Microsoft, announced earlier this quarter, we see an increased number of publishers who wish to engage with Perion’s search business unit. These achievements underscore the success of our diversification strategy and are expected to contribute to double digit revenue growth rates over the coming years for Perion."
e revised guidance for Q4 2020, implies that for the second half of 2020, revenue and Adjusted EBITDA ranges are $183-$188 and $22-$23 million, respectively, compared to the previously provided second half outlook of revenue and Adjusted EBITDA ranges of $164-$174 and $16-$18 million, respectively.
finance.yahoo.com

ATOM Sign Joint Development AgreementAtomera and Market Leading Semiconductor Company Sign Joint Development Agreement for Use of MST in Future Devices.
entered into JDA with a leading semiconductor provider for integration of Atomera's Mears Silicon Technology (MST) into their silicon fabrication process.
Atomera's MST is a patented, quantum-engineered material that enhances transistors to deliver significantly better performance in today's electronics.
New collaboration will leverage Atomera's transistor enhancement technology to develop improvements across the manufacturer's production lines
finance.yahoo.com

The Peck Company Holdings to Acquire iSun Energy LLCThe Peck Company Holdings to Acquire iSun Energy LLC, Award-Winning Solar-Powered Electric Vehicle Infrastructure Provider and Clean Energy Product Innovator
Accretive acquisition with $2M near-term revenue commitments, 30-40% project gross margin and a software platform for recurring energy service revenues.
Combining Peck’s profitable EPC business for solar, data and electrical contracting with award-winning products and platforms that are modular, scalable and connected is a powerful combination that differentiates the company from other solar EV charging companies.
iSun Energy near term pipeline is in Connecticut, Massachusetts, New York and other locations, to be announced shortly.
Timely market expansion capitalizes on the Biden administration’s plan to make major public investments in renewables and electric mobility infrastructure, including in 500,000 electric vehicle charging stations.
Industry experts anticipate 100 GWs of solar infrastructure will be constructed over the next 5 years, representing 50% growth.
finance.yahoo.com

Blade to become publicly listed on NASDAQ through EXPCBlade to Be Listed on Nasdaq, Creating the Only Publicly Traded Global Urban Air Mobility Company
Blade is a global urban air mobility platform, utilizing a technology-powered, asset light model with unrivaled brand recognition
Blade to become publicly listed on NASDAQ through a business combination with Experience Investment Corp. (NASDAQ: EXPC), a public entity sponsored by an affiliate of KSL Capital Partners, following expected transaction close in the first half of 2021
Transaction values Blade at an estimated pro forma equity value of $825 million upon consummation
Transaction to provide $400 million in gross proceeds, comprised of Experience Investment Corp.’s cash held in trust and an upsized and oversubscribed $125 million fully committed PIPE at $10.00 per share, including investment commitments from affiliates of KSL Capital Partners, Hedosophia, HG Vora Capital Management, and David Geffen, as well as original investors Barry Diller, David Zaslav and Robert W. Pittman
The capital raised will enable the Company to expand new urban air mobility routes, its network of captive passenger infrastructure, as well as its consumer-to-cockpit technology stack, accelerating its transition from use of conventional aircraft to Electric Vertical Take-Off and Landing (“eVTOL”) aircraft
Urban air mobility is expected to be a $125 billion market by 2025 and grow to $650 billion over the next decade, according to Morgan Stanley Equity Research.
www.businesswire.com

Anderson from Colliers reiterated a buy ratingAnalyst Charles Anderson from Colliers reiterated a buy rating on the stock while increasing its price target from $13 to $15.
Anderson is bullish on the company's prospects related to Sony's PlayStation 5, which incorporates Immersion's haptics technology in the new DualSense wireless controller. One of the notable additions to the newest generation of the game console is the inclusion of adaptive triggers in the controller, which facilitate a new level of haptic feedback for players.
Anderson has been using the DualSense controller and called it a "breakthrough" for Immersion to score such a high-profile design win in a mass-market application. Demand for the PS5 has been off the charts, with units flying off digital shelves within minutes of retailers getting additional inventory after launching last month.
"Immersion collects a royalty from each controller and we expect more than one controller will ship per console over time to support multiplayer gaming and to replace worn-out controllers,"
"The DualSense controllers are already available at retail ahead of the PlayStation 5 console launch."
Anderson believes that Immersion will be able to expand into other markets with its haptics technology offerings, and that the company has finally created an "efficient and predictable operating model."
www.fool.com
The analyst also notes that Immersion's fundamentals are becoming more predictable with 80% of revenue coming from per unit royalties, double the amount from four years ago.
seekingalpha.com

BARK to List on NYSE Through Merger with STICBARK, A Leading Brand for Dogs, to List on NYSE Through Merger with Northern Star Acquisition Corp.
BARK serves over 1 million dogs monthly through BarkBox and Super Chewer subscriptions and broad retail distribution of its comprehensive suite of best-in-class, proprietary products
projected revenues of approximately $365 million and gross margins of approximately 60% for fiscal year ending March 31, 2021, 179% YoY increase in revenue from new product lines in first half of FY2021, and net revenue CAGR FY2020-FY2023 of over 40%
Transaction values BARK at an enterprise value of approximately $1.6 billion and is expected to provide up to $454 million of gross cash proceeds to invest in the acceleration of new and existing product lines as well as international expansion
Top-tier institutional investors, including Fidelity Management & Research Company LLC, Senator Investment Group, the Federated Hermes Kaufmann Funds, and affiliates of the Santo Domingo Group, among others, are supporting the transaction with an upsized $200 million fully-committed PIPE
The Northern Star and BARK Boards of Directors have unanimously approved the proposed merger and the related transactions, which are expected to be completed early in the second quarter of 2021,
www.prnewswire.com

500.com Limited Announces Private Placement500.com Limited Announces Private Placement and Appointment of New Officers
500.com Limited (NYSE: WBAI) ("500.com" or the "Company"), an online sports lottery service provider in China, today announced that it has entered into a definitive share subscription agreement (the "Agreement") with Good Luck Information Technology Co., Limited ("Good Luck Information"), a company incorporated in Hong Kong, for the issuance and sale of newly issued Class A ordinary shares of the Company ("Class A Shares").
Pursuant to the Agreement, Good Luck Information will purchase 85,572,963 newly issued Class A Shares for a total purchase price of approximately US$23 million, to be settled in U.S. dollars or in crypto-currencies, including Bitcoin (BHC), to be determined chosen by the Company within one month of the date of the Agreement. Good Luck Information shall make full payment of the purchase price in currencies determined by the Company within one month of the Company's determination. The per share purchase price of US$0.269 is the closing trading price of the Company's ADSs on December 18, 2020, the last trading day immediately preceding the date of the purchase agreement. as adjusted by a 1-to-10 ADS to ordinary shares ratio.
Good Luck Information has agreed to subject all the shares it or its affiliate will acquire in the transaction to a contractual lock-up restriction for 180 days after the closing. The closing is expected to take place on or before February 20, 2021, upon satisfaction of customary closing conditions.
Good luck Information is controlled by Mr. Man San Vincent Law, a founder of the Company, who currently holds less than 5% of the Company's outstanding share capital. Upon closing, Good Luck Information will hold 16.6% of the Company's issued and outstanding ordinary shares.
finance.yahoo.com

EuroStoxx: divergence with RSI but...Hi Guys,
the divergence with RSI does not mean EuroStoxx will drop. It only shows that despite sentiment declining, index value keep going up.
Where are the opportunities?
Please share your views and comments below.
Thank you for your support and for sharing your ideas.
Cozzamara
Disclaimer:
Please note that I am not a professional trader and these are my personal ideas only. The information contained in this presentation is solely for educational purposes and does not constitute investment advice. The risk of trading in securities markets can be substantial. You should carefully consider if engaging in such activity is suitable to your own financial situation. Cozzamara is not responsible for any liabilities arising from the result of your market involvement or individual trade activities.
IMHO: The point of trading is to make money. To make money you must have money. Depending on the money at your disposal, you can decide what to do and how to do it. By having stops you decide how much you are willing to lose. By having targets you decide how much you want to earn. Be disciplined with your protocol and with your strategies for trading. Sometime you win, sometime you lose. Don't be greedy. Be realistic. Be wary but not afraid. Be curious. Use your brain. As long as your working process make sense and your spirit is calm, everything will be fine. Be patient and be prepared for any circumstances.

SPX: some infosHi Guys,
I see this...
What do you see?
Please share your views and comments below.
Thank you for your support and for sharing your ideas.
Cozzamara
Disclaimer:
Please note that I am not a professional trader and these are my personal ideas only. The information contained in this presentation is solely for educational purposes and does not constitute investment advice. The risk of trading in securities markets can be substantial. You should carefully consider if engaging in such activity is suitable to your own financial situation. Cozzamara is not responsible for any liabilities arising from the result of your market involvement or individual trade activities.
IMHO: The point of trading is to make money. To make money you must have money. Depending on the money at your disposal, you can decide what to do and how to do it. By having stops you decide how much you are willing to lose. By having targets you decide how much you want to earn. Be disciplined with your protocol and with your strategies for trading. Sometime you win, sometime you lose. Don't be greedy. Be realistic. Be wary but not afraid. Be curious. Use your brain. As long as your working process make sense and your spirit is calm, everything will be fine. Be patient and be prepared for any circumstances.

Can the market rise more during Biden's Presidency than Trump's?This is a simple chart showing the performance of the S&P500 under each President since the Ford administration is 1974.
As you see contrary to popular belief, the stock market in modern times has done (much) better under a Democrat President. Bill Clinton has had the strongest performance with more than +200% in gains from the day he went into the office till the day he left, while George W. Bush the worst and the only negative with -34% in losses.
Also this pattern shows that after every Republican Presidency, the Democrat administration that follows performs (much) better. Carter almost tripled Ford's performance, Clinton more than tripled George H. W. Bush's score. Needless to say what Obama did to George W. Bush's disappointing Presidency.
So in my opinion Wall Street shouldn't be seeing Trump's defeat as a setback, but as the start of a Presidency of more stock market gains than Trump's. History has a tendency to repeat itself. Wouldn't you agree? Let me know in the comments section!
Please like, subscribe and share your ideas and charts with the community!
--------------------------------------------------------------------------------------------------------
!! Donations via TradingView coins also help me a great deal at posting more free trading content and signals here !!
🎉 👍 Shout-out to TradingShot's 💰 top TradingView Coin donor 💰 this week ==> seba26-77
--------------------------------------------------------------------------------------------------------
