DOW JONES Sell SignalPattern: Bullish Megaphone on 4H.
Signal: Bearish as the price was rejected on the Megaphone's Higher High trend-line and broke through the (dashed) inner Higher High line.
Target: 24250 (roughly a -6% decline like the previous Higher High rejections, as well as contact with the 4H MA200).
** Please support this idea with your likes and comments, it is the best way to keep it relevant and support me. **
Previous DOW JONES trade:
Stockindex

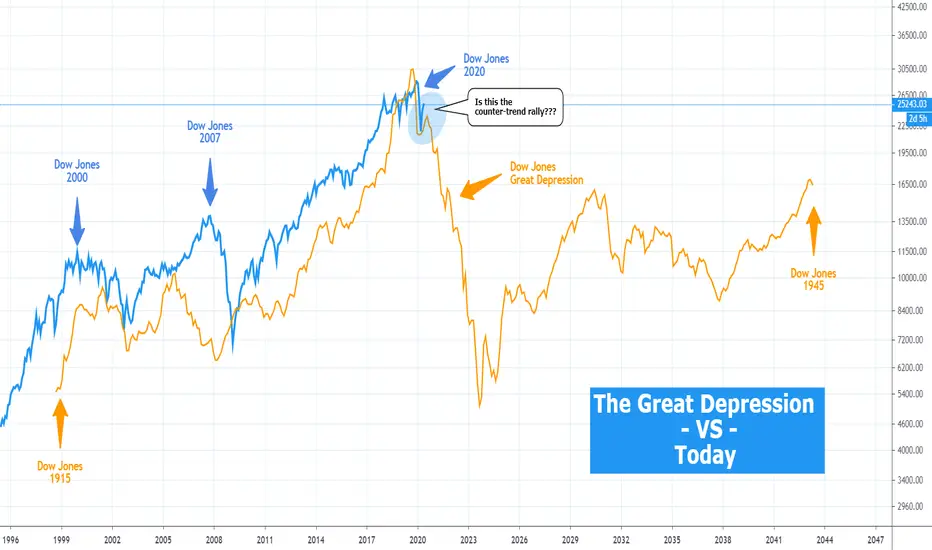
DOWJONES Is this the countertrend rally of the Great Depression?I will not spend much time describing this as the chart is pretty much self-explanatory.
I have plotted Dow Jones trend of 1915 - 1945 (orange line) which includes the Great Depression against the trend of the recent decades (late 90s to 2020) which is displayed in blue.
Do you think they look similar? And if so are we currently on a similar counter-trend rally as in the start of the Great Depression? The comments section is yours, let me know!
Please like, subscribe and share your ideas and charts with the community!
P.S. For the record, I am not trying to scare anyone, just shared an interesting comparison.
DAX Sell SignalPattern: Rectangle on 4H.
Signal: Bearish if the 4H MA50 breaks.
Target: 10200 (just above the Support).
** Please support this idea with your likes and comments, it is the best way to keep it relevant and support me. **
Recent DAX trade:

DAX Consolidation and possible top formationJust an observation on DAX. The index is consolidating within the 10150 Support and 11335 Resistance with the 1D RSI ranged too around roughly 53.00. Last time it was trading within those RSI levels was from December 2019 to February 2020. The sharp sell-off took place then. It appears that investors are once again unsure on how to move forward with the index and it may be a possible top formation where the market takes the March/ April profits heavily.
Just a thought. What do you think?
** Please support this idea with your likes and comments, it is the best way to keep it relevant and support me. **
Previous DAX trade:

S&P500 Trading PlanPattern: Channel Up on 4H.
Signal: (A) Bearish as the price is near the Higher High trend-line of the pattern. (B) Bullish if the Channel Up breaks above its Higher High trend-line.
Target: (A) 2830 (just above the inner Higher Low trend-line). (B) 3100.
** Please support this idea with your likes and comments, it is the best way to keep it relevant and support me. **


(FR40) Index to hit 4600 EUR Pretty SoonFirst off, please don't take anything I say seriously or as financial advice. As always, this is on opinion based basis and not meant to be taken seriously. That being said, let me get into my opinion. FR40 which is a French stock index for the Euronext Paris, have been hit pretty significantly as a result of Covid19 after being on a bullish recovery for almost a year prior. Now, as the markets are weighting in and people are starting to "panic sell less", I believe it is about to pass the 4600 euro threshold and likely to go on a stable price recovery trend. The 4600 EUR threshold crossing is likely within a week or so at most, but the recovery process is more of a long afterwards.

DOW JONES Signs of the Great Depression?This is a DJI comparison of the Great Depression and the phase that preceded it against the current COVID sell-off and the phase since the DotCom bubble that led to it.
** Please support this idea with your likes and comments, it is the best way to keep it relevant and support me. **
As you see both time phases are Megaphone patterns. Both started on high volatility (A,B,C,D) while the Megaphone was emerging and after testing the Higher High trend line for the longest time of the phase (E), the price broke above it making an over-extension (F). This is usually where most retail and other dumb money are trapped during recessions. What followed (F) during the Great Depression was of course a complete and lengthy collapse of the system, the worst recession in history. Also look how harmonically the 1M MA100 is moving on both patterns.
Will history repeat itself? I want to know your opinion about it.
*For the record the purpose of this comparison is not to spread panic, I will leave it to the mainstream media to do so. But it is so intriguing that I think can make a great discussion in the comment section below! So will it fill the gap?

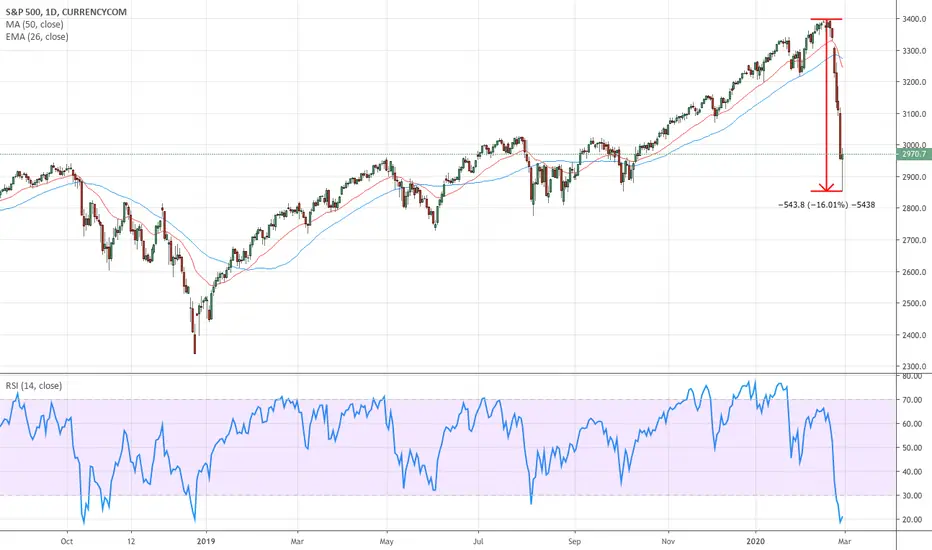
S&P500: Sell opportunity on the 1D MA50 rejection.On our last trading set-up we mentioned the potential that the Channel Down could be wider and since the 4H MA50 broke, the pattern would fill in a Lower High near the 0.618 Fibonacci retracement:
Right now we use the 1D chart (RSI = 52.588, MACD = -25.640, ADX = 24.177) and see that the recent stochastic run is being exhausted (STOCH = 83.359, STOCHRSI = 72.755). The reason is the 1D MA50 which is adding high selling pressure on the Lower High trend line of the Channel Down.
We are therefore now turning into medium term selling with our Targets being the Supports: 2,450 and 2,200 respectively.
** If you like our free content follow our profile (www.tradingview.com) to get more daily ideas. **
Comments and likes are greatly appreciated.

SPX Sell SignalPattern: Channel Up on 4H.
Signal: Bearish as the Channel made a Higher High exactly on the 4H MA200 and near the 0.382 Fib from ATH.
Target: 2550 (the 0.382 Fibonacci from today's High and right below the 4H MA50 which is on the Higher Low trend line).

DAX: Profit sideways unless we have a break-out.The German index is trading within a Channel Down on the 1H chart and at the moment the momentum is sideways (RSI = 54.078) within 9,950 and 9,300 (Lower High and Lower Low respectively).
If the Channel Down breaks upwards, then we will target the 10,400 - 10,750 zone while if it breaks downwards we will target the 9,060 - 8,800 zone.
** If you like our free content follow our profile (www.tradingview.com) to get more daily ideas. **
Comments and likes are greatly appreciated.

DJI Stock - A global market collapse 2020I am not an expert TA or Analyst. These messages are based on my own knowledge, research, and learnings. I may be wrong or I may be right but this is how I see the current market during a crisis within a crisis (financial & health crisis).
The sentiment speaks what the chart is telling us and currently, we are in FEAR & UNCERTAINTY or the people finally awake how our old financial system work. Let us see what really is 2020 for each one of us!
Stay safe, protect your assets and be smart! :)

S&P500 Buy SignalPattern: Channel Down on 1H.
Signal: Bullish as the price made a Triple Bottom and Lower Low on the Channel Down.
Target: 2600 (+10% rise as per the previous Lower Low).

DAX Trading plan for next weekPattern: Rising Wedge on 1D.
Signal: Bearish if the next opening is below the 4H MA50. Otherwise the signal is invalid.
Target: 13360 (right above the 4H MA200).

Dow Jones: Bullish MACD but top may be near.DJI is extending the 1D Channel Up (RSI = 60.150, MACD = 193.000, ADX = 15.316, Highs/Lows = 339.6071) after the MACD turned bullish following the January 31st bottom. However as the overall bullish pattern is the 1W Channel Up that started in July 2019, is near its Higher High trend line again, there is a high chance of a pull back.
Last time the 1D MACD turned bullish above the 0.000 mark, Dow peaked at +6%. We are close to that level (29,850) now, so a pull back towards the 1D MA50 (blue trend line) is realistic. If however the index follows the MACD bullish reversal patterns made below the 0.000 mark, then the extension can go as high as +8% (roughly 30,500) before the pull back to the MA50.
** If you like our free content follow our profile (www.tradingview.com) to get more daily ideas. **
Comments and likes are greatly appreciated.

DAX: Attention needed. Bearish fractal to 12,800.The index has made a marginal All Time High today but the 1D RSI remains on a bearish divergence (RSI = 59.286, MACD = 52.400, ADX = 20.325) within the 1W Channel Up. This pattern resembles the May- July 2019 top sequence which ended with a strong decline towards the 1D MA200 (orange line).
If the 1D MA50 (blue line) is crossed again, we are expecting this time contact with the MA200. Our Target Zone is 12,700 - 12,870.
** If you like our free content follow our profile (www.tradingview.com) to get more daily ideas. **
Comments and likes are greatly appreciated.

S&P/TSX Composite Index can test Minor Resistance LevelsWhen we look at Canadian instruments during the Autonomous LSTM Adaptive period:
We see a cheapness in both stock markets and currency.
Even though I have a positive opinion about the target, let's try it out in small quantities and leave more position size in case of a second try on negative scenario.
This analysis can be more risk-free with the following parameters:
Position Size : %1 for Index Futures or Small percentage of Portfolio
Risk/Reward Ratio = 1/1.99
Stop-Loss : 16911.75
Goal : 18032
NOTE:
The unapproved short signal is the leading indicator of volatile movements.
So let's be careful.
Let's leave more room for the second attempt, which, when the circumstances are in our favor, let us gain much more of our loss.
Regards.

DAX: Sell opportunity within the Channel Up.DAX is trading within a 1D Channel Up since early November. At the moment the price is next to the Higher High trend line, which is technically an optimal sell entry assuming the pattern holds. With the RSI also at the top of its 2 month consolidation channel, we treat this as a strong medium term sell opportunity. Our Target Zone is 13,165 - 13,100.
** If you like our free content follow our profile (www.tradingview.com) to get more daily ideas. **
Comments and likes are greatly appreciated.

S&P500 Conditional Sell SignalPattern: Rising Wedge.
Signal: Bearish if the Higher Low trend line breaks.
Target: 3,170 (potential contact with the 1H MA50) and 3,135 (potential contact with the 1H MA200).

S&P500: Attention. 4H Death Cross emerging.SPX is currently on the wrong foot again as last week's quick recovery on the impressive Nonfarm Payrolls is proving to be too unstable. The index is well within the multi month 1W Channel Up (RSI = 64.964, MACD = 69.900, Highs/Lows = 55.7180) but as it trades on the Higher High trend line, a medium term pull back for a Higher Low is technically justified.
The first Signal on this could be the emerging Death Cross formation on 4H. When then very same pattern was formed (August 5th and May 13th) during the two previous Higher Highs of the multi month Channel Up, S&P was either on the new Higher Low (bottom) or halfway to it. It is obvious then that traders position themselves before this formation takes place and currently it is emerging.
Each decline was roughly -8%, so we've set a Target Zone of 2,910 - 2,950.
** If you like our free content follow our profile (www.tradingview.com) to get more daily ideas. **
Comments and likes are greatly appreciated.

Dow Jones: Sell opportunity. Potential Double Top.DJI has extended the 1W Channel Up (RSI = 65.157, MACD = 519.030, Highs/Lows = 742.8189) that has previously provided a handful of trading opportunities (see bottom of the analysis).
At the moment a Double Top is being formed on 1D, which since April has been a bearish signal, later initiating a decline towards the Higher Low zone (where the 1D MA200 always supported).
We are expecting a similar behavior especially since the current levels are nearly overbought on 1D (RSI = 69.814). Our Target Zone is 27,000 - 26,800.
See the previous successful signals within this pattern below:
** If you like our free content follow our profile (www.tradingview.com) to get more daily ideas. **
Comments and likes are greatly appreciated.

S&P: Bearish reversal (2,950) with invalidation level.As per our last study, the +100 pip target has been reached:
The index has approached the Higher High zone of the 1W Channel Up (RSI = 64.884, MACD = 62.620, Highs/Lows = 78.1742) and the 1D RSI is close to the 71.30 level which since February 2019 has always caused a pull back.
When on the Higher High trend line of the 1W Channel Up in particular, the 71.00 1D RSI level starts a bearish sequence that drops all the way to the Higher Low trend line, with the 1D MA200 (orange) acting as the Support.
S&P is now on such a spot and if this pattern is repeated then we are looking at a Higher Low contact with the 1D MA200 at least at 2,950.
Attention is needed however. As per our last study (seen on the chart above), it is possible for SPX to start a new 12 month aggressive bullish sequence if 3,150 breaks (similar to what happened in 2016/2017). So be ready to exit this trade in time if you are a long term trader/ investor.
** If you like our free content follow our profile (www.tradingview.com) to get more daily ideas. **
Comments and likes are greatly appreciated.
