NASDAQ rally still has lots of upside before is tops.Nasdaq (NDX) is technically respecting the 2-year Channel Up that it's been trading in since the December 26 2022 market bottom. Its most recent Higher Low was on the August 05 2024 1W candle, which initiated the Bullish Leg we're currently in.
As you see, the previous two Bullish Legs had one main pull-back/ correction sequence each and apart from that, the majority of the Leg was technically a straight uptrend. Given that the current Bullish Leg already had a strong pull-back early on (August 26 - September 02 1W candles), it may continue to rise up to its target without another correction, assuming the 1D MA100 (red trend-line) holds.
If however it has another pull-back similar to the previous Bullish Leg (March 04 - April 15 2024), then it should rise some more near the 0.236 Fibonacci level and then pull-back.
In any event, the current level is technically a solid long-term buy entry and since both previous Bullish Legs have been around +48%, we expect to see 25300 before the current one tops.
-------------------------------------------------------------------------------
** Please LIKE 👍, FOLLOW ✅, SHARE 🙌 and COMMENT ✍ if you enjoy this idea! Also share your ideas and charts in the comments section below! This is best way to keep it relevant, support us, keep the content here free and allow the idea to reach as many people as possible. **
-------------------------------------------------------------------------------
💸💸💸💸💸💸
👇 👇 👇 👇 👇 👇
Stockindex

DOW JONES 25-year Cycles show the clear picture you should know.Almost 8 months ago (April 12, see chart below), just when Dow Jones (DJI) was recovering from April's correction, we sent a clear message not to lose sight of the greater picture and to stay bullish:
The reason was the index' clear cyclical pattern since the February 2009 bottom of the U.S. Housing Crisis. The index has grown by +17% since that analysis (from 38459 to 45080) and we can't see a reason not to complete the pattern and hit our 48850 Target, which is our projection for this Cycle's Top.
On this updated chart is on the 1W time-frame, in contrast with April's which was on the 1M, we have added to key elements. The Channel Up that is dictating the pace of the Bull Cycle since the Feb 2009 bottom and the Fibonacci retracement levels, which show that after the Bull Cycle topped, the subsequent Bear Cycle corrected within the 0.236 - 0.382 Fibonacci Zone at least before the bottom was formed.
In fact, all Cycles hit the 1M MA50 (blue trend-line) upon the Bear corrections and those didn't start before the 1W MA50 (red trend-line) was broken (1M candle close below). Our 48850 Target is technically the minimum estimate as that was the % rise of the previous one (Cycle 4), which was the least aggressive compared to others (Cycle 3 = +77.19%, Cycle 2 = +75.09%, Cycle 1 = +99.62%). If Cycle 5 peaks higher, we will draw the Fibonacci retracement levels from that top and re-adjust our expected 0.382 Fibonacci bottom for the Bear Cycle (or if the 1M MA50 gets hit first).
As far as timing of the Cycle 5 Top is concerned, we expect that to be on December 2025 the earliest, again based on the Cycle with the minimum time length (Cycle 3), excluding Cycle 1 which was the most aggressive as it was the first after the U.S. Housing Crisis bottom.
-------------------------------------------------------------------------------
** Please LIKE 👍, FOLLOW ✅, SHARE 🙌 and COMMENT ✍ if you enjoy this idea! Also share your ideas and charts in the comments section below! This is best way to keep it relevant, support us, keep the content here free and allow the idea to reach as many people as possible. **
-------------------------------------------------------------------------------
💸💸💸💸💸💸
👇 👇 👇 👇 👇 👇

DAX Strong probability for a technical pull-back here.DAX (DE40) hit last week our 20000 Target, which we established 2 months ago (October 04, see chart below):
That Target was near the top (Higher Highs trend-line) of the 1-year Channel Up that started on the week of the October 03 2022 bottom. As you can see, this pattern has topped both previous Bullish Waves on the 1.618 Fibonacci extension level and after a pull-back consolidation phase (red Arc), it started the Bearish Legs that bottomed and made Higher Lows on Support 1, which was the previous Resistance level.
Having now already hit its 1.618 Fib ext, we expect DAX to pull-back a little and turn sideways as per the pattern, which we will short, targeting 19000 (Support 1). If however we see a 1W MA200 (blue trend-line) hit and immediate rebound and weekly closing above it, we will book our sell profit earlier.
Notice also the high symmetry on those Legs, between their 1W CCI fractals.
-------------------------------------------------------------------------------
** Please LIKE 👍, FOLLOW ✅, SHARE 🙌 and COMMENT ✍ if you enjoy this idea! Also share your ideas and charts in the comments section below! This is best way to keep it relevant, support us, keep the content here free and allow the idea to reach as many people as possible. **
-------------------------------------------------------------------------------
💸💸💸💸💸💸
👇 👇 👇 👇 👇 👇

S&P500 What will happen in 2025 and 2026 based on this pattern?The S&P500 index (SPX) has had an excellent run since the time (August 28, see chart below) we introduced the following piece of analysis on the similarities between the 2015 - 2017 fractal and today's 2022 - 2024:
As you see, the index rose by around +8.50% from 5625 to 6100 in only 3.5 months. We are still expecting a local top just below the 3.0 Fibonacci extension, with our Target in tact at 6500.
If it continues to replicate the past pattern into the 2018 fractal as well, then we may experience the last correction of the Bull Cycle around March 2025 towards the 1W MA50 (blue trend-line) as it happened in February - March 2018 and then the final rally to a new All Time High (ATH) towards the end of the year (October - December 2025).
What this pattern shows, and what we've presented to you as a possible scenario on previous analyses, is for a new Bear Cycle to begin in 2026, four years after the Inflation Crisis of 2022, that will once more test the 1W MA200 (orange trend-line), which is the market's long-term Support.
As a side-note to investors, it is important to understand that corrections are cyclical and crises systemic. Long-term, multi-year patterns like this, help us understand with a certain degree of efficiency, when to enter and when to exit. Timing is at times (especially on such long-term horizons), more important than pricing.
-------------------------------------------------------------------------------
** Please LIKE 👍, FOLLOW ✅, SHARE 🙌 and COMMENT ✍ if you enjoy this idea! Also share your ideas and charts in the comments section below! This is best way to keep it relevant, support us, keep the content here free and allow the idea to reach as many people as possible. **
-------------------------------------------------------------------------------
💸💸💸💸💸💸
👇 👇 👇 👇 👇 👇

NASDAQ consolidation until the CPI.Nasdaq (NDX) hit our 21650 Target that we set exactly 2 weeks ago (November 25, see chart below) and is now entering a consolidation phase (orange Rectangle):
As long as the 4H MA50 holds, the uptrend will stay intact within this 3-month Channel Up. We believe that this consolidation is similar to the September 13 - 19 price action, which also started after a +6.80% rise and with the support of the 4H MA50, it resumed the rally and peaked on the 1.5 Fibonacci extension.
As a result, we expect Nasdaq to stay ranged until Wednesday's U.S. CPI report and following that to resume the uptrend, targeting 22300 (just below the 1.5 Fib).
-------------------------------------------------------------------------------
** Please LIKE 👍, FOLLOW ✅, SHARE 🙌 and COMMENT ✍ if you enjoy this idea! Also share your ideas and charts in the comments section below! This is best way to keep it relevant, support us, keep the content here free and allow the idea to reach as many people as possible. **
-------------------------------------------------------------------------------
💸💸💸💸💸💸
👇 👇 👇 👇 👇 👇

DOW JONES High Channel Up symmetry points to 46000.Dow Jones (DJI) easily hit our 45000 Target as suggested on our November 20 idea (see chart below), and immediately turned sideways, consolidating basically for the past 6 days:
This is not the first time that we've come across this consolidation within the 4-month Channel Up as the exact same sequence was last seen during September 20 - October 08. As with today's price action, the consolidation also took place above the 1.0 Fibonacci level and once completed, it gave one final push to the 1.5 Fibonacci extension before correcting back to the 1D MA50 (blue trend-line).
As a result, we now set a new Target for the end of the year at 46000.
-------------------------------------------------------------------------------
** Please LIKE 👍, FOLLOW ✅, SHARE 🙌 and COMMENT ✍ if you enjoy this idea! Also share your ideas and charts in the comments section below! This is best way to keep it relevant, support us, keep the content here free and allow the idea to reach as many people as possible. **
-------------------------------------------------------------------------------
💸💸💸💸💸💸
👇 👇 👇 👇 👇 👇

NASDAQ Santa rally is starting.Nasdaq (NDX) has been following the blueprint of the 2020/21 Bull Cycle to high precision so far, as we showed on our analysis almost 4 months ago (August 19, see chart below):
As you can see it is already marching towards Target 1 (23250) on the 0.236 Fibonacci retracement level, well inside the Channel Up. We expect that to get hit by the final week of December, which can be translated as the infamous 'Santa rally', a frequent seasonal price increase at the end of the year.
As mentioned, this Channel Up displays strong similarities with the patterns of August 2020 - November 2021 and before the COVID crash of December 2019 - February 2020. All those Channel Up patterns are within the dominant long-term structure of the 6-year Bullish Megaphone.
The key here is for the 1W MA50 (blue trend-line) to hold and continue to offer support, as within those 6 years the only two times it broke were during the corrections of the 2022 Inflation Crisis and the March 2020 COVID flash crash.
As long as it holds, the current Channel Up should, besides the immediate Target 1 (23250), complete the sequence and peak towards the end of 2025 as close to a +185% rise (from the October 2022 bottom) as possible. This is why our long-term strategic Target (2) is a little lower at 27000.
As a side-note, see how well the 1W RSI held and bounced in September on the Symmetrical Support Zone, in similar fashion as 2020 - 2021. Also the 1W MACD displays a similar pattern between the two fractals.
-------------------------------------------------------------------------------
** Please LIKE 👍, FOLLOW ✅, SHARE 🙌 and COMMENT ✍ if you enjoy this idea! Also share your ideas and charts in the comments section below! This is best way to keep it relevant, support us, keep the content here free and allow the idea to reach as many people as possible. **
-------------------------------------------------------------------------------
💸💸💸💸💸💸
👇 👇 👇 👇 👇 👇

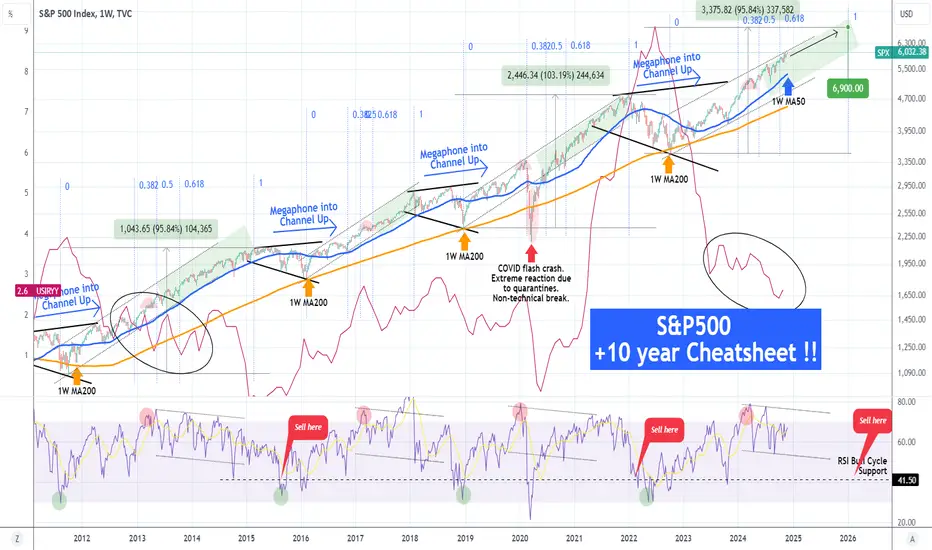
S&P500 This Inflation Cheatsheet shows no correction in 2025.This is a chart we first posted almost 4 months ago (August 14, see chart below) at the time of a CPI date release, where we viewed the S&P500 index (SPX) against Inflation (red trend-line) and calling for an immediate buy:
** The 1W MA50 as the ultimate Support **
Well the price jumped +11% since then from 5440 to over 6000. The first principle of this chart is that as long as the 1W MA50 (blue trend-line) is supporting, investors should stay bullish. This is because all previous multi-year rallies since August 2011 that started within a Channel Up, ended upon a 1W candle close below the 1W MA50 and transitioned into a Megaphone pattern for the new Bear Phase.
** Declining Inflation fueling stocks **
Right now we are still on a declining Inflation trend, very similar to early 2014 (ellipse shape on Inflation), while the 1W RSI of SPX is declining inside a Channel Down. This is a Bearish Divergence, which during all previous SPX Channel Up patterns, didn't make the index top until the RSI broke below its 41.50 Support (notable exception of course the March 2020 COVID flash crash which was a one in 100 years Black Swan event).
** SPX Target and timing **
As a result, while the 1W RSI trades within its Channel Down and above 41.50 and all price candles close above the 1W MA50, we expect the index to extend the multi-year uptrend to 6900, which would represent a +95.84% rise from the October 2022 bottom, similar to the February 2015 High. Notice that the December 2021 top was also of a similar magnitude (+103%).
As far as timing is concerned, we have calculated a model based on the 1W RSI top and the start of its Channel Down. As you see at that point, SPX always makes a medium-term pull-back (red Arc). This tends to be within the 0.382 - 0.618 time Fibonacci levels and on the 2011 - 2014 Bull Cycle, that was within the 0.382 - 0.5 Fib zone. As a result, applying this principle on the current Bull Cycle, the trend is now just 2 months past the 0.618 time Fib and we can expect a Cycle Top around December 2025.
-------------------------------------------------------------------------------
** Please LIKE 👍, FOLLOW ✅, SHARE 🙌 and COMMENT ✍ if you enjoy this idea! Also share your ideas and charts in the comments section below! This is best way to keep it relevant, support us, keep the content here free and allow the idea to reach as many people as possible. **
-------------------------------------------------------------------------------
💸💸💸💸💸💸
👇 👇 👇 👇 👇 👇
DOW JONES is respecting our major August buy call beautifully.Dow Jones (DJI) is about to hit the 45000 Target on our last buy call (November 20, see chart below) and complete a +8.30% Bullish Leg rise within the Channel Up that started on the August 05 Low:
We are very pleased also to see the index making enormous progress after our big August buy (Aug 07 idea, see below) which was exactly on the last major Low of Dow:
As you can see, we successfully formulated that trade based on the extremely symmetric price action of 2016 - 2017. We've explained the notion on the previous idea, but we will refresh your memory if you read this analysis for the first time.
Dow was already trading within a Rising Wedge pattern in 2016, which towards its end broke upwards and first completed a +19.50% rally. The second Leg of the Bull rally was completed on a +30.70% rise from the pull-back Low and then the markets entered the multi-month volatile period of the U.S. - China trade wars. Key Lows of the Bull Rally were made in October 2016, April 2017 and the last in August 2017. It is important to note that after the August 2017 Low, the index had the most aggressive part of the rally, attached to the top band of the Bollinger Bands range, which is what we've called before "riding the BB wave".
Back to more recently and the Rising Wedge that started in 2022, it broke upwards in identical fashion as 2017 (first Leg +23.40%, Lows in October 2023, April 2024 and the most recent August 2024, which as you saw was our last major buy). Even the 1W RSI sequences between the two fractals are similar. What's left now is for Dow to complete a +30.70% rise from the August 2024 Low, in order to conclude the pattern from 2017.
Our long-term Target since August remains thus intact at 49000. Keep in mind that this is the essence of long-term investing/ trading and this is the strategy with the highest winning rate. Note also that if it takes the same time to conclude as the 2017 Leg did from the August 2017 Low (green Rectangle, 168 days), then the peak should be formed end of January/ early February 2025.
-------------------------------------------------------------------------------
** Please LIKE 👍, FOLLOW ✅, SHARE 🙌 and COMMENT ✍ if you enjoy this idea! Also share your ideas and charts in the comments section below! This is best way to keep it relevant, support us, keep the content here free and allow the idea to reach as many people as possible. **
-------------------------------------------------------------------------------
💸💸💸💸💸💸
👇 👇 👇 👇 👇 👇

S&P500 Don't expect the rally to stop now.Our last S&P500 (SPX) analysis (November 18, see chart below) gave us the ideal buy entry on the 0.5 Fibonacci retracement level, with the price immediately responding with a rebound:
The rebound took place on the 4H MA200 (orange trend-line) and we are now even past the 4H MA50 (blue trend-line). Despite the strong uptrend, this rally is far from over technically, as not only is the 4H RSI below the (70.00) overbought barrier where it has given the first bearish signs near the two previous Higher Highs, but also significantly lower than the top (Higher Highs trend-line) of the September 06 Channel Up.
As a result we expect a continuation of the current Bullish Leg. The previous one peaked on the 1.786 Fibonacci extension, so our Target is now just below it at 6150.
-------------------------------------------------------------------------------
** Please LIKE 👍, FOLLOW ✅, SHARE 🙌 and COMMENT ✍ if you enjoy this idea! Also share your ideas and charts in the comments section below! This is best way to keep it relevant, support us, keep the content here free and allow the idea to reach as many people as possible. **
-------------------------------------------------------------------------------
💸💸💸💸💸💸
👇 👇 👇 👇 👇 👇

DOW JONES bouncing on the 4H MA200 and 0.5 Fibonacci.Dow Jones (DJI) found Support yesterday exactly on its 4H MA200 (red trend-line), after just a brief break of the 0.5 Fibonacci retracement level. The dominant pattern has been a Channel Up since the August 05 Low and within it, every 0.5 Fib test from the previous Low, has been the most effective buy entry as it started the new Bullish Leg.
The technical symmetry within this pattern is astounding as every Bullish Leg hit its 1.236 Fibonacci extension, completing a +8.30% rise. The ROC Higher Lows indicates that a rebound should be expected right now.
We haven't had a 1.236 Fib extension since the elections Low, so naturally take this 4H MA200 / 0.5 Fib bounce to buy if you haven't and target 45000 (also +8.30% rise).
-------------------------------------------------------------------------------
** Please LIKE 👍, FOLLOW ✅, SHARE 🙌 and COMMENT ✍ if you enjoy this idea! Also share your ideas and charts in the comments section below! This is best way to keep it relevant, support us, keep the content here free and allow the idea to reach as many people as possible. **
-------------------------------------------------------------------------------
💸💸💸💸💸💸
👇 👇 👇 👇 👇 👇

NASDAQ targeting 25400 in the next 6 months. Don't miss this!!Nasdaq (NDX) hit this month our 20900 long-term Target, a level we called 3 months ago (August 12, see chart below):
As you can see, the index has been trading within a 2-year Channel Up and with the use of the Fibonacci Channel levels, we can determine on which phase of the Cycle we are.
Right now we are on the stage where the price has been rejected near the 0.786 Fib and pulled-back to the 0.5 Fib and the 1D MA50 (blue trend-line). This is exactly what took place from December 28 2023 to January 05 2024, i.e. during the previous Bullish Phase of the Channel. You can see that with the use of the Time Cycles, we can identify that the first such phase was on February 01 2023.
This is the phase that we've just completed and remarkably all 3 within the Channel Up completed a +20.88% rise. This further proves that the symmetry within this pattern is astounding. The larger Bullish Leg was completed on the previous two phases with a +49% and +48% rise respectively, so technically it is natural to assume that the current Bullish Phase (from the August 05 2024 bottom) will be completed on a +47% rise (-1% less than previously) at least.
This is why we're expecting to see 25400 as the next Higher High on a 6 month horizon.
-------------------------------------------------------------------------------
** Please LIKE 👍, FOLLOW ✅, SHARE 🙌 and COMMENT ✍ if you enjoy this idea! Also share your ideas and charts in the comments section below! This is best way to keep it relevant, support us, keep the content here free and allow the idea to reach as many people as possible. **
-------------------------------------------------------------------------------
💸💸💸💸💸💸
👇 👇 👇 👇 👇 👇

S&P500 completed a 0.5 Fib correction. Strong buy opportunity.The S&P500 index (SPX) reached on Friday the 0.5 Fibonacci retracement level, a technical correction that started after the price made a Higher High at the top of the 2-month Channel Up. The 1D MA50 (blue trend-line) has been tested (and held) already on the day of the U.S. elections, so now we are technically still on the new Bullish Leg of the pattern.
As you can see, since the April 19 2024 bottom and the start of the even longer Bullish Megaphone pattern, every time a pull-back stopped within the 0.382 - 0.5 Fib range, the index resumed the bullish trend towards the -0.618 Fib extension. The 1D MACD with its Bullish and Bearish Crosses, is also illustrating this symmetry.
As a result, we believe that the current pull-back is over and we are now targeting 6210, which is within to potential -0.618 Fib targets.
-------------------------------------------------------------------------------
** Please LIKE 👍, FOLLOW ✅, SHARE 🙌 and COMMENT ✍ if you enjoy this idea! Also share your ideas and charts in the comments section below! This is best way to keep it relevant, support us, keep the content here free and allow the idea to reach as many people as possible. **
-------------------------------------------------------------------------------
💸💸💸💸💸💸
👇 👇 👇 👇 👇 👇

DOW JONES 4H Golden Cross extending the rally.Dow Jones (DJI) gave us an excellent pre-election buy signal (October 29, see chart below) as it bottomed on the 0.5 Fibonacci retracement level and just below the 1D MA50 (red trend-line), in similar fashion as the September 11 Low, which then rallied to the 1.236 Fib extension:
As you can see, we hit our 44000 Target, which was again the 1.236 Fib ext, but a new bullish possibility emerges. The 4H RSI is about to turn bearish (below 45.00) after being overbought (above 70.00) for 7 days. Last time this happened was on August 22, the fractals are virtually identical. During that time, the price made a Higher Low and continued to peak after a +8.30% rise in total.
After another 0.5 Fib correction, the next Bullish Leg if the 3-month Channel Up was also +8.30%, indicating that there is high symmetry between the Legs of this pattern. Notice also the presence of a 4H Golden Cross both on the current as well as on the August Leg.
As a result, since we still have some distance before completing a +8.30% Bullish Leg increase, we go long again as long as the 4H MA50 (blue trend-line) holds, targeting 45000.
-------------------------------------------------------------------------------
** Please LIKE 👍, FOLLOW ✅, SHARE 🙌 and COMMENT ✍ if you enjoy this idea! Also share your ideas and charts in the comments section below! This is best way to keep it relevant, support us, keep the content here free and allow the idea to reach as many people as possible. **
-------------------------------------------------------------------------------
💸💸💸💸💸💸
👇 👇 👇 👇 👇 👇

S&P500 Eyeing 6180 on this diverging Channel Up.The S&P500 index (SPX) has been trading within a Channel Up pattern since the July 27 2023 High. More recently it has been following a shorter (dotted) Channel Up since the August 05 2024 Low, which made its most recent Higher Low on the 1D MA50 (blue trend-line) the day before the U.S. elections.
The rally that followed since, hit the top of the 1-year Channel Up but the current 2-day red streak may not be a rejection to the new Bearish Leg (red Channels) as the (dotted) diverging Channel Up is on its 2nd Bullish Leg. If it is similar in strength to the September - October one, then we expect to see 6180 short-term.
As you can see, every Bullish Leg of the 1 year Channel Up has consisted of two smaller buy highly symmetric Bullish Legs, all of which look very similar with each other (black sequences).
-------------------------------------------------------------------------------
** Please LIKE 👍, FOLLOW ✅, SHARE 🙌 and COMMENT ✍ if you enjoy this idea! Also share your ideas and charts in the comments section below! This is best way to keep it relevant, support us, keep the content here free and allow the idea to reach as many people as possible. **
-------------------------------------------------------------------------------
💸💸💸💸💸💸
👇 👇 👇 👇 👇 👇

NASDAQ Extremely bullish for the next 30 days.Nasdaq (NDX) is extending a very aggressive post-election rally that is coming after a clear technical hold on the 1D MA50 (blue trend-line). This is just a short-term movement inside a (blue) Channel Up that emerged after the index rebounded on the 1D MA200 (orange trend-line), which in turn is the Bullish Leg of the 2-year Channel Up pattern.
As you can see, the price action is so far very similar to the Channel's previous Bullish Leg that also started on a 1D MA200 hold (October 26 2023). Based on the 1D MACD's Bullish Cross and the 1D RSI bullish reversal, we are in symmetrical terms on a situation similar to January 23 2024, with the price above the 0.618 Fibonacci retracement level.
We still expect a similar +30% rise from the last bottom (August 05) to be completed, so our 22000 medium-term Target is intact.
-------------------------------------------------------------------------------
** Please LIKE 👍, FOLLOW ✅, SHARE 🙌 and COMMENT ✍ if you enjoy this idea! Also share your ideas and charts in the comments section below! This is best way to keep it relevant, support us, keep the content here free and allow the idea to reach as many people as possible. **
-------------------------------------------------------------------------------
💸💸💸💸💸💸
👇 👇 👇 👇 👇 👇

NASDAQ rally still at its start. Very high upside post electionsExactly 3 months ago (August 05, see chart below) when Nasdaq (NDX) erased the gains of 3 months and was sold-off to its 1W MA50 (blue trend-line) we posted the following idea using the 2-year Fibonacci Channel Up on the index, claiming that it was the best buy entry in recent months:
The buy turned out to be very effective as the index rebounded aggressively and last week made a 3-month High. Ahead of the U.S. elections today and the natural short-term volatility that they will inflict on the market, we decided to bring that chart forward again, as it will help keep an unbiased long-term perspective that will filter out the short-term noise.
As you can see the index held its 1D MA50 (red trend-line) last week despite the sharp pull-back. The price remained within the 0.382 - 0.5 Zone of the Fibonacci Channel, while the 1W RSI is holding its MA (yellow trend-line). Every time the index got in a similar situation within this Channel Up, it still had much upside left before it topped.
At the same time, we are just below the 0.5 Fib level of a projected +47% rise from the August bottom (sequence of Bullish Legs since the start +49%, then +48%, next +47%), a symmetric pattern showing the strong potential of the index, as long as the 1W MA50 (blue trend-line) holds.
For the 1st Stage of the current Bullish Leg, we have a minimum Target of 22500 for the end of the year, which represents the rally that the May 27 2024 and January 01 2024 pull-back rebounds had that held the 1D MA50. As for the full length of the Bullish Leg, which is our long-term Target, we still expect the index to complete a +47% and reach 25400.
-------------------------------------------------------------------------------
** Please LIKE 👍, FOLLOW ✅, SHARE 🙌 and COMMENT ✍ if you enjoy this idea! Also share your ideas and charts in the comments section below! This is best way to keep it relevant, support us, keep the content here free and allow the idea to reach as many people as possible. **
-------------------------------------------------------------------------------
💸💸💸💸💸💸
👇 👇 👇 👇 👇 👇

Can you envision S&P500 at 20k? This is why most investors fail!If you follow us through all those years then you know how fond we are of long-term patterns. Especially those of a multi-year perspective that can offer maximum reliability and as close to a flowless projection as it can get.
The current chart (1M time-frame) on the S&P500 index (SPX) is no exception and you might be no strangers to it as we've published it on April 10 2024 (see chart below) when the price was still at 5200 (against 5700 now):
That was at a time of high market uncertainty after a strong start to the year and as we were entering the bearish seasonality of Summer. This rise however should come as no surprise to those that can read charts and market behavior objectively. As we mentioned at the time, this is a long-term perspective that gives you the picture unfiltered with the facts only.
What you see on this chart is S&P's Cycle Analysis on a century wide scale from the rally in 1921 that led to the Great Depression. Since that 'mother of all recessions', the stock market started to create a pattern of clear systemic behaviors. Each time there are fundamentals involved that merely serve as 'reasons/ excuses' to fill out and complete this pattern.
** Great Depression: 1st Bull Cycle **
Following the 1932 Great Depression bottom, the 1st Secular Bull Cycle begun, that lasted for 28.5 years (343 months) rising by +1888%. Then the Secular Bear Cycle started in the form of a Megaphone pattern. Its 1st Low was formed below the 1M MA100 (green trend-line) and the 2nd Low (the Cycle's bottom) was formed below the 1M MA200 (orange trend-line).
** Vietnam War to High Inflation: 2nd Bull Cycle **
The 2nd Secular Bull Cycle lasted for almost 26 years (311 months) and saw +2361% growth. As per our blueprint, the Secular Bear Cycle was initiated once the 1M MA50 (blue trend-line) broke. Again the 1st Low was formed below the 1M MA100 and the 2nd Low below the 1M MA200.
** Post 2008 Housing Crisis: 3rd Bull Cycle **
With regards to the current Cycle, which is what most are interested at naturally, notice how the 1M MA50 has been supporting since late 2011. It emphatically held both on the September 2022 Low (Inflation crisis bottom) and the March 2020 Low (COVID crash bottom). This indicates again that as long as it supports, the Secular Bull Cycle will be extended.
Based on the previous Cycle-to-Cycle parameters the model suggests that the current Cycle should be a little than 23 years long (279 months, i.e. 32 month shorter than the previous) and rise by +2834% (+473% higher than the previous).
That gives us a rough target for the S&P500 of around 20000 estimated to take place by 2032!
** New updates: Price and Time Fibonacci levels **
What we've added on the current updated analysis relative to the on in April 2024, are the Fibonacci levels both on the x (time) and y (price) axis.
As you can see, the S&P is currently exactly on the 0.618 Fib price axis and between the 0.618 - 0.786 Fib time axis. That is a highly symmetric correlation with roughly the year 1992, right at the start of the Dotcom Bubble that led to the 2000 burst and subsequent crisis. The index was again on the 0.618 Fib price axis and within the 0.618 - 0.786 Fib time axis.
** Is A.I. the new Dotcom? **
It was the Internet Mania that accelerated the 1974 - 2000 Bull Cycle to its peak and this time it may be the A.I./ Blockchain/ Crypto etc Mania that may aggressively lead the current (2009 - 2032) Bull Cycle to the next Great Recession. Note that just like the Internet didn't go away because of a mere act of amazing greed (the Dotcom Bubble) but instead served as the backbone of the Age of Information and a new Economy (e-commerce, social media, digital investing etc), the A.I. Bubble that has started fueling the market since 2023 shouldn't be demonized when it pops and in our opinion won't go away but instead serve as the backbone of the next Age of Reality and Commerce (metaverse, augmented reality, robotics, artificial intelligence, electric vehicles etc).
It has to be said, that the current Bull Cycle is much more similar to the 1974 - 2000 one than the 1932 - 1965, which understandable as neither banking or trading was that evolved or matured as it got with the financial engineering of the 80s and beyond.
** Conclusion **
In any case and as we are concluding this publications, all the above projections based on this 'Cyclical blueprint' may be speculation theoretically but trends that keep repeating themselves over the decades are not. Technically those patterns filter out all news, fundamentals, geopolitical, macroeconomical noise and give rise to a pure behavioral perspective, the essence of traditional Economics.
So based on that model, are you also expecting to see 20000 in 8 years time?
-------------------------------------------------------------------------------
** Please LIKE 👍, FOLLOW ✅, SHARE 🙌 and COMMENT ✍ if you enjoy this idea! Also share your ideas and charts in the comments section below! This is best way to keep it relevant, support us, keep the content here free and allow the idea to reach as many people as possible. **
-------------------------------------------------------------------------------
💸💸💸💸💸💸
👇 👇 👇 👇 👇 👇

HANG SENG Patience until December for a long term buy.Hang Seng (HSI1!) made a massive bullish break-out in September as it broke above the February 2021 Lower Highs trend-line, effectively ending its Bear Cycle. This month (October) saw it getting rejected not just on the 1M MA200 (orange trend-line) but also on its 0.618 Fibonacci retracement level.
This is a key rejection as in almost 30 years, every time the price got rejected on the 0.618 Fib, it recovered on the 3rd (1M) candle after. As a result, December will give a buy signal based on this historic price action, so have patience and take a multi-month buy then.
In most of those cases, the index rebounded to the previous High, so our Target will be 30975. Notice also that the 1M MACD is rising off a Bullish Cross. When formed below the 0.0 mark, this has also been a massive buy signal.
-------------------------------------------------------------------------------
** Please LIKE 👍, FOLLOW ✅, SHARE 🙌 and COMMENT ✍ if you enjoy this idea! Also share your ideas and charts in the comments section below! This is best way to keep it relevant, support us, keep the content here free and allow the idea to reach as many people as possible. **
-------------------------------------------------------------------------------
💸💸💸💸💸💸
👇 👇 👇 👇 👇 👇

S&P500 Bottom expected this week.New bull phase to 6500 startingThe S&P500 index (SPX) has a red 1W candle last week, its first after 6 straight green. This was a much needed technical correction on a rally that has been holding since the August 05 low, while on the longer term it's part of a Channel Up that since last October (2023), hence a year ago, is being supported by the 1W MA50 (blue trend-line).
We've identified a similar pattern, essentially an identical price action that started after the March 2020 COVID bottom and extended all the way to the November 2021 peak. It appears that relative to that Channel Up pattern, we are about to complete this week step (e), which on May 17 2021, it priced the 2nd straight red week and then resumed the uptrend.
Technically, as long as the 1W MA50 holds, we remain inside a Bull Phase. The symmetry between the two fractals is striking, both have ascended by +43.46% up to step (e). If this symmetry continues all the way to the top, then that could be at a +62.37% rise from the Channel's bottom.
As a result, this gives us a 6500 Target (at least) by Q2 2025.
-------------------------------------------------------------------------------
** Please LIKE 👍, FOLLOW ✅, SHARE 🙌 and COMMENT ✍ if you enjoy this idea! Also share your ideas and charts in the comments section below! This is best way to keep it relevant, support us, keep the content here free and allow the idea to reach as many people as possible. **
-------------------------------------------------------------------------------
💸💸💸💸💸💸
👇 👇 👇 👇 👇 👇

NIKKEI is starting the new bullish phase.NIKKEI (NI225) gave us the most accurate buy entry we could get last time (September 10, see chart below) as we bought right above the 0.5 Fibonacci level and the price immediately rebounded to the 0.786 Fib of its July 11 High:
The symmetry with the September - December 2023 fractal continues to be striking, which is also evident on the 1D RSI which made a 2nd bounce on the Symmetrical Pivot Zone as the previous fractal did on December 08 2023.
The price bounced on the 1D MA50 (blue trend-line) and the December 2023 rally that followed, reached the 1.786 Fibonacci extension before the next short-term consolidation.
As a result, we can upgrade our medium-term Target to 43000, which is still considerably below the 1.786 Fib.
-------------------------------------------------------------------------------
** Please LIKE 👍, FOLLOW ✅, SHARE 🙌 and COMMENT ✍ if you enjoy this idea! Also share your ideas and charts in the comments section below! This is best way to keep it relevant, support us, keep the content here free and allow the idea to reach as many people as possible. **
-------------------------------------------------------------------------------
💸💸💸💸💸💸
👇 👇 👇 👇 👇 👇

DOW JONES Bottom is being formed. Buy for 44000 immediate TargetDow Jones (DJI) eventually made a bullish break-out on our last analysis (October 08, see chart below) and hit our 43200 invalidation Target:
The 3-month Channel Up is still holding and the price is now on the 4H MA200 (orange trend-line) and near the bottom (Higher Lows trend-line) of the pattern. The 4H RSI has completed a bottoming sequence similar to the September 11 Higher Low.
As long as the 1D MA50 (red trend-line) supports (closes 1D candles above), this will be a buy opportunity. Our Target is 44000, which is the 1.236 Fibonacci extension, similar with the previous Higher High.
-------------------------------------------------------------------------------
** Please LIKE 👍, FOLLOW ✅, SHARE 🙌 and COMMENT ✍ if you enjoy this idea! Also share your ideas and charts in the comments section below! This is best way to keep it relevant, support us, keep the content here free and allow the idea to reach as many people as possible. **
-------------------------------------------------------------------------------
💸💸💸💸💸💸
👇 👇 👇 👇 👇 👇

CHINA A50 Buy signal couldn't have gone any better!Last time we looked at the China A50 index (CN50) was almost 2 months ago (September 06, see chart below) when we called for a buy opportunity:
As you can see, it couldn't have gone any better as the price rebounded exactly on our mark, hitting our 12100 Target in a matter of days.
Now the index is on a relief consolidation following this enormous rally that broke above the nearly 4-year Channel Down. Every time we had a similar bullish break-out, the market reached at least its 2.0 Fibonacci extension level. As a result, we expect to see 19500 by mid 2025.
-------------------------------------------------------------------------------
** Please LIKE 👍, FOLLOW ✅, SHARE 🙌 and COMMENT ✍ if you enjoy this idea! Also share your ideas and charts in the comments section below! This is best way to keep it relevant, support us, keep the content here free and allow the idea to reach as many people as possible. **
-------------------------------------------------------------------------------
💸💸💸💸💸💸
👇 👇 👇 👇 👇 👇
