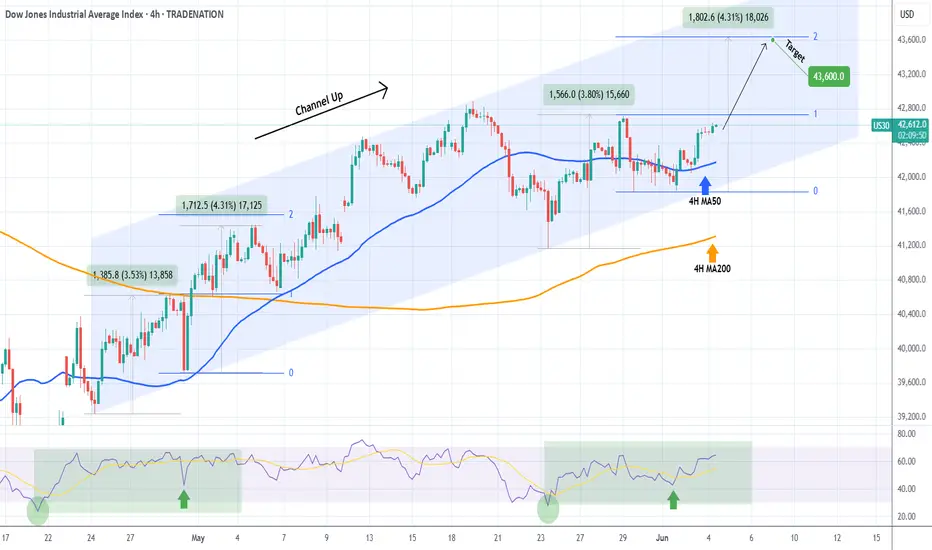
DOW JONES starting the new Bullish Leg.Dow Jones (DJI) is rallying off its 4H MA50 (blue trend-line), shortly after making a new Higher Low on its 6-week Channel Up. Technically that is the start of its new Bullish Leg.
With the 4H RSI being identical to the Bullish Leg at the start of the Channel Up, we expect it to again rise by +4.30% and touch the 2.0 Fibonacci extension. Target 43600.
-------------------------------------------------------------------------------
** Please LIKE 👍, FOLLOW ✅, SHARE 🙌 and COMMENT ✍ if you enjoy this idea! Also share your ideas and charts in the comments section below! This is best way to keep it relevant, support us, keep the content here free and allow the idea to reach as many people as possible. **
-------------------------------------------------------------------------------
Disclosure: I am part of Trade Nation's Influencer program and receive a monthly fee for using their TradingView charts in my analysis.
💸💸💸💸💸💸
👇 👇 👇 👇 👇 👇
Stockindexsignals
S&P500 Giant Inverse Head and Shoulders waiting for its breakoutThe S&P500 index (SPX) appears to be forming the Right Shoulder of a long-term Inverse Head and Shoulders (IH&S), the pattern that made the April 07 bottom of the Tariff War correction.
Currently supported by both its 1D MA50 (blue trend-line) and 1D MA200 (orange trend-line), once the overhead Resistance/ neckline breaks, we expect a +24.55% rise to the 2.0 Fibonacci extension, the equivalent of the rise it made from the April bottom up until now.
The target given is 7400.
-------------------------------------------------------------------------------
** Please LIKE 👍, FOLLOW ✅, SHARE 🙌 and COMMENT ✍ if you enjoy this idea! Also share your ideas and charts in the comments section below! This is best way to keep it relevant, support us, keep the content here free and allow the idea to reach as many people as possible. **
-------------------------------------------------------------------------------
Disclosure: I am part of Trade Nation's Influencer program and receive a monthly fee for using their TradingView charts in my analysis.
💸💸💸💸💸💸
👇 👇 👇 👇 👇 👇

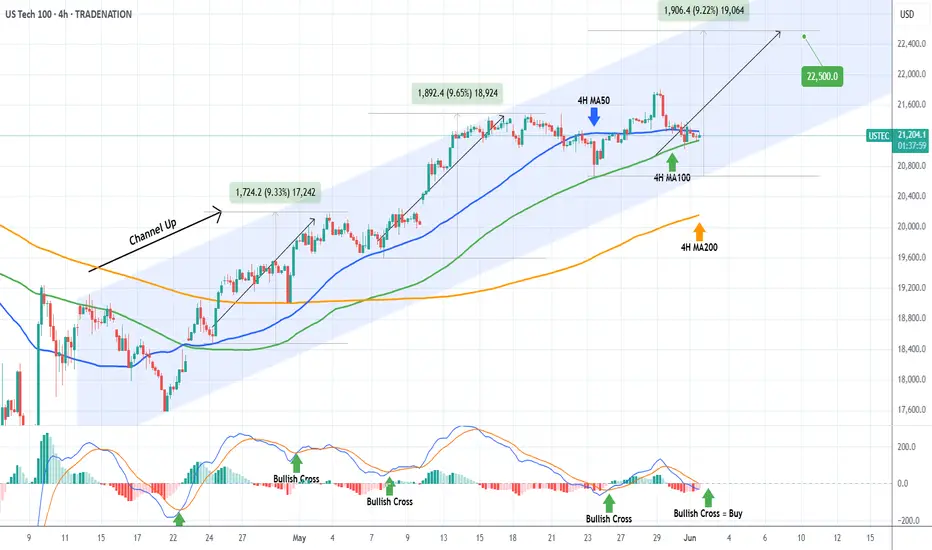
NASDAQ Will the 4H MA100 come to the rescue?Nasdaq (NDX) is trading within a 3-week Channel Up, which is currently supported by the 4H MA100 (green trend-line). In fact, the price is being squeezed in the last three 4H candles within the 4H MA100 and the 4H MA50 (blue trend-line).
This tight compression technically tends to cause violent break-outs either way. As long as the Channel Up holds, we expect that to be upwards and it should be confirmed by the formation of a 4H MACD Bullish Cross.
With the last two major rallies being around +9.50%, we expect to see 22500 on the next Leg Up.
-------------------------------------------------------------------------------
** Please LIKE 👍, FOLLOW ✅, SHARE 🙌 and COMMENT ✍ if you enjoy this idea! Also share your ideas and charts in the comments section below! This is best way to keep it relevant, support us, keep the content here free and allow the idea to reach as many people as possible. **
-------------------------------------------------------------------------------
Disclosure: I am part of Trade Nation's Influencer program and receive a monthly fee for using their TradingView charts in my analysis.
💸💸💸💸💸💸
👇 👇 👇 👇 👇 👇
DAX Channel Up targeting a 24800 Higher High.DAX (DE40) has been trading within a 1-month Channel Up and appears to be repeating the first Bullish Leg of the pattern.
More specifically, it rose by +5%, similar to April 30 - May 05 and yesterday's correction resembles May 06. With also identical 1H RSI formations (Lower Highs), we expect the uptrend to be extended in a similar structure and again target the 1.382 Fibonacci extension at 24800.
-------------------------------------------------------------------------------
** Please LIKE 👍, FOLLOW ✅, SHARE 🙌 and COMMENT ✍ if you enjoy this idea! Also share your ideas and charts in the comments section below! This is best way to keep it relevant, support us, keep the content here free and allow the idea to reach as many people as possible. **
-------------------------------------------------------------------------------
Disclosure: I am part of Trade Nation's Influencer program and receive a monthly fee for using their TradingView charts in my analysis.
💸💸💸💸💸💸
👇 👇 👇 👇 👇 👇

S&P500 6300 is the minimum short-term Target right now.The S&P500 index (SPX) is extending Friday's rebound on the 1D MA200 (orange trend-line) following an impressive rally after the April 07 bottom. That is technically the pattern's new Bullish Leg.
This quick consolidation technically resembles all 4 short-term pull-backs (blue circles) that took place since April 2023. The minimum % rise on those before they pulled back to the 1D MA50 (blue trend-line) again was +10%.
As a result, we expect 6300 to be the minimum Target by the end of July, which of course will be an All Time High.
-------------------------------------------------------------------------------
** Please LIKE 👍, FOLLOW ✅, SHARE 🙌 and COMMENT ✍ if you enjoy this idea! Also share your ideas and charts in the comments section below! This is best way to keep it relevant, support us, keep the content here free and allow the idea to reach as many people as possible. **
-------------------------------------------------------------------------------
Disclosure: I am part of Trade Nation's Influencer program and receive a monthly fee for using their TradingView charts in my analysis.
💸💸💸💸💸💸
👇 👇 👇 👇 👇 👇

DOW JONES Holding the 1D MA50 can propel it to 45000.Dow Jones (DJI) contained Friday's Trump-led pull-back just above its 1D MA50 (blue trend-line), marking the strongest correction since April 21. So far that is purely a technical reaction to the Resistance 1 (42855) rejection a day earlier.
This is forming an Inverse Head and Shoulders (IH&S) but above all, as long as the 1D MA50 holds, it is a bullish continuation of April's rebound/ Bullish Leg at the bottom of the long-term Bullish Megaphone pattern and on the 1W MA200 (red trend-line).
As you can see, the 1W MA200 has been the ultimate Support of this pattern and last time it started a rebound that broke above the 1D MA50 and retested it, was on the first Bullish on November 09 2023.
That pull-back held the 1D MA50 and the price action continued the bullish trend until it completed a +23.69% rise, before the next 1D MA50 break.
As a result, as long as the 1D MA50 holds, we expect at least another +23.69% rise on the medium-term, which this times falls on the Resistance 2 level (45100), aligning perfectly for a technical test. Our Target will be a little lower at 45000.
-------------------------------------------------------------------------------
** Please LIKE 👍, FOLLOW ✅, SHARE 🙌 and COMMENT ✍ if you enjoy this idea! Also share your ideas and charts in the comments section below! This is best way to keep it relevant, support us, keep the content here free and allow the idea to reach as many people as possible. **
-------------------------------------------------------------------------------
Disclosure: I am part of Trade Nation's Influencer program and receive a monthly fee for using their TradingView charts in my analysis.
💸💸💸💸💸💸
👇 👇 👇 👇 👇 👇

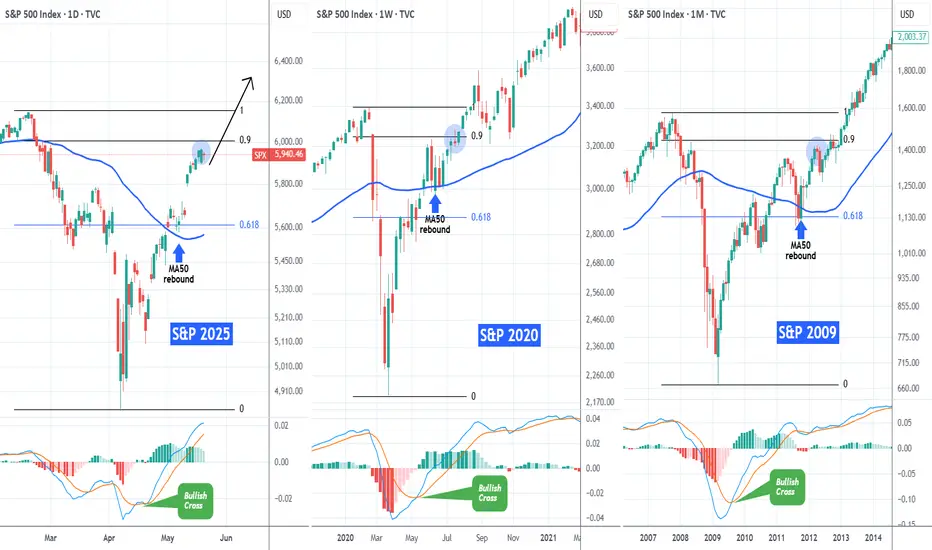
S&P500 Same recovery path with 2020 and 2009The S&P500 index (SPX) has recovered almost 90% of its losses since the February 19 2025 All Time High (ATH) and many have already started calling for a technical correction.
If we compare however this 2025 Tariff fueled correction with the recent most aggressive ones (COVID crash in 2020 and Housing Crisis 2008/2009) we see a different picture.
On their respective 0.9 Fibonacci levels (close to which we are today), both of those market recoveries went straight to new ATHs, without testing their MA50 (blue trend-line) until the next Cycle peak. They had that tested before when the price was trading near (or on)the 0.618 Fib. Notice also how a MACD Bullish on all three charts, confirmed the aggressive recovery pattern straight after the bottom.
Instead of a correction, history shows that we might be looking at new ATH soon.
-------------------------------------------------------------------------------
** Please LIKE 👍, FOLLOW ✅, SHARE 🙌 and COMMENT ✍ if you enjoy this idea! Also share your ideas and charts in the comments section below! This is best way to keep it relevant, support us, keep the content here free and allow the idea to reach as many people as possible. **
-------------------------------------------------------------------------------
💸💸💸💸💸💸
👇 👇 👇 👇 👇 👇
S&P500 Steady Channel Up to 6100The S&P500 index (SPX) has been trading within a Channel Up pattern from the moment (April 22) it broke above the 4H MA50 (blue trend-line). For that 1 month period, it has held the 4H MA50 and that maintains the bullish trend, generating Bullish Legs to High after High.
The last two Bullish Legs have increased by +4.92%, so as long as the 4H MA50 holds, we expect the current Leg to be completed at 6100.
-------------------------------------------------------------------------------
** Please LIKE 👍, FOLLOW ✅, SHARE 🙌 and COMMENT ✍ if you enjoy this idea! Also share your ideas and charts in the comments section below! This is best way to keep it relevant, support us, keep the content here free and allow the idea to reach as many people as possible. **
-------------------------------------------------------------------------------
Disclosure: I am part of Trade Nation's Influencer program and receive a monthly fee for using their TradingView charts in my analysis.
💸💸💸💸💸💸
👇 👇 👇 👇 👇 👇

NASDAQ Critical level for short-term.Nasdaq (NDX) is testing a strong short-term Support Cluster, the Lower Lows trend-line and the bottom of the 1H Channel Up. Being below the 1H MA50 (blue trend-line), the trend is right now neutral until one of the two levels breaks.
If the index breaks above the 1H MA50, we will turn bullish again, targeting 22200 (+5.70% from the current Low, the minimum % rise in the past month).
If it breaks below the Support Cluster, we will turn bearish, targeting the 1H MA200 (orange trend-line) at 20800.
-------------------------------------------------------------------------------
** Please LIKE 👍, FOLLOW ✅, SHARE 🙌 and COMMENT ✍ if you enjoy this idea! Also share your ideas and charts in the comments section below! This is best way to keep it relevant, support us, keep the content here free and allow the idea to reach as many people as possible. **
-------------------------------------------------------------------------------Disclosure: I am part of Trade Nation's Influencer program and receive a monthly fee for using their TradingView charts in my analysis.
💸💸💸💸💸💸
👇 👇 👇 👇 👇 👇

S&P500 Historic reversals like this delivered even +100% gains!The S&P500 (SPX) is making a remarkable bullish reversal and on the monthly (1M) chart is even more evident due to April's candle, which almost closed flat leaving a huge wick under it, a feat we've never seen in recent history.
What we have seen however since the 2008 Housing Crisis, is every time the index hits (or approaches) its 1M MA50 (blue trend-line), it reverses to an incredible rally, technically a new Bull Cycle.
This is what happened in April, the index came a breath away from the 1M MA50 and delivered the strongest monthly bullish reversal of our time. On top of that, it hit and rebounded exactly on the former All Time High Resistance, which held and turned into Support. All such Resistance levels since 2008 have held. Also note that the only time the 1M MA50 really broke (closed the month below it), was during the March 2020 COVID flash-crash, which is a non-technical event/ irregularity and still it rebounded on the 1M MA100 (green trend-line).
The minimum long-term rise that SPX had after such correction was +76.20% and the maximum +104.17%. Assuming the minimum price increase for the current emerging rise, we expect the index to hit 8300 by late 2027.
-------------------------------------------------------------------------------
** Please LIKE 👍, FOLLOW ✅, SHARE 🙌 and COMMENT ✍ if you enjoy this idea! Also share your ideas and charts in the comments section below! This is best way to keep it relevant, support us, keep the content here free and allow the idea to reach as many people as possible. **
-------------------------------------------------------------------------------
💸💸💸💸💸💸
👇 👇 👇 👇 👇 👇

DOW JONES History shows that we're now targeting 68000.Dow Jones (DJI) recovered its 1W MA50 (blue trend-line), sending a clear technical message that the 'Trade War' correction is over and the long-term bullish trend has been resumed.
The bottom of that correction was on the 1W MA200 (orange trend-line), which has been the absolute long-term Support trend-line for the index, having broken by a large extent only during the March 2020 COVID crash.
That was also a bottom for Dow's Bullish Megaphone pattern. The last time that the index handed a 1W MA200 bottom while trading within a Bullish Megaphone was on February 08 2016. On both bottoms, the 1W RSI hit the 30.00 oversold barrier.
In 2016 that bottom rebound initiated a (blue) Channel Up that lasted for almost 2 years and peaked on the 3.0 Fibonacci extension level. If Dow continues to replicate that pattern, we are looking at a 68000 Target (Fib 3.0 ext) by mid-2027.
-------------------------------------------------------------------------------
** Please LIKE 👍, FOLLOW ✅, SHARE 🙌 and COMMENT ✍ if you enjoy this idea! Also share your ideas and charts in the comments section below! This is best way to keep it relevant, support us, keep the content here free and allow the idea to reach as many people as possible. **
-------------------------------------------------------------------------------
💸💸💸💸💸💸
👇 👇 👇 👇 👇 👇

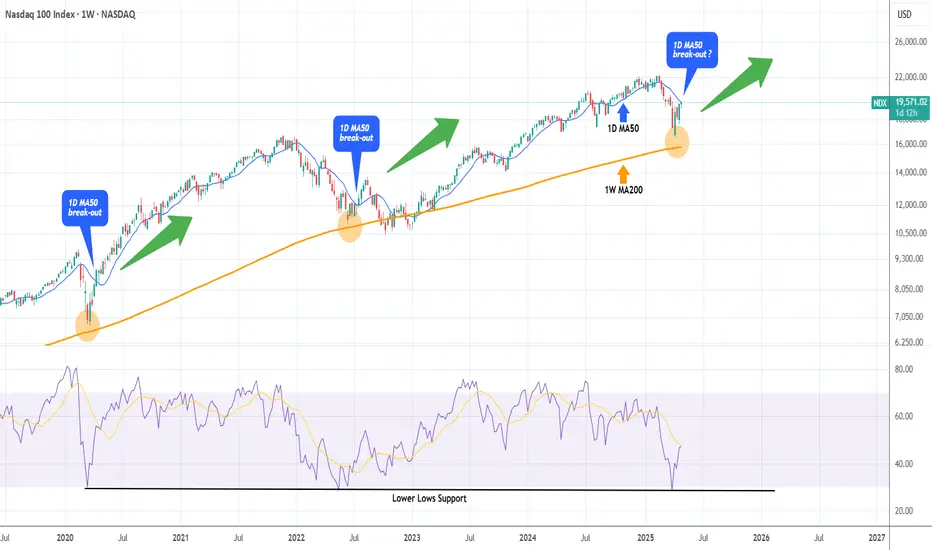
NASDAQ broke above its 1D MA200 after 2 months! Target 22000.Nasdaq (NDX) broke today above its 1D MA200 (orange trend-line) for the first time in more than 2 months (since March 06), following the U.S. - Chine trade deal. This trend-line also had the March 26 rejection under its belt, which initiated the most aggressive part of the 'Trade War' correction.
The last time the index broke above its 1D MA200 on a similar pattern was when it was recovering after the bottom of the 2022 Inflation Crisis. The February 01 2023 break-out produced an instant rise to the 1.382 Fibonacci extension before a short-term correction to re-test the 1D MA200.
As a result, we expect 22000 (1.382 Fib ext) to come as early as this week before any discussions can be made for a new pull-back.
-------------------------------------------------------------------------------
** Please LIKE 👍, FOLLOW ✅, SHARE 🙌 and COMMENT ✍ if you enjoy this idea! Also share your ideas and charts in the comments section below! This is best way to keep it relevant, support us, keep the content here free and allow the idea to reach as many people as possible. **
-------------------------------------------------------------------------------
Disclosure: I am part of Trade Nation's Influencer program and receive a monthly fee for using their TradingView charts in my analysis.
💸💸💸💸💸💸
👇 👇 👇 👇 👇 👇

RUSSELL 15-year Cyclical pattern calls for enormous growth.Russell 2000 (RUT) made a massive rebound on last month's candle on the 1M MA100 (green trend-line), closing above it and maintaining the long-term price action above this Support since the March 2020 COVID crash.
Practically that was the only time the 1M MA100 broke since the October 11 recovery, which was the start of a 15-year Cyclical Pattern that initiates Bull Cycles after 1M MA50 (blue trend-line) ad then 1M MA100 rebounds that peak on the 2.0 Fibonacci extension.
Last month's rebound sets the stage for a post-COVID type recovery, especially if the Fed cuts the Interest Rates on their next meeting. The 2.0 Fibonacci extension is a little bit over 3500, which is our long-term Target.
-------------------------------------------------------------------------------
** Please LIKE 👍, FOLLOW ✅, SHARE 🙌 and COMMENT ✍ if you enjoy this idea! Also share your ideas and charts in the comments section below! This is best way to keep it relevant, support us, keep the content here free and allow the idea to reach as many people as possible. **
-------------------------------------------------------------------------------
💸💸💸💸💸💸
👇 👇 👇 👇 👇 👇

DOW JONES Can this Channel Up hold after the Fed Rate Decision?Dow Jones (DJIA) has been trading within a Channel Up since the April 24 Low and yesterday's correction (technically its Bearish Leg) stopped on the 4H MA50 (blue trend-line). Having formed already a Golden Cross, as long as this 4H MA50 holds, it should technically fuel the pattern's new Bullish Leg.
The 'weakest' Bullish Leg within this Channel Up has been +3.58%, so we expect a minimum repeat of that, giving a Target at 42100 on the short-term. This falls perfectly at the bottom of the 5 week Resistance Zone.
If this Channel Up doesn't get invalidated after today's Fed Rate Decision, it will most likely push the price there.
-------------------------------------------------------------------------------
** Please LIKE 👍, FOLLOW ✅, SHARE 🙌 and COMMENT ✍ if you enjoy this idea! Also share your ideas and charts in the comments section below! This is best way to keep it relevant, support us, keep the content here free and allow the idea to reach as many people as possible. **
-------------------------------------------------------------------------------
💸💸💸💸💸💸
👇 👇 👇 👇 👇 👇

S&P500 Stuck between the 1D MA50 and 1D MA200.The S&P500 index (SPX) is now on a short-term correction following the impressive recovery of the last 30 days that made it almost test its 1D MA200 (orange trend-line). This is a technical rejection but the fact that the 1D MA50 (blue trend-line) is now the Support can be encouraging.
The reason is that since January 2023, every time the index broke above its 1D MA50 it turned into a Support that held and produced an immediate bullish extension on every occasion except for one time (Sep 2024), which still recovered 1 week after.
As a result, it is more likely for SPX to test its All Time High (ATH) by July than entering a long-term correction again.
-------------------------------------------------------------------------------
** Please LIKE 👍, FOLLOW ✅, SHARE 🙌 and COMMENT ✍ if you enjoy this idea! Also share your ideas and charts in the comments section below! This is best way to keep it relevant, support us, keep the content here free and allow the idea to reach as many people as possible. **
-------------------------------------------------------------------------------
Disclosure: I am part of Trade Nation's Influencer program and receive a monthly fee for using their TradingView charts in my analysis.
💸💸💸💸💸💸
👇 👇 👇 👇 👇 👇

NASDAQ's Inverse H&S that targets $25000Nasdaq (NDX) is forming the Right Shoulder of a potential Inverse Head and Shoulders (IH&S) pattern. The price action is 'stuck' within the 1D MA200 (orange trend-line), which got tested on Friday for the first time since March, and the 1D MA50 (blue trend-line).
Since the 1D MA200 was the level that initiated the March 26 rejection, it is possible to see a short-term pull-back now, all in the process of forming the Right Shoulder and after the market digests the new Fed Rate Decision, starts the next Leg Up. Note that the 1D RSI is already on its February highs.
As a result, our long-term Target is at 25000, just below the 2.0 Fibonacci extension level, which is a standard technical target for IH&S patterns.
-------------------------------------------------------------------------------
** Please LIKE 👍, FOLLOW ✅, SHARE 🙌 and COMMENT ✍ if you enjoy this idea! Also share your ideas and charts in the comments section below! This is best way to keep it relevant, support us, keep the content here free and allow the idea to reach as many people as possible. **
-------------------------------------------------------------------------------
Disclosure: I am part of Trade Nation's Influencer program and receive a monthly fee for using their TradingView charts in my analysis.
💸💸💸💸💸💸
👇 👇 👇 👇 👇 👇

S&P500 1st 4H Golden Cross since Jan could be a TRAP!S&P500 (SPX) completed yearly today its first Golden Cross on the 4H time-frame since January 23. That formation issued an immediate pull-back but technically it's not very similar to the today's as that was formed after an All Time High (ATH) while now we are on the recovery phase after March's massive Trade War fueled correction.
The 4H Golden Cross however that looks more similar to the current is the one before January's, the August 21 2024. That was formed after a substantial market pull-back, though again not as strong as March's. Still, the 1D RSI patterns are also more similar and that again should keep us on high alert as 2 weeks later the index pulled back to the 0.5 Fibonacci retracement level from its previous High Resistance.
As a result, if we see the price now turning sideways for a week or so, we will give higher probabilities for a short-term pull-back, maybe not as low as the 0.5 Fib but at least to the 5450 region, before the market takes off to 6000.
-------------------------------------------------------------------------------
** Please LIKE 👍, FOLLOW ✅, SHARE 🙌 and COMMENT ✍ if you enjoy this idea! Also share your ideas and charts in the comments section below! This is best way to keep it relevant, support us, keep the content here free and allow the idea to reach as many people as possible. **
-------------------------------------------------------------------------------
Disclosure: I am part of Trade Nation's Influencer program and receive a monthly fee for using their TradingView charts in my analysis.
💸💸💸💸💸💸
👇 👇 👇 👇 👇 👇

NASDAQ testing its 1D MA50. Break-out or Fake-out?Nasdaq (NDX) has reached its 1D MA50 (blue trend-line) for the first time since February 24. Following the (near) rebound on the 1W MA200 (orange trend-line), this looks like a textbook recovery from a correction to a new long-term Bullish Leg.
Chronologically the last such correction was the March 2020 COVID flash crash, which after it almost touched the 1W MA200, it recovered as fast as the current rebound and when it broke above its 1D MA50, it turned it into the Support of the new long-term Bullish Leg.
What wasn't a break-out but a fake-out was the rebound after the June 13 2022 (near) 1W MA200 rebound, when the break above the 1D MA50 was false as it produced a new rejection and sell-off later on. The difference is that 2022 was a technical Bear Cycle both in terms of length and strength.
Whatever the case, Nasdaq has seen the lowest 1W RSI (oversold) reading among those 3 bottoms. So do you think today's 1D MA50 test is a break-out or fake-out?
-------------------------------------------------------------------------------
** Please LIKE 👍, FOLLOW ✅, SHARE 🙌 and COMMENT ✍ if you enjoy this idea! Also share your ideas and charts in the comments section below! This is best way to keep it relevant, support us, keep the content here free and allow the idea to reach as many people as possible. **
-------------------------------------------------------------------------------
💸💸💸💸💸💸
👇 👇 👇 👇 👇 👇
S&P500 repeating the 2019 recovery-Can hit 7000.The S&P500 index (SPX) is making a remarkable recovery as it completed yet another strong 1W green candle last week following the rebound on its Higher Lows Zone, near the 1W MA200 (orange trend-line).
This is a mirror price action with the last 1W MA200 rebound of the 2016 - 2019 Bullish Megaphone pattern, which not only recovered its previous All Time High (ATH) but also peaked on the 1.618 Fibonacci extension before the eventual 2020 COVID crash.
As a result, we believe that a 7000 Target is a very plausible one on the long-term.
-------------------------------------------------------------------------------
** Please LIKE 👍, FOLLOW ✅, SHARE 🙌 and COMMENT ✍ if you enjoy this idea! Also share your ideas and charts in the comments section below! This is best way to keep it relevant, support us, keep the content here free and allow the idea to reach as many people as possible. **
-------------------------------------------------------------------------------
Disclosure: I am part of Trade Nation's Influencer program and receive a monthly fee for using their TradingView charts in my analysis.
💸💸💸💸💸💸
👇 👇 👇 👇 👇 👇

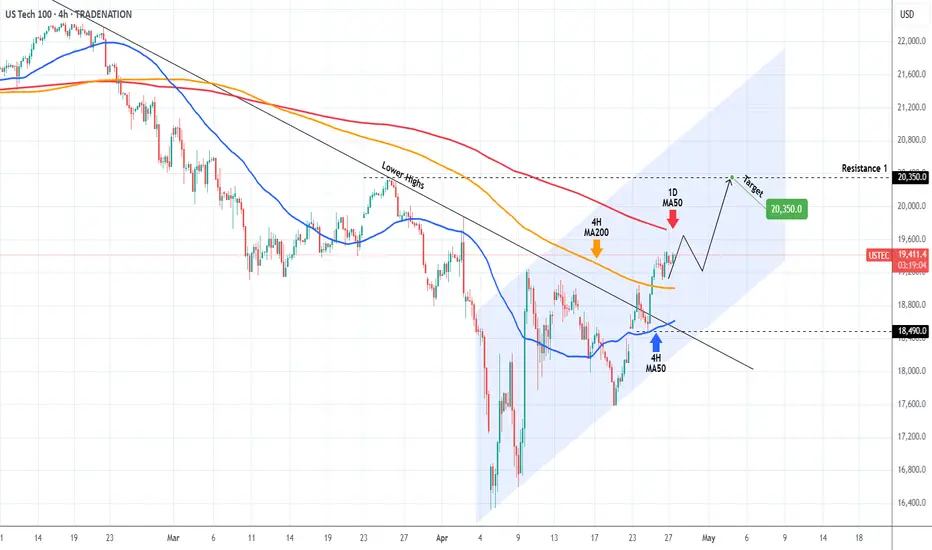
NASDAQ ahead of the most critical Resistance test.Nasdaq (NDX) not only broke above the Lower Highs trend-line of its All Time High (ATH) last week but managed to break and turn the 4H MA200 (orange trend-line) into Support.
It is now aiming for the 1D MA50 (red trend-line), which is the most crucial Resistance level of this recovery attempt and is what technically turns bearish trends into bullish if it turns into Support.
We expect a short-term rejection there, which should give a buy opportunity near the 4H MA200. Our Target for this is 20350 (Resistance 1).
-------------------------------------------------------------------------------
** Please LIKE 👍, FOLLOW ✅, SHARE 🙌 and COMMENT ✍ if you enjoy this idea! Also share your ideas and charts in the comments section below! This is best way to keep it relevant, support us, keep the content here free and allow the idea to reach as many people as possible. **
-------------------------------------------------------------------------------
Disclosure: I am part of Trade Nation's Influencer program and receive a monthly fee for using their TradingView charts in my analysis.
💸💸💸💸💸💸
👇 👇 👇 👇 👇 👇
DOW JONES New long-term bottom being formed on the 1W MA200.Dow Jones (DJI) hasn't yet broken above its 1D MA50 (blue trend-line) following the April 07 Low, but is nonetheless consolidating and holding the 1W MA200 (red trend-line), which hasn't broken as Support since October 17 2022.
That was a few days after the bottom of the 2022 Inflation Crisis was formed and the current Channel Up started. In fact, the rallies that started on both Channel Up bottoms since, have been almost identical in range (+22.60% and +23.80% respectively) so technically we should be expecting at least 44800 (+22.60% from April's Low) on the medium-term.
-------------------------------------------------------------------------------
** Please LIKE 👍, FOLLOW ✅, SHARE 🙌 and COMMENT ✍ if you enjoy this idea! Also share your ideas and charts in the comments section below! This is best way to keep it relevant, support us, keep the content here free and allow the idea to reach as many people as possible. **
-------------------------------------------------------------------------------
Disclosure: I am part of Trade Nation's Influencer program and receive a monthly fee for using their TradingView charts in my analysis.
💸💸💸💸💸💸
👇 👇 👇 👇 👇 👇

S&P500 Long and painful but necessary bottom formation.The S&P500 index (SPX) has been trading within a 2-year Bullish Megaphone pattern and the recent 2-month correction completed its latest Bearish Leg, as it reached the Higher Lows trend-line.
The massive rebound that took place there on April 07 may have turned out to be a highly volatile one but as mentioned on the title, it might be long and painful, but a necessary process nonetheless. That's mainly because it is the strongest correction since 2022 and the longest Bearish Leg of the pattern.
The market remains highly volatile until it gets a clear signal, bearish below the current Support of the 1W MA200 (red trend-line) or bullish above the 1D MA50 (blue trend-line). Despite the rather short-term uncertainty, the similarities with the Megaphone's previous bottom are uncanny, both having formed their Low on 1D RSI Double Bottom patterns.
Given that this previous Low initiated a massive +50% 1 year Bullish Leg/ rally, we expect to see at least 7100 on this next one by mid-2026.
-------------------------------------------------------------------------------
** Please LIKE 👍, FOLLOW ✅, SHARE 🙌 and COMMENT ✍ if you enjoy this idea! Also share your ideas and charts in the comments section below! This is best way to keep it relevant, support us, keep the content here free and allow the idea to reach as many people as possible. **
-------------------------------------------------------------------------------
Disclosure: I am part of Trade Nation's Influencer program and receive a monthly fee for using their TradingView charts in my analysis.
💸💸💸💸💸💸
👇 👇 👇 👇 👇 👇

NASDAQ Decision making becomes easy after seeing this chart.NASDAQ (NDX) is currently on the 3rd straight red month (1M candle), following the February High and subsequent sell-off due to the Trade War. This has been analyzed extensively in previous analyses and how the fundamental scene is only now starting to show some positive progress but still has a long way to go.
Technically though, the picture is very clear and favors long-term investing. The market has been trading within a Fibonacci Channel Up since the U.S. Housing Crisis in 2008 and along with the 2022 Inflation Crisis, those have been the only real Bear Cycle events in the past 18 years.
In between those there have been another 5 shorter term corrections, that offered great buying opportunities for the long-term and the recent 3-month one classifies as one.
There reasons are three. First it has come very close to the 1M MA50 (blue trend-line), which only broke during the Major Corrections. Second, the 1M RSI hit the 50.50 Symmetrical Support, which has held during all those 5 prior Minor Corrections. Third, those corrections only range between two Fibonacci levels.
The current correction fulfills all those conditions. And since the 'weakest' rally we've have on this 5 event sample has been +37.57% and the strongest +96.77%, we have a medium-term Target on Nasdaq at 22800 and a long-term one at 32500.
Do you still reserve doubts at investing long-term after seeing this macro chart?
-------------------------------------------------------------------------------
** Please LIKE 👍, FOLLOW ✅, SHARE 🙌 and COMMENT ✍ if you enjoy this idea! Also share your ideas and charts in the comments section below! This is best way to keep it relevant, support us, keep the content here free and allow the idea to reach as many people as possible. **
-------------------------------------------------------------------------------
💸💸💸💸💸💸
👇 👇 👇 👇 👇 👇
