NASDAQ Can this selling be sustainable?Last week (February 08, see chart below), we gave a sell signal on Nasdaq (NDX) as the the price wasn't just at the top of the short-term (dashed) Channel Up, but was also approaching the top (Higher Highs trend-line) of the 1-year Channel Up:
As the index suffered strong intra-day selling yesterday, following the higher than expected U.S. CPI report (investors initially view this as an excuse for the Fed not to cut rates quickly), it is a good time to update our outlook. In this effort, we will look at it through the shorter term 4H time-frame this time.
As you can see, the price breached yesterday not only the 4H MA50 (blue trend-line) but also the 4H MA100 (green trend-line), which was the first time (for the latter) since January 17, so almost 1 month. This is the first significant bearish signal for the medium-term but the confirmation will come only if a 1D candle closes below it. In that case, we expect the decline to reach first the 4H MA200 (orange trend-line) - 1D MA50 (red trend-line) Support cluster and then after a rebound gets confirmation with a rejection on the 4H MA50 (blue trend-line), target 16550, which is Support 2 and a potential 1D MA100 (yellow trend-line) contact. In that scenario, look also for the 1D RSI breaking below its Support Zone.
On the other hand, since the index is rebounding today and is already on the 4H MA50, we will wait for the daily candle closing. If it is above it (as in the cases of the February 01 and January 09 break-outs), it will most likely suggest that the bullish trend is intact. In that case, we will buy the break-out and target 18400, just below the 1.786 Fibonacci extension, which was the Target of both previous Higher Highs.
-------------------------------------------------------------------------------
** Please LIKE 👍, FOLLOW ✅, SHARE 🙌 and COMMENT ✍ if you enjoy this idea! Also share your ideas and charts in the comments section below! This is best way to keep it relevant, support us, keep the content here free and allow the idea to reach as many people as possible. **
-------------------------------------------------------------------------------
💸💸💸💸💸💸
👇 👇 👇 👇 👇 👇
Stockindexsignals

S&P500 +10year cheatsheet tells you what to do next!On this analysis we look into the S&P500 index (SPX) from a very long-term angle, the 1W time-frame going back more than 13 years, since November 2010. That was when the first Megaphone pattern emerged since the 2009 market bottom of the U.S. Housing (sub-prime) crisis that after testing the 1W MA200 (orange trend-line) it found Support and transitioned into a Channel Up.
This is a similar pattern that we are at since the previous 2021 market All Time High (ATH) that led to the 2022 Inflation Bear Cycle. In fact since 2009 there have been (including 2022) 4 such cyclical patterns in total and another common characteristic has been that the 1W MA50 (blue trend-line) has been the Support throughout the uptrend. In our recent pattern, that was tested in October 2023, held, and gave rise to the enormous November - February rally.
That turned the 1W RSI overbought above 70.00 for the first time since July 24 2023, which caused the 3-month pull-back. In fact, when the 1W RSI broke that high into overbought territory during the previous 3 Cycles, SPX at best consolidated if not pull-back for 4-6 weeks.
In any case, this +10 year 'Cheatsheet' is telling you that as long as the 1W MA50 holds (which is considerably lower), the next 4 weeks at least are a buy opportunity, at least once the index hits the 1D MA50 again. And of course the upside, in a year of expected rate cuts and U.S. Presidential elections, is significant not just purely from a technical point of view.
-------------------------------------------------------------------------------
** Please LIKE 👍, FOLLOW ✅, SHARE 🙌 and COMMENT ✍ if you enjoy this idea! Also share your ideas and charts in the comments section below! This is best way to keep it relevant, support us, keep the content here free and allow the idea to reach as many people as possible. **
-------------------------------------------------------------------------------
💸💸💸💸💸💸
👇 👇 👇 👇 👇 👇

DOW JONES Channel Up with the 4H as the key level.Dow Jones (DJI) is trading within a Channel Up pattern on the 4H time-frame with the 4H MA50 (blue trend-line) supporting since the January 19 break-out, being right on its bottom (Higher Lows trend-line). As long as the price action is closing candles above it, we remain bullish, targeting a Higher High at 39100.
If it closes a 4H candle below the 4H MA50, we will take the loss and sell instead, targeting the 1D MA50 (red trend-line) at 37800. Note that the last medium-term Support has been the 1D MA200 (orange trend-line) on January 18 and being overbought for too long on the 1D time-frame while the 4H RSI is on a Bearish Divergence throughout the index' whole Channel Up, a short-term correction to the 1D MA50, would technically be quite likely here.
-------------------------------------------------------------------------------
** Please LIKE 👍, FOLLOW ✅, SHARE 🙌 and COMMENT ✍ if you enjoy this idea! Also share your ideas and charts in the comments section below! This is best way to keep it relevant, support us, keep the content here free and allow the idea to reach as many people as possible. **
-------------------------------------------------------------------------------
💸💸💸💸💸💸
👇 👇 👇 👇 👇 👇

DAX Will it drop at the top of the 1-year Channel Up?DAX (FDAX1!) is currently trading at the top (Higher Highs trend-line) of the Channel Up pattern that started on the December 20 2022 Low. This is a more than 1-year trading structure and as long as its stays intact, we should see a rejection below the 1D MA50 (blue trend-line) and towards the 1D MA200 (orange trend-line).
Based on the previous declines within the pattern, there are high probabilities of seeing a minimum of -6.50% pull-back. That gives us a Sell Target at 16000. The absolute bottom on the long-term based on the 2023 price action is the 1W MA100 (yellow trend-line), which formed the market Lows of March 20 2023 and October 27 2023.
If the index closes a 1D candle above the top (Higher Highs trend-line) of the Channel Up, then we will drop the sell and buy the break-out instead, targeting 17600, which would complete a +20.90% rise from the October Low, symmetrical to the rise on the December 20 2022 Low.
-------------------------------------------------------------------------------
** Please LIKE 👍, FOLLOW ✅, SHARE 🙌 and COMMENT ✍ if you enjoy this idea! Also share your ideas and charts in the comments section below! This is best way to keep it relevant, support us, keep the content here free and allow the idea to reach as many people as possible. **
-------------------------------------------------------------------------------
💸💸💸💸💸💸
👇 👇 👇 👇 👇 👇

NASDAQ is very close to the top of the 1-year Channel Up! Sell?Nasdaq (NDX) is extending its aggressive rise of the Bullish Leg that started on the October 26 2023 Higher Low of the 1-year Channel Up and by the strength of it, it appears it will extend it to the max. That potential max extension is in the range of 18100 - 18300, which is the top of the dashed Channel Up and the top of the dotted 1-year Channel Up, which was initiated on the market Low of January 06 2023.
A news/ fundamentals based approach could time the bearish reversal after next Tuesday's U.S. CPI report. Technically though, the 1D RSI being on Lower Highs ever since December 19 2023, shows that technically we are already on a strong Bearish Divergence that can reverse any moment. The similarities with the previous Channel Up Higher High on July 18 2023 are striking, with the only exception that the current dashed Channel Up is overextending the 2nd peak.
Regardless of that, the 1D RSI is coming out a similar Megaphone and appears to be on a similar Lower High as July 31 2023. A similar RSI pull-back can be seen from February 02 to March 10 2023, which resulted into a -9.35% decline for Nasdaq. The August 18 2023 decline was translated into a -8.55% decline. As a result, assuming that 18100 is a potential peak for the index, we are targeting a minimum -8.55% decline, which falls directly on Support 2 at 16550. That would break the 1D MA50 (blue trend-line) and make contact with the 1D MA100 (green trend-line).
-------------------------------------------------------------------------------
** Please LIKE 👍, FOLLOW ✅, SHARE 🙌 and COMMENT ✍ if you enjoy this idea! Also share your ideas and charts in the comments section below! This is best way to keep it relevant, support us, keep the content here free and allow the idea to reach as many people as possible. **
-------------------------------------------------------------------------------
💸💸💸💸💸💸
👇 👇 👇 👇 👇 👇

S&P500 Bearish Divergence on 1D RSI points to a correction.The S&P500 index (SPX) has reached the top of the long-term Channel Up pattern that started on the October 13 2022 market bottom. This development is a strong sell signal on its own but it gets even stronger as the 1D RSI has been within a Channel Down since December 19, while the price was rising within a Channel Up, which is a technical Bearish Divergence.
The very same Bearish Divergence that led to the July 27 2023 Higher High and was followed by a 3-month almost -11.00% correction. The first wave of that correction was -5.84% and has been the minimum correction range in 2023, settling just above the 0.382 Fibonacci retracement level. As a result that minimum will be our target and its at 4700, as we may see a bullish reaction going closer to the mid-March Fed Rate Decision (in expectations of rate cuts).
Technically though, we can see a longer correctional wave to -9.26% (like the Bearish Leg that bottomed on March 13 2023) that could test the 1D MA200 (orange trend-line), or even almost -11.00% (like the one that bottomed on October 27 2023). Notice how each of those potential correction targets are conveniently placed around key Support or Fibonacci retracement levels.
-------------------------------------------------------------------------------
** Please LIKE 👍, FOLLOW ✅, SHARE 🙌 and COMMENT ✍ if you enjoy this idea! Also share your ideas and charts in the comments section below! This is best way to keep it relevant, support us, keep the content here free and allow the idea to reach as many people as possible. **
-------------------------------------------------------------------------------
💸💸💸💸💸💸
👇 👇 👇 👇 👇 👇

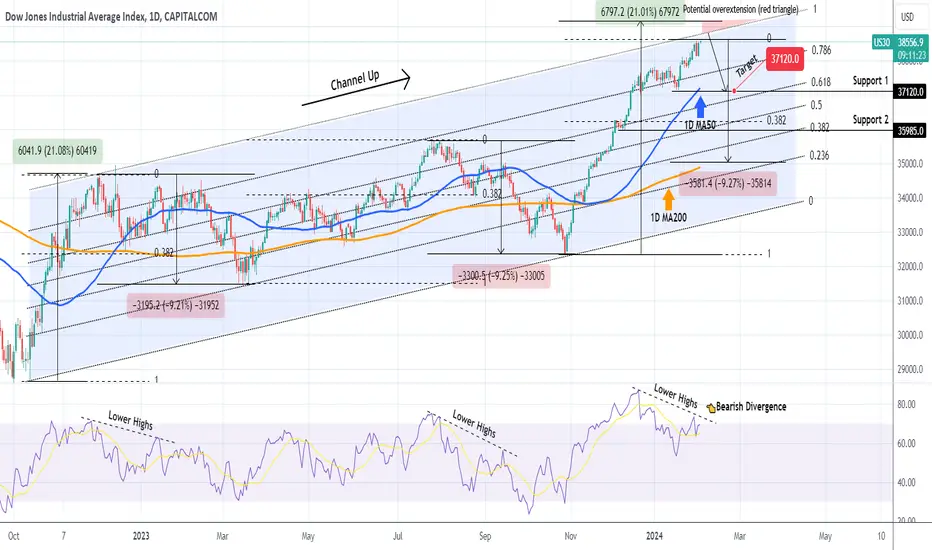
DOW JONES at the top of the 18month Channel Up. Medium-term SellDow Jones has been trading within a 18-month Channel Up pattern since the October 13 2022 global market bottom. The current price action is approaching its top (Higher Highs trend-line) for the first time in more than 1 year (since December 13 2022). With the 1D RSI on Lower Highs, which is a Bearish Divergence against the Higher Highs of the price action, the current levels are a strong candidate for a medium-term pull-back.
Even though we are past the transition year of 2023, which got the index out of the 2022 Bear Cycle and into the new Bull Cycle, thus we do not necessarily need a strong correction like those of August - October 2023 and December 2022 - March 2023, a smaller technical pull-back would be natural to normalize the overbought technical indicators and extend the long-term bullish trend.
As a result, we are targeting at least 37120, which is Support 1 and just above the 0.618 Fibonacci Channel level, the first target of the December 19 2022 pull-back and a typical % correction similar to August 24 and May 25 2023.
Not that the 1D RSI was under a Lower Highs trend-line both during the August 2023 and December 2022 corrections. Interestingly enough, both corrected by -9.20%, so technically we can see a correction as low as the 1D MA200 (orange trend-line) and the 0.236 Fibonacci Channel level at 35000 (even though it is less likely unless very negative fundamentals hit the market). Also it is worth pointing out that there is a technical maximum extension above the Channel Up, which is the red Triangle, in case the current Bullish Leg of the pattern goes for a +21% rise, like the December 01 2022 did.
-------------------------------------------------------------------------------
** Please LIKE 👍, FOLLOW ✅, SHARE 🙌 and COMMENT ✍ if you enjoy this idea! Also share your ideas and charts in the comments section below! This is best way to keep it relevant, support us, keep the content here free and allow the idea to reach as many people as possible. **
-------------------------------------------------------------------------------
💸💸💸💸💸💸
👇 👇 👇 👇 👇 👇
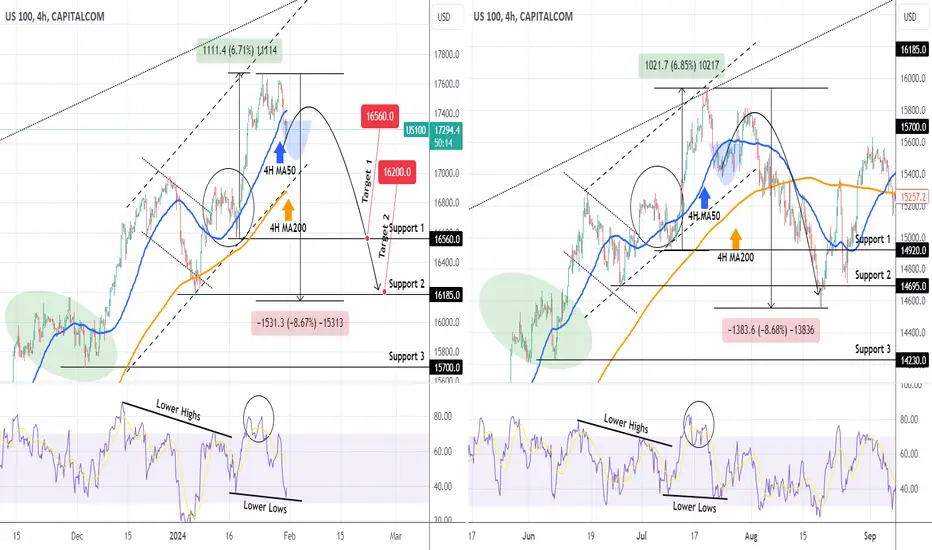
NASDAQ pulling back on high correlation with the July 2023 Top.Nasdaq (NDX) appears to be forming a Top approximately at the levels we described on our most recent idea (January 23, see chart below):
Today we move to the 4H time-frame where we can discuss the shorter term parameters of this expected pull-back. As you can see right away, the July 2023 peak (and the price action that led to it) is very similar to today's attempted technical peak formation. Both sequences started with an Accumulation Phase (green ellipse), rose and then had a 10-day correction and after a short re-accumulation (circle), they peaked on approximately a +6.80% rise. During all this time, they have been trading within a (dashed) Channel Up pattern.
In addition, the 4H RSI sequences between the two periods are virtually identical and we are now on the Lower Lows formation, where the actual index is below the 4H MA50 (blue trend-line), following the overbought 4H RSI peak. If the price continues to replicate the late July - early August 2023 sequence, then expect a Lower High and then sharp short-term correction below the 4H MA200 (orange trend-line). Target 1 is on Support 1 at 16560 and if we get a 1D candle closing below it, we will re-sell with Target 2 on Support 2 at 16200. That will be roughly a -8.67% decline from the top, similar to the August 18 2023 Low.
-------------------------------------------------------------------------------
** Please LIKE 👍, FOLLOW ✅, SHARE 🙌 and COMMENT ✍ if you enjoy this idea! Also share your ideas and charts in the comments section below! This is best way to keep it relevant, support us, keep the content here free and allow the idea to reach as many people as possible. **
-------------------------------------------------------------------------------
💸💸💸💸💸💸
👇 👇 👇 👇 👇 👇
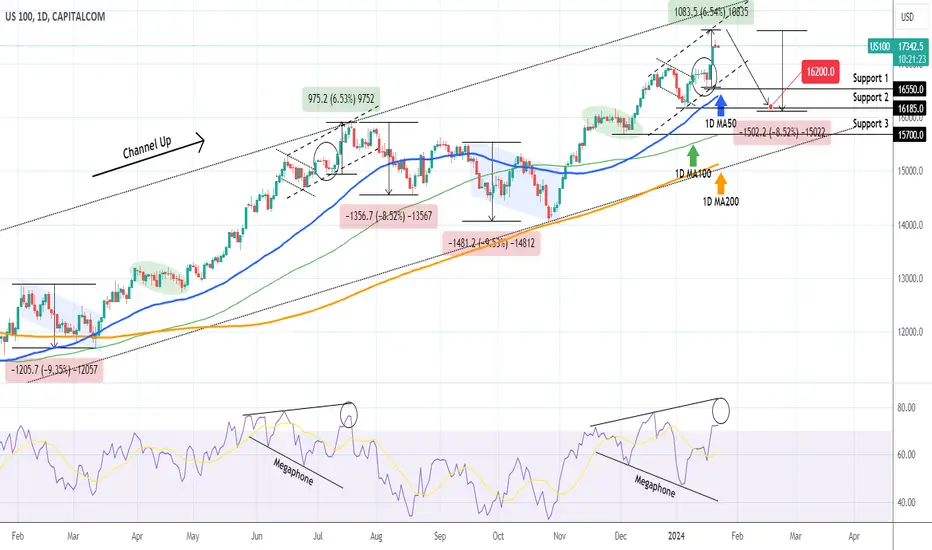
NASDAQ Extremely close to a peak and a correction.Nasdaq (NDX) closed yesterday on a red 1D candle, with the 1D RSI above the 70.00 overbought barrier, but remains within the (dashed) Channel Up, as well as supported by the 1D MA50 (blue trend-line) since November 03 2023.
Based on the 1D RSI which is within a Megaphone pattern, we might be approaching a peak similar to July 19 2023, whose RSI was also inside a Megaphone on almost the same levels as now. Following the peak, the price declined initially by -8.50%. Since the start of the year the other two major declines have been around -9.50%.
This suggests that if the index reverses around next week (Fed Rate Decision), we are technically aiming for 16200, which will put to a test Support 2 and the 1D MA100 (green trend-line), which made the bottom on the first -9.50% decline of last year on March 13.
The confirmation signal for atleast a short-term sell, can be when the index breaks the 1D MA50. Also, currently, the downside potential can be as low as the 1D MA200 (orange trend-line), which by its current course can make contact with the price around Support 3 (15700). The 1D MA200 has been untouched for more than 10 months (since March 13 2023).
-------------------------------------------------------------------------------
** Please LIKE 👍, FOLLOW ✅, SHARE 🙌 and COMMENT ✍ if you enjoy this idea! Also share your ideas and charts in the comments section below! This is best way to keep it relevant, support us, keep the content here free and allow the idea to reach as many people as possible. **
-------------------------------------------------------------------------------
💸💸💸💸💸💸
👇 👇 👇 👇 👇 👇
S&P500 Buy and Sell trading plan.The S&P500 (SPX) index has been trading within a Channel Up pattern since the December 07 low and is currently on the 3rd Bullish Leg towards the top (Higher Highs trend-line). The basic Support is the 4H MA200 (orange trend-line) which has (nearly) held twice this month, with the 1D MA50 (red trend-line) right below being the separator between a medium-term bullish and bearish trend.
We expect a maximum Leg growth of 5.56% like the one that topped on December 27, so we are buying towards 4900 or until the 4H MACD makes a Bearish Cross (standard peak/ sell signal within the Channel Up), in which case we will sell and target the Channel's bottom (Higher Lows trend-line) at 4800 (-2.80% decline like January 05), or close earlier if the 4H MA200 gets hit.
-------------------------------------------------------------------------------
** Please LIKE 👍, FOLLOW ✅, SHARE 🙌 and COMMENT ✍ if you enjoy this idea! Also share your ideas and charts in the comments section below! This is best way to keep it relevant, support us, keep the content here free and allow the idea to reach as many people as possible. **
-------------------------------------------------------------------------------
💸💸💸💸💸💸
👇 👇 👇 👇 👇 👇

DAX Channel Down aiming at 16000DAX (DE40) has transitioned into a Channel Down pattern following the December 14 top rejection on the Higher Highs trend-line. The 1D MA50 (blue trend-line) is fast approaching as the first level of Support but we expect it downtrend to bottom lower as resembles the declines of August 2023, March 2023 and December 2022 both on price and 1D RSI terms.
All those declines have been extended at least to -6.50% so if the current pattern continues to replicate them, we expect a 1D MA200 (orange trend-line) test. As a result our Target is 16000, exactly at the top of the Support Zone. We will buy for the medium-term once the 1D RSI starts making Higher Lows (buy on the 2nd Higher Low) at below neutral levels. The 1W MA100 (yellow trend-line) is the long-term Support.
-------------------------------------------------------------------------------
** Please LIKE 👍, FOLLOW ✅, SHARE 🙌 and COMMENT ✍ if you enjoy this idea! Also share your ideas and charts in the comments section below! This is best way to keep it relevant, support us, keep the content here free and allow the idea to reach as many people as possible. **
-------------------------------------------------------------------------------
💸💸💸💸💸💸
👇 👇 👇 👇 👇 👇

NASDAQ Post Cup & Handle rally in motion. There'll be pullbacks.Nasdaq (NDX) has completed a giant Cup & Handle pattern and since the late October 2023 bottom, it has started the post Handle rally. This rally historically tends to be a very long-term one but with its fair share of corrections to at least the 1W MA50 (blue trend-line).
As you know 2022 was the year of the Inflation Crisis (left side of the Cup) while 2023 was its recovery (right side of Cup). Going back to the 2 most recent Bear Cycles, the 2008 Housing Crisis and 2002 Dotcom Crisis, we can observe similar Cup & Handle patterns, with identical 1W RSI sequences (oversold on their bottom and starting a Channel Down when the Handle begins).
The rally that followed after the Handle in 2011 and 2005 started another pull-back to the 1W MA50 (ellipse) just a few months after when the 1W RSI hit the top of its Channel Down. The chart shows that we might be in a similar situation right now. As a result, long-term investors may seek an additional buy entry as close to the 1W MA50 as possible like the late October bottom.
-------------------------------------------------------------------------------
** Please LIKE 👍, FOLLOW ✅, SHARE 🙌 and COMMENT ✍ if you enjoy this idea! Also share your ideas and charts in the comments section below! This is best way to keep it relevant, support us, keep the content here free and allow the idea to reach as many people as possible. **
-------------------------------------------------------------------------------
💸💸💸💸💸💸
👇 👇 👇 👇 👇 👇

S&P500 Dead cat bounce?The S&P500 index (SPX) is unfolding today the 3rd green 1D candle in a row, having gained back the vast majority of losses sustained last week. The December 28 rejection took place just below the 4820 All Time High (ATH) and as the 1D MACD is printing a sequence similar to the July 27 2023 peak, we expect the price to make a bearish reversal before the week is over.
The minimum target on this correction for us is the 1D MA50 (blue trend-line), which currently is at 4580. Throughout this 14-month Channel Up though, the minimum decline % has been -8.06%. So if selling gets accelerated we don't rule out seeing a 1D MA200 (orange trend-line) test at 4450. In order to re-sell though this low, we need to get a candle closing below the 1D MA50 and then sell upon a bounce above the 1D MA50, similar to September 01 2023 and March 06 2023.
-------------------------------------------------------------------------------
** Please LIKE 👍, FOLLOW ✅, SHARE 🙌 and COMMENT ✍ if you enjoy this idea! Also share your ideas and charts in the comments section below! This is best way to keep it relevant, support us, keep the content here free and allow the idea to reach as many people as possible. **
-------------------------------------------------------------------------------
💸💸💸💸💸💸
👇 👇 👇 👇 👇 👇

DOW JONES Correction has started. Where can it stop?Dow Jones (DJI) started a strong decline since our December 29 2023 sell call (see chart below), the strongest since the remarkable rally started on the October 29 bottom:
On today's analysis, we want to look into the same market dynamics and the pattern we drew 10 days ago but this time on the 1D time-frame. What stands out the most is that this time on the January 02 2024 High, the RSI peak that was made a few days back on December 19 2023 (hence the Bearish Divergence) was a (much) Higher High that the previous two (red arrows down) on the Higher Highs trend-line (July 26 2023 and April 13 2023), that was made on the vastly overbought level of 87.50 (highest since January 11 2018).
Our short-term target remains 36750, which represents the 0.618 Fibonacci retracement level from the Jan 02 High. The other feature on this 1D chart that stands out is the 38.50 1D RSI Support, which provided rebounds on May 25 2023 (long-term) and August 24 2023 (short-term). That RSI Support reveals where our first buy attempt should be. Price-wise that could be as low was the 0.5 Fibonacci retracement level (35100) of the October 27 Low. By the time it potentially makes contact with it, the 1D MA200 (orange trend-line) could be there as well.
A medium-term candidate is also a -4.50% range from the Jan 02 High, which would give us 36150 and is where the 1D MA50 (blue trend-line) is headed right now.
-------------------------------------------------------------------------------
** Please LIKE 👍, FOLLOW ✅, SHARE 🙌 and COMMENT ✍ if you enjoy this idea! Also share your ideas and charts in the comments section below! This is best way to keep it relevant, support us, keep the content here free and allow the idea to reach as many people as possible. **
-------------------------------------------------------------------------------
💸💸💸💸💸💸
👇 👇 👇 👇 👇 👇

DAX The decline isn't over but MACD can give a timely buy.DAX (DE40) gave us an excellent sell signal last time we looked into it (December 14 2023, see chart below), as the 1D MACD Bearish Cross, was our sell signal:
Our 16500 short-term target has already been hit, and we now shift our focus on the medium-term as it appears that this pull-back will most likely be extended to the 1D MA50 (blue trend-line) at least.
It was a similar correction on December 13 2022, which after almost reaching the 1.382 Fibonacci extension level (as the currrent High), it got rejected back to the 1D MA50 on a -6.50% decline. As a result our sell target is now 16150 (1D MA50 contact) and we will buy again for the long-term only when the 1D MACD makes a Bullish Cross, which was the case on January 03 2023.
-------------------------------------------------------------------------------
** Please LIKE 👍, FOLLOW ✅, SHARE 🙌 and COMMENT ✍ if you enjoy this idea! Also share your ideas and charts in the comments section below! This is best way to keep it relevant, support us, keep the content here free and allow the idea to reach as many people as possible. **
-------------------------------------------------------------------------------
💸💸💸💸💸💸
👇 👇 👇 👇 👇 👇

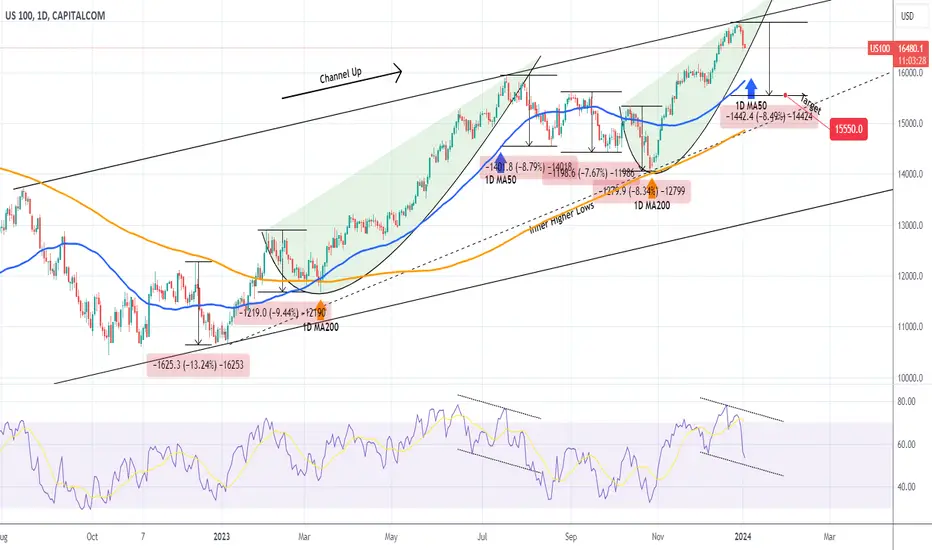
NASDAQ Hit the Channel's Top. Mid-term correction expected.Nasdaq (NDX) hit (and marginally broke above) its November 2021 All Time High (ATH), completing the expected Megaphone pattern we shared with you on November 16 (see chart below):
Last Thursday (December 28) the index hit the Higher Highs trend-line that started on the August 16 2022 High and can be treated as the top of a Channel Up pattern. The key here is the 1D RSI, which is developing a Channel Down, i.e. Bearish Divergence, similar to the July 19 2023 High.
As a result, it is highly likely to see a good medium-term pull-back, which within the Channel Up pattern has been around -8.50% on average. Such a decline would approach the 1D MA200 (orange trend-line). Our target is 15550.
-------------------------------------------------------------------------------
** Please LIKE 👍, FOLLOW ✅, SHARE 🙌 and COMMENT ✍ if you enjoy this idea! Also share your ideas and charts in the comments section below! This is best way to keep it relevant, support us, keep the content here free and allow the idea to reach as many people as possible. **
-------------------------------------------------------------------------------
💸💸💸💸💸💸
👇 👇 👇 👇 👇 👇
S&P500 Giant Cup and Handle and CORRECTION in play?The S&P500 index (SPX) almost hit the 4820 All Time High (ATH) level on the last trading session of 2023. That day completed the 9th straight green weekly (1W) candle, a feat last seen on the week of February 19 2019.
This doesn't necessarily indicate that any sort of correction is due as a bullish market can run rallies fueled on fundamental news for even longer period of times. But the fact that the ATH test completes a Cup pattern, could be alarming as, especially on overbought 1W RSI levels, Cup patterns tend to deliver one final pull-back in the form of a 'Handle' structure before making a new clear All Time High.
Technically, the 1W MA50 (blue trend-line) tends to be an intact Support during the year(s) of a Bull Market and so fart it was last hit in late October 2023. If 2024 is indeed a Bull Phase year, then the 1W MA50 should hold. If the Handle pulls back the current bullish trend, then the two could 'meet' at around 4500, which is marginally above the 0.236 Fibonacci retracement level. A stronger correction to the 0.382 level is highly unlikely unless pessimistic news (e.g. Fed, growth, inflation, unemployment) hit the market.
-------------------------------------------------------------------------------
** Please LIKE 👍, FOLLOW ✅, SHARE 🙌 and COMMENT ✍ if you enjoy this idea! Also share your ideas and charts in the comments section below! This is best way to keep it relevant, support us, keep the content here free and allow the idea to reach as many people as possible. **
-------------------------------------------------------------------------------
💸💸💸💸💸💸
👇 👇 👇 👇 👇 👇

DOW JONES Huge Bearish Divergence on 4HDow Jones (DJI) is trading within a very aggressive Channel Up since the October 27 bottom that has seen it rise almost by +17%, making new a All Time High (ATH) in the process. In the meantime it is about to hit the Higher Highs trend-line that has been acting as a Resistance, rejecting similar Channel Up patterns since April 14.
What is more alarming than this Resistance, is the Channel Down that has emerged on the 4H RSI. The other two similar Channel Down patterns that emerged after the RSI got overbought, did so right before the index peaked on the Higher Highs trend-line, starting two corrective Bearish Megaphone patterns. Those structures reached at least the 0.5 Fibonacci retracement level measured from the previous Higher Low, and the 0.618 Fibonacci level from the bottom of the (blue) Channel Up.
Based on this occurrence, we expect yet another Higher Highs rejection that will test at least the 0.618 Fib at 36750, which is our current sell target. Potentially, if the selling pressure is pilled up and transitions to the 1D time-frame, it can reach as low as the 0.5 Fibonacci from the October bottom at 35150.
-------------------------------------------------------------------------------
** Please LIKE 👍, FOLLOW ✅, SHARE 🙌 and COMMENT ✍ if you enjoy this idea! Also share your ideas and charts in the comments section below! This is best way to keep it relevant, support us, keep the content here free and allow the idea to reach as many people as possible. **
-------------------------------------------------------------------------------
💸💸💸💸💸💸
👇 👇 👇 👇 👇 👇

RUSSELL 2000 on a 20 month High! Is it sustainable?Russell 2000 (RUT) gave us an excellent buy entry on our last call (see chart below), as we achieved the most optimal buy near Support 2 and rallied all the way to our 2000 Target:
The Resistance Zone broke and this delivered a new 20-month High on the index, the effect of which is more accurately seen on the 1W time-frame. The question is, how sustainable can this rally be?
Well as the 1W RSI is only 3 points away from getting overbought (70.00) for the first time since March 2021, having also entered the 2 year Higher Highs Zone, it becomes less and less sustainable. In fact a less risky medium-term strategy would be to start selling and target the 1D MA50 (red trend-line). That is where we will reverse to a buy and target Resistance 1 at 2140.
-------------------------------------------------------------------------------
** Please LIKE 👍, FOLLOW ✅, SHARE 🙌 and COMMENT ✍ if you enjoy this idea! Also share your ideas and charts in the comments section below! This is best way to keep it relevant, support us, keep the content here free and allow the idea to reach as many people as possible. **
-------------------------------------------------------------------------------
💸💸💸💸💸💸
👇 👇 👇 👇 👇 👇

S&P500 Is 4800 the end of the road after 9 green weeks?The S&P500 index (SPX) is currently on its 9th straight green week (1W candle) following the October 23 (weekly terms) bottom. That was a Higher Low on the 15-month Channel Up and based on that pattern, the index is approaching its top (Higher Highs trend-line).
What adds more weight to the very high levels it is trading at, is that the All Time High is just above the current price at 4820. A peak on that level would represent a +17.40% increase, exactly the % rise of the first Bullish Leg of the 15-month Channel Up that peaked on the week of November 28 2022 and then corrected by -8.06%.
With the 1W RSI almost overbought (70.00) as it was on July 24, which was the peak of the previous Higher High of the Channel Up that initiated a 3-month correction of almost -11% and the 1W MACD on a post Bullish Cross level similar to the highs of August 15 2022 and November 28 2022 that kickstarted corrections, the selling pressure has now considerably stronger parameters to start.
This means that, at least from a technical perspective, this is the strongest sell opportunity since late July. A minimum correction of -8.00% would deliver a test of the 1W MA50 (blue trend-line) and as such, our target is 4450 (slightly above it).
If however the bullish trend continues for a few more weeks and pursues the maximum % rally we have seen since 2021, which has been +20.95%, then we can see an extension at around 4950, in which case we will add an additional (2nd) sell and both our bearish targets will be restructured at 4580 (-8.00%).
-------------------------------------------------------------------------------
** Please LIKE 👍, FOLLOW ✅, SHARE 🙌 and COMMENT ✍ if you enjoy this idea! Also share your ideas and charts in the comments section below! This is best way to keep it relevant, support us, keep the content here free and allow the idea to reach as many people as possible. **
-------------------------------------------------------------------------------
💸💸💸💸💸💸
👇 👇 👇 👇 👇 👇

HANG SENG Buy opportunity.Hang Seng (HSI1!) has been trading within a Channel Down throughout the whole year. As the rice hit its bottom (Lower Lows trend-line) on December 11 and the 1D MACD formed a Bullish Cross, we expect the new Bullish Leg towards the 1D MA200 (orange trend trend-line) and the to (Lower Highs trend-line) of the Channel Down.
The average rise within this pattern has been around 11% and based on that, we are targeting 17700.
-------------------------------------------------------------------------------
** Please LIKE 👍, FOLLOW ✅, SHARE 🙌 and COMMENT ✍ if you enjoy this idea! Also share your ideas and charts in the comments section below! This is best way to keep it relevant, support us, keep the content here free and allow the idea to reach as many people as possible. **
-------------------------------------------------------------------------------
💸💸💸💸💸💸
👇 👇 👇 👇 👇 👇

NIKKEI is starting a new rally.Last time we looked at Nikkei (NI225) for the long-term (May 26 2022), it gave us the most optimal buy entry we could expect (see chart below), as it bounced on the 10 year (since October 2012) Higher Lows trend-line, and from 26000 almost hit 34000:
The index has since seen a 4 month correction (from July to October) to the 1W MA50 (blue trend-line), which held and initiated a rebound. This rebound is technically the introduction to the new multi-month rally towards the top of the Channel Up. This is consistent with the pre COVID crash consolidation and before that with the first three quarters of 2017.
Both sequences completed rallies of approximately +63%, the first to the 1.618 Fibonacci extension and the second above the 2.0 Fib level. As a result if we take a modest approach to the upcoming rally, we expect to see at least 36700, which is the 2.0 Fib ext. and is our long-term target. A new +63% rise from the bottom though, gives as a 40300 price tag.
-------------------------------------------------------------------------------
** Please LIKE 👍, FOLLOW ✅, SHARE 🙌 and COMMENT ✍ if you enjoy this idea! Also share your ideas and charts in the comments section below! This is best way to keep it relevant, support us, keep the content here free and allow the idea to reach as many people as possible. **
-------------------------------------------------------------------------------
💸💸💸💸💸💸
👇 👇 👇 👇 👇 👇

S&P500 The rally still has one more High to give at least.The S&P500 index (SPX) pulled-back yesterday on the strongest 1D red candle since October. A natural technical reaction after weeks of rise-only price action and an overbought 1D RSI that almost hit 83.00. The long-term pattern remains a Channel Up since the October 13 2022 market bottom and as long as the 1D MA50 (blue trend-line) is supporting, it is likely to see one final upward extension towards its top (Higher Highs trend-line).
The two major Higher High sequences (bullish legs) of this Channel have been around +20.50%, extending almost as high as the 2.0 Fibonacci level. As a result we are expecting a minimum of 4930, before any larger correction takes place, unless of course the index breaks above its Channel Up, in which case we will look for a new pattern.
-------------------------------------------------------------------------------
** Please LIKE 👍, FOLLOW ✅, SHARE 🙌 and COMMENT ✍ if you enjoy this idea! Also share your ideas and charts in the comments section below! This is best way to keep it relevant, support us, keep the content here free and allow the idea to reach as many people as possible. **
-------------------------------------------------------------------------------
💸💸💸💸💸💸
👇 👇 👇 👇 👇 👇
