DOW JONES History shows that we're now targeting 68000.Dow Jones (DJI) recovered its 1W MA50 (blue trend-line), sending a clear technical message that the 'Trade War' correction is over and the long-term bullish trend has been resumed.
The bottom of that correction was on the 1W MA200 (orange trend-line), which has been the absolute long-term Support trend-line for the index, having broken by a large extent only during the March 2020 COVID crash.
That was also a bottom for Dow's Bullish Megaphone pattern. The last time that the index handed a 1W MA200 bottom while trading within a Bullish Megaphone was on February 08 2016. On both bottoms, the 1W RSI hit the 30.00 oversold barrier.
In 2016 that bottom rebound initiated a (blue) Channel Up that lasted for almost 2 years and peaked on the 3.0 Fibonacci extension level. If Dow continues to replicate that pattern, we are looking at a 68000 Target (Fib 3.0 ext) by mid-2027.
-------------------------------------------------------------------------------
** Please LIKE 👍, FOLLOW ✅, SHARE 🙌 and COMMENT ✍ if you enjoy this idea! Also share your ideas and charts in the comments section below! This is best way to keep it relevant, support us, keep the content here free and allow the idea to reach as many people as possible. **
-------------------------------------------------------------------------------
💸💸💸💸💸💸
👇 👇 👇 👇 👇 👇
Stockindexsignals

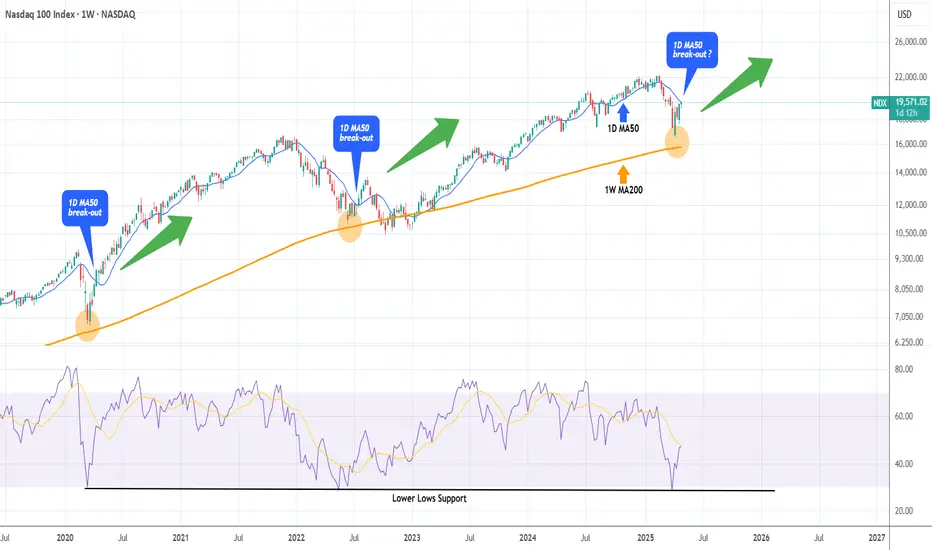
NASDAQ broke above its 1D MA200 after 2 months! Target 22000.Nasdaq (NDX) broke today above its 1D MA200 (orange trend-line) for the first time in more than 2 months (since March 06), following the U.S. - Chine trade deal. This trend-line also had the March 26 rejection under its belt, which initiated the most aggressive part of the 'Trade War' correction.
The last time the index broke above its 1D MA200 on a similar pattern was when it was recovering after the bottom of the 2022 Inflation Crisis. The February 01 2023 break-out produced an instant rise to the 1.382 Fibonacci extension before a short-term correction to re-test the 1D MA200.
As a result, we expect 22000 (1.382 Fib ext) to come as early as this week before any discussions can be made for a new pull-back.
-------------------------------------------------------------------------------
** Please LIKE 👍, FOLLOW ✅, SHARE 🙌 and COMMENT ✍ if you enjoy this idea! Also share your ideas and charts in the comments section below! This is best way to keep it relevant, support us, keep the content here free and allow the idea to reach as many people as possible. **
-------------------------------------------------------------------------------
Disclosure: I am part of Trade Nation's Influencer program and receive a monthly fee for using their TradingView charts in my analysis.
💸💸💸💸💸💸
👇 👇 👇 👇 👇 👇

RUSSELL 15-year Cyclical pattern calls for enormous growth.Russell 2000 (RUT) made a massive rebound on last month's candle on the 1M MA100 (green trend-line), closing above it and maintaining the long-term price action above this Support since the March 2020 COVID crash.
Practically that was the only time the 1M MA100 broke since the October 11 recovery, which was the start of a 15-year Cyclical Pattern that initiates Bull Cycles after 1M MA50 (blue trend-line) ad then 1M MA100 rebounds that peak on the 2.0 Fibonacci extension.
Last month's rebound sets the stage for a post-COVID type recovery, especially if the Fed cuts the Interest Rates on their next meeting. The 2.0 Fibonacci extension is a little bit over 3500, which is our long-term Target.
-------------------------------------------------------------------------------
** Please LIKE 👍, FOLLOW ✅, SHARE 🙌 and COMMENT ✍ if you enjoy this idea! Also share your ideas and charts in the comments section below! This is best way to keep it relevant, support us, keep the content here free and allow the idea to reach as many people as possible. **
-------------------------------------------------------------------------------
💸💸💸💸💸💸
👇 👇 👇 👇 👇 👇

DOW JONES Can this Channel Up hold after the Fed Rate Decision?Dow Jones (DJIA) has been trading within a Channel Up since the April 24 Low and yesterday's correction (technically its Bearish Leg) stopped on the 4H MA50 (blue trend-line). Having formed already a Golden Cross, as long as this 4H MA50 holds, it should technically fuel the pattern's new Bullish Leg.
The 'weakest' Bullish Leg within this Channel Up has been +3.58%, so we expect a minimum repeat of that, giving a Target at 42100 on the short-term. This falls perfectly at the bottom of the 5 week Resistance Zone.
If this Channel Up doesn't get invalidated after today's Fed Rate Decision, it will most likely push the price there.
-------------------------------------------------------------------------------
** Please LIKE 👍, FOLLOW ✅, SHARE 🙌 and COMMENT ✍ if you enjoy this idea! Also share your ideas and charts in the comments section below! This is best way to keep it relevant, support us, keep the content here free and allow the idea to reach as many people as possible. **
-------------------------------------------------------------------------------
💸💸💸💸💸💸
👇 👇 👇 👇 👇 👇

S&P500 Stuck between the 1D MA50 and 1D MA200.The S&P500 index (SPX) is now on a short-term correction following the impressive recovery of the last 30 days that made it almost test its 1D MA200 (orange trend-line). This is a technical rejection but the fact that the 1D MA50 (blue trend-line) is now the Support can be encouraging.
The reason is that since January 2023, every time the index broke above its 1D MA50 it turned into a Support that held and produced an immediate bullish extension on every occasion except for one time (Sep 2024), which still recovered 1 week after.
As a result, it is more likely for SPX to test its All Time High (ATH) by July than entering a long-term correction again.
-------------------------------------------------------------------------------
** Please LIKE 👍, FOLLOW ✅, SHARE 🙌 and COMMENT ✍ if you enjoy this idea! Also share your ideas and charts in the comments section below! This is best way to keep it relevant, support us, keep the content here free and allow the idea to reach as many people as possible. **
-------------------------------------------------------------------------------
Disclosure: I am part of Trade Nation's Influencer program and receive a monthly fee for using their TradingView charts in my analysis.
💸💸💸💸💸💸
👇 👇 👇 👇 👇 👇

NASDAQ's Inverse H&S that targets $25000Nasdaq (NDX) is forming the Right Shoulder of a potential Inverse Head and Shoulders (IH&S) pattern. The price action is 'stuck' within the 1D MA200 (orange trend-line), which got tested on Friday for the first time since March, and the 1D MA50 (blue trend-line).
Since the 1D MA200 was the level that initiated the March 26 rejection, it is possible to see a short-term pull-back now, all in the process of forming the Right Shoulder and after the market digests the new Fed Rate Decision, starts the next Leg Up. Note that the 1D RSI is already on its February highs.
As a result, our long-term Target is at 25000, just below the 2.0 Fibonacci extension level, which is a standard technical target for IH&S patterns.
-------------------------------------------------------------------------------
** Please LIKE 👍, FOLLOW ✅, SHARE 🙌 and COMMENT ✍ if you enjoy this idea! Also share your ideas and charts in the comments section below! This is best way to keep it relevant, support us, keep the content here free and allow the idea to reach as many people as possible. **
-------------------------------------------------------------------------------
Disclosure: I am part of Trade Nation's Influencer program and receive a monthly fee for using their TradingView charts in my analysis.
💸💸💸💸💸💸
👇 👇 👇 👇 👇 👇

S&P500 1st 4H Golden Cross since Jan could be a TRAP!S&P500 (SPX) completed yearly today its first Golden Cross on the 4H time-frame since January 23. That formation issued an immediate pull-back but technically it's not very similar to the today's as that was formed after an All Time High (ATH) while now we are on the recovery phase after March's massive Trade War fueled correction.
The 4H Golden Cross however that looks more similar to the current is the one before January's, the August 21 2024. That was formed after a substantial market pull-back, though again not as strong as March's. Still, the 1D RSI patterns are also more similar and that again should keep us on high alert as 2 weeks later the index pulled back to the 0.5 Fibonacci retracement level from its previous High Resistance.
As a result, if we see the price now turning sideways for a week or so, we will give higher probabilities for a short-term pull-back, maybe not as low as the 0.5 Fib but at least to the 5450 region, before the market takes off to 6000.
-------------------------------------------------------------------------------
** Please LIKE 👍, FOLLOW ✅, SHARE 🙌 and COMMENT ✍ if you enjoy this idea! Also share your ideas and charts in the comments section below! This is best way to keep it relevant, support us, keep the content here free and allow the idea to reach as many people as possible. **
-------------------------------------------------------------------------------
Disclosure: I am part of Trade Nation's Influencer program and receive a monthly fee for using their TradingView charts in my analysis.
💸💸💸💸💸💸
👇 👇 👇 👇 👇 👇

NASDAQ testing its 1D MA50. Break-out or Fake-out?Nasdaq (NDX) has reached its 1D MA50 (blue trend-line) for the first time since February 24. Following the (near) rebound on the 1W MA200 (orange trend-line), this looks like a textbook recovery from a correction to a new long-term Bullish Leg.
Chronologically the last such correction was the March 2020 COVID flash crash, which after it almost touched the 1W MA200, it recovered as fast as the current rebound and when it broke above its 1D MA50, it turned it into the Support of the new long-term Bullish Leg.
What wasn't a break-out but a fake-out was the rebound after the June 13 2022 (near) 1W MA200 rebound, when the break above the 1D MA50 was false as it produced a new rejection and sell-off later on. The difference is that 2022 was a technical Bear Cycle both in terms of length and strength.
Whatever the case, Nasdaq has seen the lowest 1W RSI (oversold) reading among those 3 bottoms. So do you think today's 1D MA50 test is a break-out or fake-out?
-------------------------------------------------------------------------------
** Please LIKE 👍, FOLLOW ✅, SHARE 🙌 and COMMENT ✍ if you enjoy this idea! Also share your ideas and charts in the comments section below! This is best way to keep it relevant, support us, keep the content here free and allow the idea to reach as many people as possible. **
-------------------------------------------------------------------------------
💸💸💸💸💸💸
👇 👇 👇 👇 👇 👇
S&P500 repeating the 2019 recovery-Can hit 7000.The S&P500 index (SPX) is making a remarkable recovery as it completed yet another strong 1W green candle last week following the rebound on its Higher Lows Zone, near the 1W MA200 (orange trend-line).
This is a mirror price action with the last 1W MA200 rebound of the 2016 - 2019 Bullish Megaphone pattern, which not only recovered its previous All Time High (ATH) but also peaked on the 1.618 Fibonacci extension before the eventual 2020 COVID crash.
As a result, we believe that a 7000 Target is a very plausible one on the long-term.
-------------------------------------------------------------------------------
** Please LIKE 👍, FOLLOW ✅, SHARE 🙌 and COMMENT ✍ if you enjoy this idea! Also share your ideas and charts in the comments section below! This is best way to keep it relevant, support us, keep the content here free and allow the idea to reach as many people as possible. **
-------------------------------------------------------------------------------
Disclosure: I am part of Trade Nation's Influencer program and receive a monthly fee for using their TradingView charts in my analysis.
💸💸💸💸💸💸
👇 👇 👇 👇 👇 👇

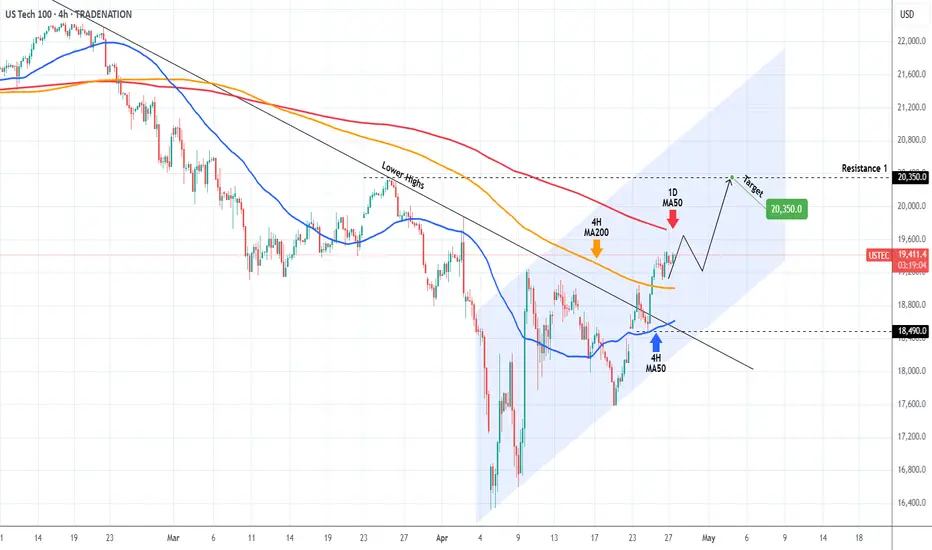
NASDAQ ahead of the most critical Resistance test.Nasdaq (NDX) not only broke above the Lower Highs trend-line of its All Time High (ATH) last week but managed to break and turn the 4H MA200 (orange trend-line) into Support.
It is now aiming for the 1D MA50 (red trend-line), which is the most crucial Resistance level of this recovery attempt and is what technically turns bearish trends into bullish if it turns into Support.
We expect a short-term rejection there, which should give a buy opportunity near the 4H MA200. Our Target for this is 20350 (Resistance 1).
-------------------------------------------------------------------------------
** Please LIKE 👍, FOLLOW ✅, SHARE 🙌 and COMMENT ✍ if you enjoy this idea! Also share your ideas and charts in the comments section below! This is best way to keep it relevant, support us, keep the content here free and allow the idea to reach as many people as possible. **
-------------------------------------------------------------------------------
Disclosure: I am part of Trade Nation's Influencer program and receive a monthly fee for using their TradingView charts in my analysis.
💸💸💸💸💸💸
👇 👇 👇 👇 👇 👇
DOW JONES New long-term bottom being formed on the 1W MA200.Dow Jones (DJI) hasn't yet broken above its 1D MA50 (blue trend-line) following the April 07 Low, but is nonetheless consolidating and holding the 1W MA200 (red trend-line), which hasn't broken as Support since October 17 2022.
That was a few days after the bottom of the 2022 Inflation Crisis was formed and the current Channel Up started. In fact, the rallies that started on both Channel Up bottoms since, have been almost identical in range (+22.60% and +23.80% respectively) so technically we should be expecting at least 44800 (+22.60% from April's Low) on the medium-term.
-------------------------------------------------------------------------------
** Please LIKE 👍, FOLLOW ✅, SHARE 🙌 and COMMENT ✍ if you enjoy this idea! Also share your ideas and charts in the comments section below! This is best way to keep it relevant, support us, keep the content here free and allow the idea to reach as many people as possible. **
-------------------------------------------------------------------------------
Disclosure: I am part of Trade Nation's Influencer program and receive a monthly fee for using their TradingView charts in my analysis.
💸💸💸💸💸💸
👇 👇 👇 👇 👇 👇

S&P500 Long and painful but necessary bottom formation.The S&P500 index (SPX) has been trading within a 2-year Bullish Megaphone pattern and the recent 2-month correction completed its latest Bearish Leg, as it reached the Higher Lows trend-line.
The massive rebound that took place there on April 07 may have turned out to be a highly volatile one but as mentioned on the title, it might be long and painful, but a necessary process nonetheless. That's mainly because it is the strongest correction since 2022 and the longest Bearish Leg of the pattern.
The market remains highly volatile until it gets a clear signal, bearish below the current Support of the 1W MA200 (red trend-line) or bullish above the 1D MA50 (blue trend-line). Despite the rather short-term uncertainty, the similarities with the Megaphone's previous bottom are uncanny, both having formed their Low on 1D RSI Double Bottom patterns.
Given that this previous Low initiated a massive +50% 1 year Bullish Leg/ rally, we expect to see at least 7100 on this next one by mid-2026.
-------------------------------------------------------------------------------
** Please LIKE 👍, FOLLOW ✅, SHARE 🙌 and COMMENT ✍ if you enjoy this idea! Also share your ideas and charts in the comments section below! This is best way to keep it relevant, support us, keep the content here free and allow the idea to reach as many people as possible. **
-------------------------------------------------------------------------------
Disclosure: I am part of Trade Nation's Influencer program and receive a monthly fee for using their TradingView charts in my analysis.
💸💸💸💸💸💸
👇 👇 👇 👇 👇 👇

NASDAQ Decision making becomes easy after seeing this chart.NASDAQ (NDX) is currently on the 3rd straight red month (1M candle), following the February High and subsequent sell-off due to the Trade War. This has been analyzed extensively in previous analyses and how the fundamental scene is only now starting to show some positive progress but still has a long way to go.
Technically though, the picture is very clear and favors long-term investing. The market has been trading within a Fibonacci Channel Up since the U.S. Housing Crisis in 2008 and along with the 2022 Inflation Crisis, those have been the only real Bear Cycle events in the past 18 years.
In between those there have been another 5 shorter term corrections, that offered great buying opportunities for the long-term and the recent 3-month one classifies as one.
There reasons are three. First it has come very close to the 1M MA50 (blue trend-line), which only broke during the Major Corrections. Second, the 1M RSI hit the 50.50 Symmetrical Support, which has held during all those 5 prior Minor Corrections. Third, those corrections only range between two Fibonacci levels.
The current correction fulfills all those conditions. And since the 'weakest' rally we've have on this 5 event sample has been +37.57% and the strongest +96.77%, we have a medium-term Target on Nasdaq at 22800 and a long-term one at 32500.
Do you still reserve doubts at investing long-term after seeing this macro chart?
-------------------------------------------------------------------------------
** Please LIKE 👍, FOLLOW ✅, SHARE 🙌 and COMMENT ✍ if you enjoy this idea! Also share your ideas and charts in the comments section below! This is best way to keep it relevant, support us, keep the content here free and allow the idea to reach as many people as possible. **
-------------------------------------------------------------------------------
💸💸💸💸💸💸
👇 👇 👇 👇 👇 👇

S&P500 Should the FED LEAVE POLITICS aside and finally cut??The S&P500 index (SPX, illustrated by the blue trend-line) has been under heavy selling pressure in the past 3 months, basically the start of the year, but Fed Chair Jerome Powell insisted once again yesterday that the Fed is on a wait-and-see mode, without the urge to cut rates. But can it afford not to do so?
A detailed look into the past 35 years of recorded Yield Curve (US10Y-US02Y) price action, shows that when it flattens and rebounds, the Fed steps in and cuts the interest rates (orange trend-line). It did so last year but paused/ stopped the process in an attempt to get Inflation (black trend-line) under control to the desired 2% target.
As you see on that 1M chart though, this hasn't always been beneficial for stocks as especially for September 2007 and January 2001, it took place parallel to the Housing and Dotcom Crises. This however happened both times when Inflation and Rates were both high.
The Inflation Rate now seems to be at a low level (and dropping) that has been consistent with market bottoms and not tops. As a result, it appears that it is more likely we are in a curve reversal that is consistent with bull trend continuation for the stock market, after short-term corrections, in our opinion either post March 2020 (COVID crash) or pre-2000, which is consistent to previous studies we've made that the current A.I. Bubble market is in similar early mania stages like the Dotcom Bubble in the early-mid 1990s.
So to answer the original question, we believe that the Fed can afford to cut the Interest Rates now and offset some of the medium-term slow in growth that the trade tariffs may inflict and as there are more probabilities it will do more good to the stock market than harm.
Your thoughts?
-------------------------------------------------------------------------------
** Please LIKE 👍, FOLLOW ✅, SHARE 🙌 and COMMENT ✍ if you enjoy this idea! Also share your ideas and charts in the comments section below! This is best way to keep it relevant, support us, keep the content here free and allow the idea to reach as many people as possible. **
-------------------------------------------------------------------------------
💸💸💸💸💸💸
👇 👇 👇 👇 👇 👇

DOW fulfilled all Market Bottom conditions. 2year rally started!Dow Jones (DJI) has cemented a strong Support zone last week. Not only did it almost test its 1W MA200 (orange trend-line) and successfully held but also the former All Time High (ATH) Resistance trend-line that started from the previous Cycle Top and now turned into Support.
This previous ATH trend-line held and offered its Support on the previous 2 major market bottoms as well (October 03 2022 and March 23 2020). Actually on all 3 previous Cycle bottoms that turned out to be the best level to buy long-term, the 1W RSI was oversold on the 30.00 limit.
All the above conditions were fulfilled on last week's (April 07 2025) Low. Even though Dow is expected to reach 53000 on its next Top in around 2 years, the most optimal Sell Signal has been given by the 1W RSI. After the 1W RSI breaks for the first time above the 70.00 overbought limit again, the best Sell Signal would be after it drops and re-tests again 70.00 for the 2nd time.
-------------------------------------------------------------------------------
** Please LIKE 👍, FOLLOW ✅, SHARE 🙌 and COMMENT ✍ if you enjoy this idea! Also share your ideas and charts in the comments section below! This is best way to keep it relevant, support us, keep the content here free and allow the idea to reach as many people as possible. **
-------------------------------------------------------------------------------
Disclosure: I am part of Trade Nation's Influencer program and receive a monthly fee for using their TradingView charts in my analysis.
💸💸💸💸💸💸
👇 👇 👇 👇 👇 👇

S&P500 1D Death Cross formed! Market COLLAPSE or Bear TRAP? The S&P500 index (SPX) is attempting to recover from the April 07 2025 market low, following the 90-day Tariff pause.
Last Thursday however it formed a Death Cross on the 1D time-frame, he first since May 11 2022, which was during the last Inflation Crisis correction. That was nothing like the current crash though as it was a technical 1-year Bear Cycle in contrast to today which is a flash crash inflicted by Trump's tariffs.
What looks though most similar to today is the 2020 COVID crash. Equally fast and brutal, that sell-off also took place under an extreme pressure environment of uncertainty (economic lockdowns) which the world has never seen, similar to today's tariffs that admittedly have put (for the moment) an end to the U.S. - China trade.
The COVID crash phase also formed a 1D Death Cross just 4 days after the March 23 2020 bottom. Last Thursday's 1D Death Cross came also just 3 days after the April 07 2025 Low. If this pattern of extreme market shock is a repetitive model under such fundamental events, then the stock market has bottomed. And if it follows the exact same recovery pattern as post-COVID, then it may reach the 1.1 Fibonacci extension at 6300 in a little over 5 months (162 days).
-------------------------------------------------------------------------------
** Please LIKE 👍, FOLLOW ✅, SHARE 🙌 and COMMENT ✍ if you enjoy this idea! Also share your ideas and charts in the comments section below! This is best way to keep it relevant, support us, keep the content here free and allow the idea to reach as many people as possible. **
-------------------------------------------------------------------------------
Disclosure: I am part of Trade Nation's Influencer program and receive a monthly fee for using their TradingView charts in my analysis.
💸💸💸💸💸💸
👇 👇 👇 👇 👇 👇

NASDAQ Trump's 2 TRADE WARS are identical! What you need to knowNASDAQ (NDX) had a massive bullish reversal 1W candle last week as, despite a Lower Low opening, the intra-week rebound surpassed the opening of the previous week. The sell-off reached almost as low as the 1W MA200 (orange trend-line) , which has been the Support level of the late 2022 Inflation Crisis bottom and has been untouched for more than 2 year.
This is not the first time we see this pattern. In an interesting twist of events, we saw the exact same formation during Trump's 1st Trade War, which bottomed on the week of December 24 2018, near the 1W MA200 as well and exactly on the 0.382 Fibonacci retracement level from the Top.
The similarities don't stop there as both Trade War periods were manifested within Megaphone patterns. Their sell-off/ Bearish Leg was -25% (now) and -23% (2018) respectively, while the set-up leading to those Megaphones was a +103.50% and +113.50% Bull Cycle respectively. Also both sell-offs got an oversold (30.00 or lower) 1W RSI bottom.
So, since NDX has currently completed a -25% correction near the 1W MA200 and the 0.382 Fib with the 1W RSI bouncing off the oversold barrier, it is very likely that we've formed the pattern's bottom, especially if the global fundamentals point towards trade deals.
If this Low remains intact, we expect a similar +35% short-term Top at 22500 within a 3-4 month period and then long-term rally near the -0.382 Fibonacci extension at 29000.
-------------------------------------------------------------------------------
** Please LIKE 👍, FOLLOW ✅, SHARE 🙌 and COMMENT ✍ if you enjoy this idea! Also share your ideas and charts in the comments section below! This is best way to keep it relevant, support us, keep the content here free and allow the idea to reach as many people as possible. **
-------------------------------------------------------------------------------
💸💸💸💸💸💸
👇 👇 👇 👇 👇 👇

DOW 104% TARIFFS on China activated. Can the market be saved?Dow Jones (DJIA) is almost on its 1W MA200 (orange trend-line) and earlier today President Trump activated 104% duties on Chinese imports. This is far from being an encouraging development especially after Monday's attempt for the market to recover.
Most of the gains were lost yesterday and today it is a wait-and-see game in anticipation of the market reaction on the opening bell of Wall Street.
From a long-term technical perspective however, Dow is on a huge buy level that we've only seen another 4 times since the Housing Bubble bottom in March 2009. That buy level consists of two conditions: price touching the 1W MA200 and the 1W RSI hits (or comes extremely close to) the 30.00 oversold limit.
As you can see that has happened last time on September 19 2022 (Inflation Crisis bottom), March 09 2020 (COVID crash), August 24 2015 (China slowdown, Grexit) and August 08 2011 (first correction since 2009 Housing Crisis). The situation most similar to the current, is the COVID crash as it was the fastest drop to the 1W MA200 and 1W RSI to 30.00.
Despite the brutal correction, it took the market 'only' 43 weeks (301 days) to reach again the 0.786 Fibonacci retracement level. That is the top of the Blue Zone of the Fibonacci Channel Up that started on the March 2009 Housing bottom. The Blue Zone, consisting of the 0.786 - 0.382 Fib range, is important as it has dominated the multi-year bullish trend and contained the price action inside it, with only a few occasions diverging outside of it.
The longest it took Dow to reach the 0.786 Fib again after such correction was 110 weeks (770 days) and that interestingly enough happened two out of the four times. Practically reaching the 0.786 Fib constitutes a Cycle Top.
So essentially, despite the uncertainty and panic, the market is technically on a Support level that in 16 years we've only seen another 4 times, that's once every 4 years, which is a fair sample of a Cycle size. As a result, assuming stability comes to the world through trade deals (and why not Rate Cut announcements), we may see Dow reaching its 0.786 Fib again (and make new ATH) the fastest by February 02 2026, hitting 49000 and the longest by May 17 2027, hitting 56000 roughly.
-------------------------------------------------------------------------------
** Please LIKE 👍, FOLLOW ✅, SHARE 🙌 and COMMENT ✍ if you enjoy this idea! Also share your ideas and charts in the comments section below! This is best way to keep it relevant, support us, keep the content here free and allow the idea to reach as many people as possible. **
-------------------------------------------------------------------------------
💸💸💸💸💸💸
👇 👇 👇 👇 👇 👇

S&P500 Dead Cat Bounce or V-shaped Recovery?The S&P500 index (SPX) saw a remarkable turnaround yesterday after the Wall Street opening. The early futures sell-off came very close to the 1W MA200 (orange trend-line), which has been the ultimate Support level since the March 2009 Housing Crisis bottom (the last major Bear Cycle).
It supported the 2022 Inflation Crisis, the 2018 U.S. - China Trade War, the 2015 E.U./ Oil Crisis and 2011 correction. It only broke during the irregularity of the March 2020 COVID flash crash.
Note that the 1W RSI hitting 27.30 has only happened during the COVID crash and the actual March 2009 Housing Crisis Bottom. At the same time, the index reached the All Time High (ATH) trend-line (dashed0 of the High before the 2022 Inflation Crisis (previous correction phase). As this chart shows, previous ATH trend-lines have never been broken during the correction phases that followed them.
In any case, the million dollar question is of course this: Was yesterday a Dead Cat Bounce inside the new Bear Cycle or we are ahead of a V-shaped recovery? Well technically it depends on the 1W MA200 (the market needs 1W candles to close above it) while fundamentally if depends on potential trade deals and of course the Fed (the market needs rate cut assurances).
If this is a V-shaped Recovery indeed, there is no reason not to expect the market to follow all previous rebounds of 1W MA200 corrections that weren't Bear Cycles (Bear Cycles on this chart are 2008 and 2022).
As you can see, all rebounds have been sharp, indeed V-shaped recoveries, ranging from 20 to 27 weeks (140 - 189 days) until they broke their previous High. So this indicates that technically, SPX should make new ATH by October 13 2025 the latest (and September 02 earliest). Of course this is just a projection, this time we have no COVID shutdowns, no Grexits or Brexits, no Oil crises, it is all due to one fact, the tariffs and if deals are reached and the Fed delivers the much needed rat cuts, the recovery may be even faster, as sharp as the correction has been.
The facts are on the historic data on the chart. The conclusions are yours.
-------------------------------------------------------------------------------
** Please LIKE 👍, FOLLOW ✅, SHARE 🙌 and COMMENT ✍ if you enjoy this idea! Also share your ideas and charts in the comments section below! This is best way to keep it relevant, support us, keep the content here free and allow the idea to reach as many people as possible. **
-------------------------------------------------------------------------------
💸💸💸💸💸💸
👇 👇 👇 👇 👇 👇

NASDAQ Black Monday or a Massive Rally??Nasdaq (NDX) opened on early Monday futures trade below both its August 05 2024 and April 19 2024 Lows. All technical Supports have been broken and the market made new 12-month Lows. The market sentiment is extremely bearish, technically oversold, even the 1W RSI is below the 30.00 oversold barrier and the prevailing fundamentals regarding the back-and-forth Tariffs between nations don't leave much room for encouragement.
The index is more than -25% off the February 17 2025 All Time High (ATH), technically Bear Market territory, and the last time it dropped more this fast is during the lockdowns of the COVID crash (February 20 - March 23 2020). The market dropped by -32%, below also all known technical Supports (including its August low) before finding support and forming a bottom just above the 1W MA200 (red trend-line).
The two time events are virtually identical with the only notable difference is that Nasdaq is about to form the 1D Death Cross now while in 2020 it did about 1 month after the low.
The only technical development that leaves room for encouragement is that the 1W RSI during COVID got oversold just a day before the eventual market bottom.
Does today's 1W RSI drop into oversold territory mean that we are about to form a bottom? Unknown. But what we do know is that on March 03 and 16 2020 on two urgent, out-of-schedule meetings, the Fed stepped in to save the market from the free-fall (and save they did) by cutting the Interest Rates to near zero (first to 1.25% and then to 0.25% subsequently from 1.75% previously).
Perhaps that is the only thing that can restore investor confidence (certainly the only action that the Fed can do) and avoid a Black Monday below the 1W MA200, which would be catastrophic. On the other hand, if the U.S. government reach indeed trade deals with the rest of nations and the Fed do what they can from their end, we may even hit new ATH by August!
So what do you think it's going to be? Black Monday or Massive Rally?
-------------------------------------------------------------------------------
** Please LIKE 👍, FOLLOW ✅, SHARE 🙌 and COMMENT ✍ if you enjoy this idea! Also share your ideas and charts in the comments section below! This is best way to keep it relevant, support us, keep the content here free and allow the idea to reach as many people as possible. **
-------------------------------------------------------------------------------
💸💸💸💸💸💸
👇 👇 👇 👇 👇 👇

S&P500 down -4.84%, worst day since 2020 COVID crash! GAME OVER?The S&P500 (SPX) had yesterday its worst 1D closing (-4.84%) in exactly 5 years since the COVID flash crash started on March 11 2020 (-4.89%). Not even during the 2022 Inflation Crisis did the index post such strong losses in a day.
Obviously amidst the market panic, the question inside everyone's minds is this: 'Are we in a Bear Market?'. The only way to view this is by looking at SPX's historic price action and on this analysis we are doing so by examining the price action on he 1W time-frame since the 2008 Housing Crisis.
As you can see, starting from the Inflation Crisis bottom in March 2009, we've had 4 major market corrections (excluding the March 2020 COVID flash crash which was a Black Swan event). All of them made contact with the 1W MA200 (orange trend-line) and immediately rebounded to start a new Bull Cycle. Those Bull Cycles typically lasted for around 3 years and peaked at (or a little after) the red vertical lines, which is the distance measured from the October 15 2007 High to the May 07 2011 High, the first two Cycle Highs of the dataset that we use as the basis to time the Cycles on this model.
The Sine Waves (dotted) are used to illustrate the Cycle Tops (not bottoms), so are the Time Cycles (dashed). This helps at giving a sense of the whole Cycle trend and more importantly when the time to sell may be coming ahead of a potential Cycle Top.
This model shows that the earliest that the current Cycle should peak is the week of August 11 2025. If it comes a little later (as with the cases of October 01 2018 and June 01 2015), then it could be within November - December 2025.
The shortest correction to the 1W MA200 has been in 2011, which only lasted 22 weeks (154 days). The longest is the whole 2008 Housing Crisis (73 weeks, 511 days). All other three 1W MA200 corrections have lasted for less than a year.
On another note, the 1W RSI just hit the 34.50 level. Since the 2009 bottom, the market has only hit that level 5 times. All produces immediate sharp rebounds. The December 17 2018, March 16 2020 and August 15 2011 RSI tests have been bottoms while May 09 2022 and August 24 2015 bottomed later but still produced sharp bear market rallies before the eventual bottom.
Uncertainty is obviously high but these are the facts and the hard technical data. Game over for stocks or this is a wonderful long-term buy opportunity? The conclusions are yours.
-------------------------------------------------------------------------------
** Please LIKE 👍, FOLLOW ✅, SHARE 🙌 and COMMENT ✍ if you enjoy this idea! Also share your ideas and charts in the comments section below! This is best way to keep it relevant, support us, keep the content here free and allow the idea to reach as many people as possible. **
-------------------------------------------------------------------------------
💸💸💸💸💸💸
👇 👇 👇 👇 👇 👇

DOW JONES One break away from a rally back to 45000.Dow Jones (DJIA) got stopped on the 4H MA50 (blue trend-line) as the market paused ahead of today's tariffs implementation. This is the 2nd technical rejection since the March 13 bottom, the first being n the 4H MA200 (orange trend-line) last Wednesday.
This bottom is technically the start of the new Bullish Leg of the 1-year Bullish Megaphone pattern, and is very similar, both in 1D RSI and price terms, to the first one (April 19 - May 20 2024). As you can see, we are currently within the sane 0.5 - 0.786 Fib range, where the price consolidated before the eventual 4H MA200 bullish break-out.
If it continues to replicate the 2024 Bullish Leg, then be ready for a straight Resistance test once the 4H MA200 breaks. Our Target is 45000.
-------------------------------------------------------------------------------
** Please LIKE 👍, FOLLOW ✅, SHARE 🙌 and COMMENT ✍ if you enjoy this idea! Also share your ideas and charts in the comments section below! This is best way to keep it relevant, support us, keep the content here free and allow the idea to reach as many people as possible. **
-------------------------------------------------------------------------------
💸💸💸💸💸💸
👇 👇 👇 👇 👇 👇

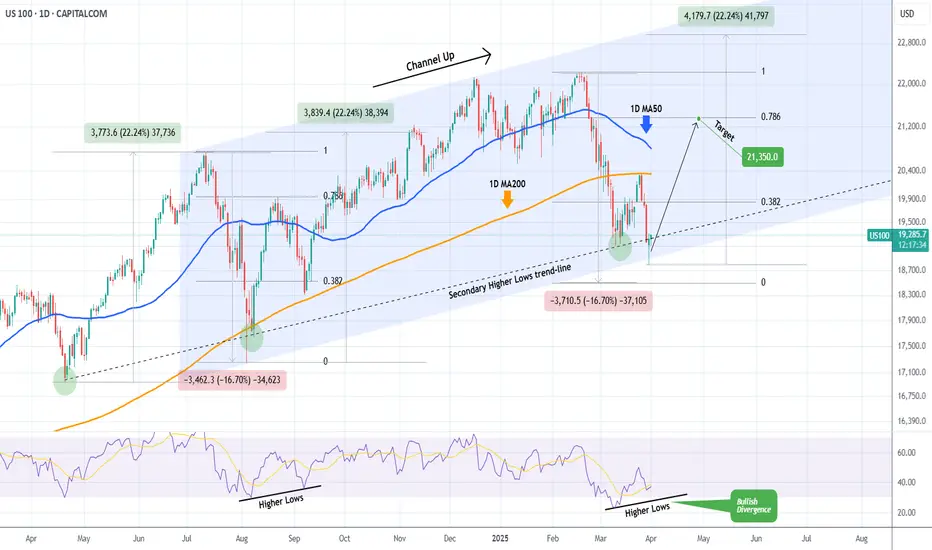
NASDAQ Huge Bullish Divergence points to 21350 inside April.Nasdaq (NDX) has been trading within a Channel Up pattern since the July 11 2024 High. The latest rally that started on March 11 2025 after a brutal 3-week downtrend/ Bearish Leg, got rejected on the 1D MA200 (orange trend-line) as the market digested the disappointing PCE.
Despite this aggressive rejection, the price hit and rebounded yesterday exactly at the bottom of the Channel Up with the previous such contact going back to the August 05 2024 Low. Not to mention that both the March 11 2025 and August 08 2024 Lows were formed exactly on the secondary Higher Lows trend-line.
What's perhaps more critical than any of these though, is that the 1D RSI didn't make a new Low last week and remains above the oversold barrier on a Higher Low trend-line that is a huge technical Bullish Divergence against the price's Lower Lows.
As with the August 22 2024 High, our first short-term Target is on the 0.786 Fibonacci retracement level at 21350.
-------------------------------------------------------------------------------
** Please LIKE 👍, FOLLOW ✅, SHARE 🙌 and COMMENT ✍ if you enjoy this idea! Also share your ideas and charts in the comments section below! This is best way to keep it relevant, support us, keep the content here free and allow the idea to reach as many people as possible. **
-------------------------------------------------------------------------------
💸💸💸💸💸💸
👇 👇 👇 👇 👇 👇