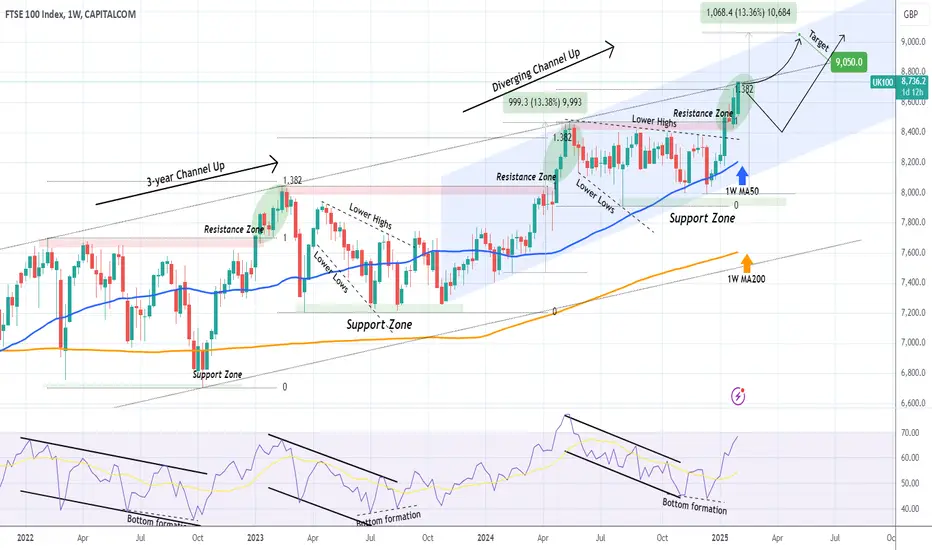
FTSE 100 Target reached. How to trade next.Only a month ago (January 03, see chart below) we gave a strong buy signal on FTSE 100 (UK100) right after it bottomed on its 1W MA50 (blue trend-line):
As you see, the subsequent rebound hit our 8650 Target even quicker than we expected and the price now sits exactly at the top (Higher Highs trend-line) of the 3-year Channel Up.
We will now proceed with the standard break-out or rejection strategy based on candle closing. If the index closes a 1W candle above the 3-year Channel Up, buy and target 9050 by May, which translates to a +13.40% rise from the Higher Low (December 16 2024) of the diverging (blue) Channel Up, similar to its first Bullish Leg.
As long as the index doesn't close a 1W candle above the 3-year Channel Up, our next buy opportunity will be on the 1W MA50 (blue trend-line) again, a fair technical correction/ Bearish Leg. Again the Target will be 9050.
-------------------------------------------------------------------------------
** Please LIKE 👍, FOLLOW ✅, SHARE 🙌 and COMMENT ✍ if you enjoy this idea! Also share your ideas and charts in the comments section below! This is best way to keep it relevant, support us, keep the content here free and allow the idea to reach as many people as possible. **
-------------------------------------------------------------------------------
💸💸💸💸💸💸
👇 👇 👇 👇 👇 👇
Stockindexsignals
DOW JONES Can the 1D MA50 save the day once more?Dow Jones (DJIA) has been trading within a year long Channel Up and this week's pull-back has so far found Support just above the 1D MA50 (red trend-line). As this chart shows, every 1D MA50 contact that was made after a Channel Up bottom (Higher Low), was a buy opportunity as the blue arc patterns highlight.
The green arcs are the Channel bottoms and technically the strongest buy opportunities and in the past 10 months we've only had 3 of those. This is the 4th blue arc however, the medium-term buy opportunity.
Regardless of colour, the 4H RSI pattern on each of those buy opportunities, has been the same. And the resulting rally has either hit the 1.5 Fibonacci extension or made a +8.33% rise.
This time the 1.5 Fib is a bit closer to the price, so that will be our medium-term Target at 46750.
-------------------------------------------------------------------------------
** Please LIKE 👍, FOLLOW ✅, SHARE 🙌 and COMMENT ✍ if you enjoy this idea! Also share your ideas and charts in the comments section below! This is best way to keep it relevant, support us, keep the content here free and allow the idea to reach as many people as possible. **
-------------------------------------------------------------------------------
💸💸💸💸💸💸
👇 👇 👇 👇 👇 👇
S&P500 4H Bullish Cross signals rally to 6200.The S&P500 index (SPX) has been consolidating within a Rectangle pattern, which is coming out a MA100/200 Bullish Cross on the 4H time-frame. The identical consoliation phase of July - August 2024 bottomed right after such Bullish Cross and then rebounded towards the 1.382 Fibonacci extension level before pulling back to the 4H MA100 (green trend-line) again.
With the 1D MACD about to confirm the bottom with a Bearish Cross similar to September 04 2024, we expect a strong rally to start by the end of the week and target 6200 (just below the 1.382 Fibonacci extension).
-------------------------------------------------------------------------------
** Please LIKE 👍, FOLLOW ✅, SHARE 🙌 and COMMENT ✍ if you enjoy this idea! Also share your ideas and charts in the comments section below! This is best way to keep it relevant, support us, keep the content here free and allow the idea to reach as many people as possible. **
-------------------------------------------------------------------------------
Disclosure: I am part of Trade Nation's Influencer program and receive a monthly fee for using their TradingView charts in my analysis.
💸💸💸💸💸💸
👇 👇 👇 👇 👇 👇

NASDAQ 1D MA100 held. Strong rally ahead.Last week we took a look at Nasdaq's (NDX) Triangle and the buy signal that emerged on the short-term Support Zone (see chart below):
The signal turned out to be successful and the price eventually hit our 21800 Target and got rejected again on the Lower Highs trend-line.
Today an even stronger buy signal emerged, this time on a long term horizon as not only did the price touch the bottom (Higher Lows trend-line) of the August 2024 Channel Up but also hit the 1D MA100 (green trend-line).
This is the 3rd test of this level in 2 weeks and the 3rd hold. Technically this is a Triple Bottom formation and one of the strongest buy signals. Two times already within this Channel Up we have seen Bullish Legs of +15.70%. As a result we can technically target 23700.
-------------------------------------------------------------------------------
** Please LIKE 👍, FOLLOW ✅, SHARE 🙌 and COMMENT ✍ if you enjoy this idea! Also share your ideas and charts in the comments section below! This is best way to keep it relevant, support us, keep the content here free and allow the idea to reach as many people as possible. **
-------------------------------------------------------------------------------
💸💸💸💸💸💸
👇 👇 👇 👇 👇 👇

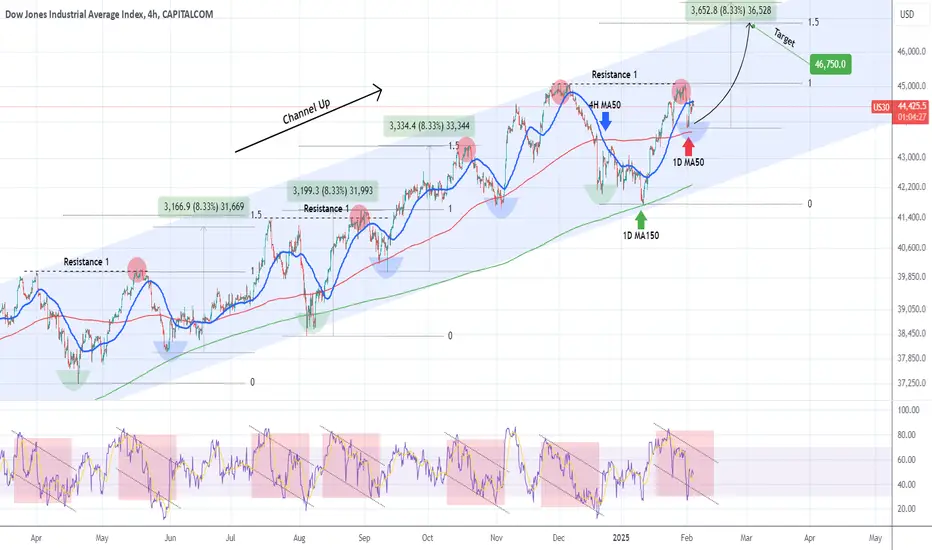
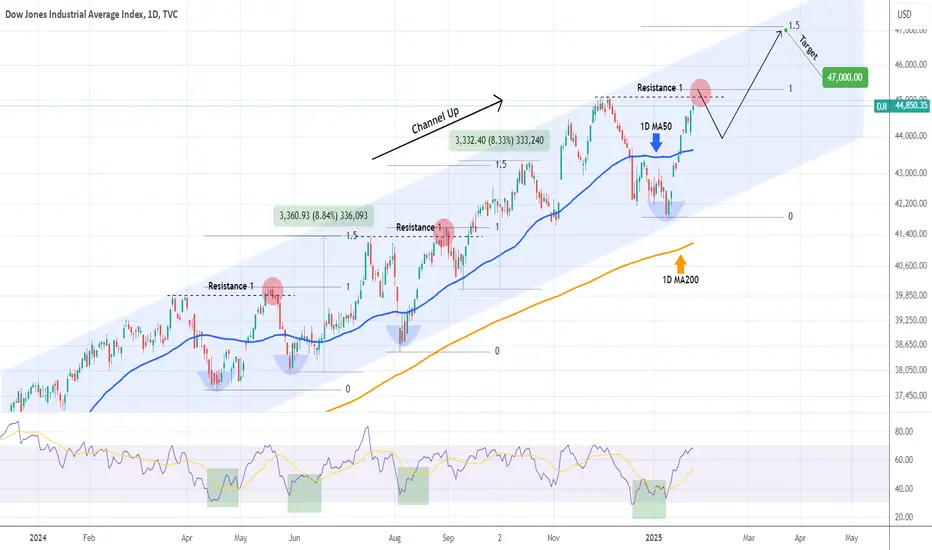
DOW JONES close to a rejection. See where to buy & target 47000.Dow Jones (DJI) gave us the most optimal buy entry on our previous call (January 09 2025, see chart below), as we bought right below the 4H MA200, which was the bottom of the 1-year Channel Up, and on minimum risk it hit our 45000 Target:
The price is currently about to break above Resistance 1. As this chart shows, every time a sub-1D MA50 (blue trend-line) rebound broke above a Resistance 1 level, it was only on a marginal note and then corrected back to the 1D MA50.
The two notable examples where August 30 2024 and May 20 2024. After the correction bottomed and the bullish trend was resumed, the rebound that followed reached the 1.5 Fibonacci extension, making a roughly +8.50% rise from the Low.
This indicates that the next Higher High of the Channel Up should be a little over 47000 and that will be our Target after we catch that 1D MA50 pull-back entry.
-------------------------------------------------------------------------------
** Please LIKE 👍, FOLLOW ✅, SHARE 🙌 and COMMENT ✍ if you enjoy this idea! Also share your ideas and charts in the comments section below! This is best way to keep it relevant, support us, keep the content here free and allow the idea to reach as many people as possible. **
-------------------------------------------------------------------------------
💸💸💸💸💸💸
👇 👇 👇 👇 👇 👇
S&P500 Yesterday's crash has confirmed +9.20% rebound.The S&P500 index (SPX) rebounded strongly back to its 4H MA50 (blue trend-line), following yesterday's flash crash and recovered most than 50% of last week's Highs. The rebound took place exactly on the former Lower Highs trend-line of December's correction.
This correction was the technical Bearish Leg of the post August 05 2024 Channel Up and the rebound on it indicates that the market has turned it from Resistance to Support. Similar Lower Highs trend-lines were formed during the last two major corrections (July and April 2024) and the common feature on all (including the current one) is that a 4H Golden Cross was formed immediately after the break-out.
What followed after the Golden Cross was one last pull-back before a +9.20% rise. Yesterday's crash is most likely that pull-back. As a result, we should now be expecting a new +9.20% rise on the medium-term, with our Target being 6450.
-------------------------------------------------------------------------------
** Please LIKE 👍, FOLLOW ✅, SHARE 🙌 and COMMENT ✍ if you enjoy this idea! Also share your ideas and charts in the comments section below! This is best way to keep it relevant, support us, keep the content here free and allow the idea to reach as many people as possible. **
-------------------------------------------------------------------------------
💸💸💸💸💸💸
👇 👇 👇 👇 👇 👇

NASDAQ Triple buy signal.Nasdaq (NDX) is having a very aggressive correction early into the week, mostly due to Chinese start-up DeepSeek. Fundamentals aside, this move has taken the index back to its 1-month Support Zone, which has given an excellent buy entry 3 times already.
At the same time, it has come the closest to the Higher Lows trend-line that has been in effect since October 01 2024, while the 4H RSI entered its oversold (<30.00) Support Zone, which in the past 3 months has offered the 5 most optimal buy opportunities.
This is in our opinion a Triple Buy Signal on the short-term, which should test at least the Lower Highs trend-line at 21800, before patterns on the wider, longer term time-frames take over.
-------------------------------------------------------------------------------
** Please LIKE 👍, FOLLOW ✅, SHARE 🙌 and COMMENT ✍ if you enjoy this idea! Also share your ideas and charts in the comments section below! This is best way to keep it relevant, support us, keep the content here free and allow the idea to reach as many people as possible. **
-------------------------------------------------------------------------------
💸💸💸💸💸💸
👇 👇 👇 👇 👇 👇

DOW has a full Bull year ahead based on PRESIDENT'S CHEATSHEETDow Jones (DJI) has started the year on a positive note and that is anything but a coincidence. On this 1W chart you can see Dow's price action since the early 2009 bottom of the U.S. Housing Crisis.
That happened to be Obama's 1st year of Presidency. As you can see, 2009 was an incredibly bullish year with the index rising more than +60% from the year's bottom.
Four years later in 2013, which was the 1st year of Obama's 2nd term in office, Dow had again a strong year, rising by +25% (naturally the previous term was more aggressive as the market had tremendous upside potential to recover from one of the worst economic crises in history).
Moving forward again 4 years (2017), we can see yet another bullish (+35%) 1st year of Presidency, this time Trump's first term.
Biden also had his fair share of bullish 1st year of Presidency in 2021 (+23%).
The pattern is evident and shows the euphoria the market has when the U.S. President assumes his duties on his 1st year. It also shows that (excluding as mentioned 2009, which was natural to see a stronger recovery) on average it is fair to expect a price increase during the 1st year of around +25% to +30%.
In fact, the price action that led to the current 1st year of Presidency that has just started (Trump's 2nd term), is very similar to the one that preceded Obama's 2nd term (2013). Both formed a Channel Up after the 1W MA200 (orange trend-line) was tested and held. That pattern pushed the price higher until the 1st year of Presidency, that found the index on the 1W MA50 (blue trend-line). Even the 1W MACD sequences that preceded this, are similar between the two fractals.
As a result, investors have a strong reason to be bullish in 2025 and if pattern achieves the bear minimum of 2021 (+23%), we can expect to see 51000 by the end of the year.
-------------------------------------------------------------------------------
** Please LIKE 👍, FOLLOW ✅, SHARE 🙌 and COMMENT ✍ if you enjoy this idea! Also share your ideas and charts in the comments section below! This is best way to keep it relevant, support us, keep the content here free and allow the idea to reach as many people as possible. **
-------------------------------------------------------------------------------
💸💸💸💸💸💸
👇 👇 👇 👇 👇 👇

S&P500 smashed every Resistance on its way to 6350.The S&P500 index (SPX) hit and rebounded today on the 1D MA50 (blue trend-line), following last week's break-out. This is the confirmed start of the technical Bullish Leg of the 6-month Channel Up along with the 1D MACD Bullish Cross.
Having made a Higher Low on the 1D MA100 (green trend-line) last Monday (January 13), we are expecting the standard 1.786 Fibonacci extension as the next Higher High of the pattern. That gives us a 6350 Target.
-------------------------------------------------------------------------------
** Please LIKE 👍, FOLLOW ✅, SHARE 🙌 and COMMENT ✍ if you enjoy this idea! Also share your ideas and charts in the comments section below! This is best way to keep it relevant, support us, keep the content here free and allow the idea to reach as many people as possible. **
-------------------------------------------------------------------------------
💸💸💸💸💸💸
👇 👇 👇 👇 👇 👇

RUSSELL 2000 One last Resistance remains before mega rally.Russell 2000 (RUT) gave us an excellent buy signal on our last analysis (October 22 2024, see chart below) exactly on the 1D MA50 and within 5 weeks it hit our 2465 Target:
The price almost immediately pulled back, showing the efficiency of our Target placement and the pattern that has now prevailed is the Channel Up that started more than a year ago (October 27 2023).
The recent Higher Low of this pattern was exactly on the 1D MA200 (orange trend-line), the pattern's bottom. The 1D RSI showcased a Bullish Divergence (Higher Lows) against the price's Lower Lows as an early buy signal, which was confirmed on the January 14 2024 1D MACD Bullish Cross. As you can see, all Bullish Crosses below a 0.0 MACD, have been technical buy signals.
What remains is for the price to break above the 1D MA50 (blue trend-line), which is the level that is causing a rejection today. Once recovered, we expect the index to complete at least a +21% rally from the recent bottom, the minimum of the previous 3 rallies, and target 2600.
-------------------------------------------------------------------------------
** Please LIKE 👍, FOLLOW ✅, SHARE 🙌 and COMMENT ✍ if you enjoy this idea! Also share your ideas and charts in the comments section below! This is best way to keep it relevant, support us, keep the content here free and allow the idea to reach as many people as possible. **
-------------------------------------------------------------------------------
💸💸💸💸💸💸
👇 👇 👇 👇 👇 👇

NASDAQ Major Lower Highs break-out just took place!Nasdaq (NDX) broke on Friday above the Lower Highs trend-line that started more than a month ago on the December 16 2024 High that initiated the recent correction. This has technically been a Bearish Leg within the +2 year Channel Up and every time such a structure broke above its Lower Highs trend-line, a strong rally followed.
At the same time, the 1D MACD just completed a Bullish Cross below the 0.0 neutral level and out of the 9 previous time this took place, it only failed to produce an immediate rally 2 times.
We technically see that the current Bullish Leg that started on the August 05 2024 Low, isn't over yet, so we still expect it to complete a +47% to +48% rise before a stronger correction. As a result, our Target is 25000.
-------------------------------------------------------------------------------
** Please LIKE 👍, FOLLOW ✅, SHARE 🙌 and COMMENT ✍ if you enjoy this idea! Also share your ideas and charts in the comments section below! This is best way to keep it relevant, support us, keep the content here free and allow the idea to reach as many people as possible. **
-------------------------------------------------------------------------------
💸💸💸💸💸💸
👇 👇 👇 👇 👇 👇

S&P500 This is why 2025 will be Bullish.The S&P500 index (SPX) just hit its 1W MA25 (red trend-line) for the first time since the August 05 2024 Low (5 months ago). This is a major long-term Support trend-line, the first one out of a total three.
As you can see on this chart, the index has been trading within a Channel Up on the log scale ever since the bottom of the 2008/09 Housing Crisis. During this pattern, it has gone through phases of strong and extended Bull where the 1W MA25 and 1W MA50 (blue trend-line) offers the Support Zone and every test is a buy opportunity and when those break, the Bear phase starts, which finds Support on the 1W MA200 (orange trend-line), with the exception being of course the non-technical, once in 100 years event of the March 2020 COVID flash crash.
It is now the 1W MA25 that comes as the first major Support level and with the 1W RSI forming the same kind of Channel Down divergence as early 2014, we expect further extension of the current Bull Phase into 2025.
In fact, every Bull Cycle has either increased by roughly +100% or +62% and since the current one is way over +62%, it is fair to expect that it will pursue the +100% mark. That is currently exactly at 7000 and could be achieved by the end of 2025 as every previous Cycle Top was priced towards the end its year with a frequency of either 3 or 4 years.
-------------------------------------------------------------------------------
** Please LIKE 👍, FOLLOW ✅, SHARE 🙌 and COMMENT ✍ if you enjoy this idea! Also share your ideas and charts in the comments section below! This is best way to keep it relevant, support us, keep the content here free and allow the idea to reach as many people as possible. **
-------------------------------------------------------------------------------
💸💸💸💸💸💸
👇 👇 👇 👇 👇 👇

NASDAQ One more low to go.Nasdaq (NDX) has been trading within a short-term Channel Down since the December 16 2024 High. So far it has made two Lows and each one bottomed after the 4H RSI made Double Bottom as seen on the chart.
Right now the 4H RSI just turned oversold below 30.00, so technically we still have room for one last Low before we see a rebound. We expect the next Bullish Leg to target at least 21300, which is marginally below the 0.786 Fibonacci retracement, the level that formed the previous two Lower Highs of the Channel Down.
-------------------------------------------------------------------------------
** Please LIKE 👍, FOLLOW ✅, SHARE 🙌 and COMMENT ✍ if you enjoy this idea! Also share your ideas and charts in the comments section below! This is best way to keep it relevant, support us, keep the content here free and allow the idea to reach as many people as possible. **
-------------------------------------------------------------------------------
💸💸💸💸💸💸
👇 👇 👇 👇 👇 👇

NIFTY Best buy opportunity before +20% rise.The Nifty 50 Index (NIFTY) has been trading within a Channel Up every since the June 2022 market bottom of the Inflation Crisis. Last week it broke below its 1W MA50 (blue trend-line) for the first time since March 27 2023 and this week touched the bottom of the Channel Up.
As long as it closes the 1W candle inside the Channel Up, the trend will technically remain bullish. The standard rally of the previous Bullish Legs has been +20%. As a result, we can remain bullish for now and target 27500 (just below the +20% mark).
If it closes a week below the Channel Up, we may very well see further technical correction until it either hits the 1W MA100 (green trend-line) or the 1W RSI gets bearish below 40.00 towards the bottom of its 3-year Rectangle.
-------------------------------------------------------------------------------
** Please LIKE 👍, FOLLOW ✅, SHARE 🙌 and COMMENT ✍ if you enjoy this idea! Also share your ideas and charts in the comments section below! This is best way to keep it relevant, support us, keep the content here free and allow the idea to reach as many people as possible. **
-------------------------------------------------------------------------------
💸💸💸💸💸💸
👇 👇 👇 👇 👇 👇

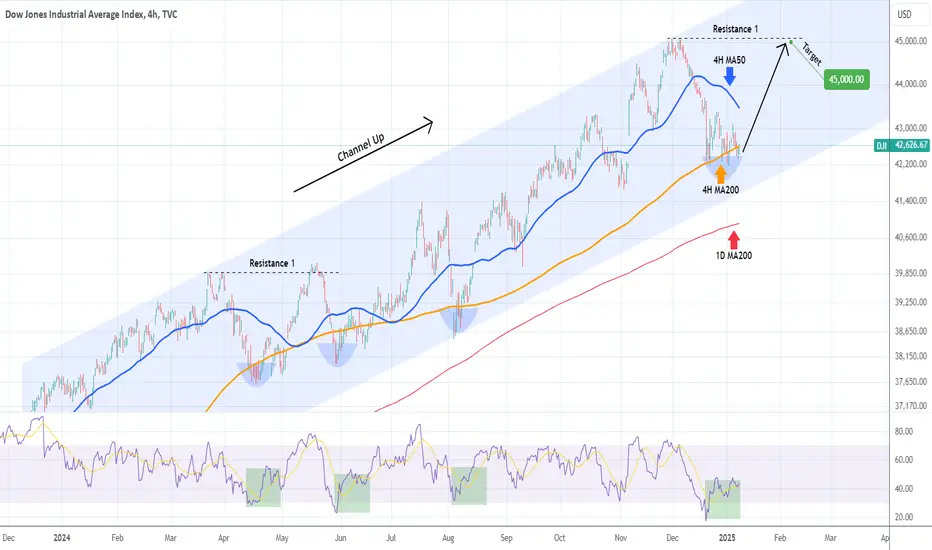
DOW JONES The RSI shows the bottom is in.Dow Jones (DJI) has been trading within a 1-year Channel Up and is on a Bearish Leg since the December 05 2024 High. The price has found support so far 4 times on the 4H MA200 (orange trend-line) and is consolidating.
This is most likely a bottom formation as the 4H RSI is posting a Bullish Divergence similar to the 3 previous times in 2024 when the price broke below the 4H MA200. Technically once the 4H MA50 (blue trend-line) breaks, we should a confirmed Bullish Leg, which is what happened on all 3 occasions.
The minimum Target is Resistance 1 at 45000. Note that as long as the 1D MA200 (red trend-line) holds, the bullish trend will continue to be favored.
-------------------------------------------------------------------------------
** Please LIKE 👍, FOLLOW ✅, SHARE 🙌 and COMMENT ✍ if you enjoy this idea! Also share your ideas and charts in the comments section below! This is best way to keep it relevant, support us, keep the content here free and allow the idea to reach as many people as possible. **
-------------------------------------------------------------------------------
💸💸💸💸💸💸
👇 👇 👇 👇 👇 👇
S&P500 no major pullbacks expected in 2025. Year-end Target 7200The S&P500 (SPX) has started the first week of the new year (2025) on a positive note following a red December. In fact December was only the 3rd red month of the whole 2024. Based on its 16-year Channel Up pattern, this bullish trend isn't expected to slowdown in 2025.
In fact, no major pull-backs are expected this year, as the end sequence of 2024 resembles the August 2013, which led to a very bullish 18-month period after.
As you can see, the start of the Channel Up, which was the bottom of the 2008 - 2009 U.S. Housing Crisis followed the same stages as the pattern after the March 2020 COVID bottom. The bottoms have been stage (a) with (b) being the first short-term pull-back and (c) the second, which was also a 1M MA50 (blue trend-line) test. It appears that we are currently on stage (d), where as explained led the way to a bullish 18-month period.
The peak of the early Channel Up pattern was on the 2.786 Fibonacci extension from the stage (c) bottom and the 18-month period ended on the 1.382 time Fib extension. If we take the same measurements on the post COVID pattern, the 1.382 time Fib extension lands on October 2026. For 2025 alone we can expect a +23.73% rise from the last red candle of (d), if the post August 2013 12-month pattern is followed, which gives us an end-of-year (2025) Target of 7200.
-------------------------------------------------------------------------------
** Please LIKE 👍, FOLLOW ✅, SHARE 🙌 and COMMENT ✍ if you enjoy this idea! Also share your ideas and charts in the comments section below! This is best way to keep it relevant, support us, keep the content here free and allow the idea to reach as many people as possible. **
-------------------------------------------------------------------------------
💸💸💸💸💸💸
👇 👇 👇 👇 👇 👇

NASDAQ rebounding strongly on its 1D MA50. 1 month rally ahead.Nasdaq (NDX) has been trading within a 4-month Channel Up and hit last Tuesday its 1D MA50 (blue trend-line) exactly on the Channel's bottom. Even though it marginally broke it, the 1D candle closed exactly on the 1D MA50, causing a strong bullish Friday reaction.
As today opened equally green, we technically view this sequence as the start of the new Bullish Leg of the pattern, which may be confirmed today if the 1D RSI breaks above its MA (yellow trend-line), as both previous Bullish Legs did.
Our Target is 22600, which represents a +9.00% rise, the minimum a Bullish Leg had within this Channel Up.
-------------------------------------------------------------------------------
** Please LIKE 👍, FOLLOW ✅, SHARE 🙌 and COMMENT ✍ if you enjoy this idea! Also share your ideas and charts in the comments section below! This is best way to keep it relevant, support us, keep the content here free and allow the idea to reach as many people as possible. **
-------------------------------------------------------------------------------
💸💸💸💸💸💸
👇 👇 👇 👇 👇 👇

FTSE 100 bottom formed. Target for Summer 2025 set.FTSE 100 (UK100) is currently on a strong rebound after a mid-December hit-and-hold on the 1W MA50 (blue trend-line). That was a Double Bottom along with the November 11 2024 1W candle Low. At the same time, this rebound is taking place after a test of the 13-month Higher Lows Zone.
In fact, that Zone started during the previous bottom formation on October 23 2023, shortly after the 1W RSI formed a Higher Lows Bullish Divergence. This time the 1W RSI is on Lower Lows but since the 2024 and 2023 fractals are very similar and the 1W MA50 is holding, we expect the bottom to be already priced in.
As you can see, both previous macro Bullish Legs of FTSE's 2-year Channel Up, targeted the 1.382 Fibonacci extension once the previous High (Resistance Zone) broke. As a result, we are now setting 8650 as a Q2 2025 Target.
-------------------------------------------------------------------------------
** Please LIKE 👍, FOLLOW ✅, SHARE 🙌 and COMMENT ✍ if you enjoy this idea! Also share your ideas and charts in the comments section below! This is best way to keep it relevant, support us, keep the content here free and allow the idea to reach as many people as possible. **
-------------------------------------------------------------------------------
💸💸💸💸💸💸
👇 👇 👇 👇 👇 👇

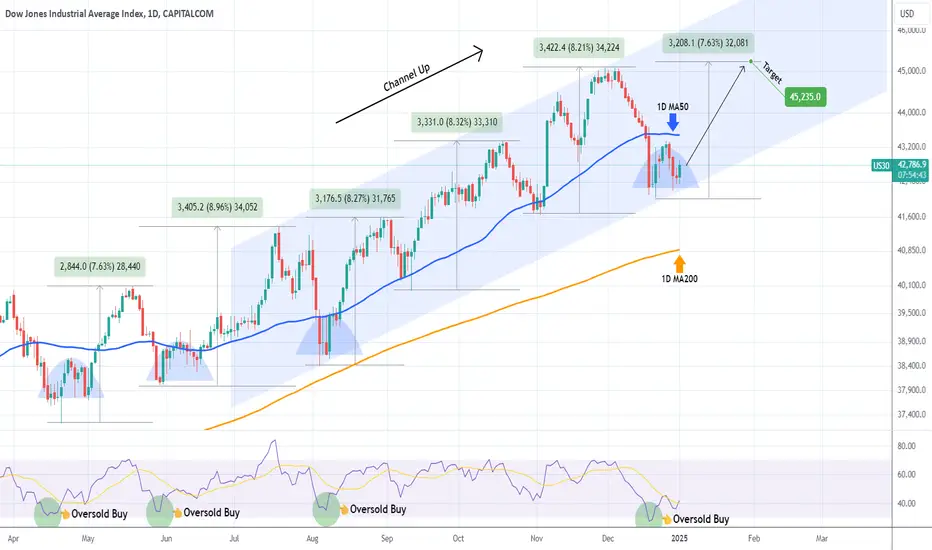
DOW JONES Bullish accumulation below the 1D MA50.Dow Jones (DJI) has been trading within a Channel Up since the July 18 High. Right now the price is consolidating between its bottom (Higher Lows trend-line) and the 1D MA50 (blue trend-line). At the same time, the 1D RSI breached the oversold barrier (30.00) and rebounded.
This trading sequence has presented the most efficient buy opportunity since April 19 2024 and the even though all Bullish Legs that followed have been a little over +8.00%, the weakest one has been +7.63%. As a result, our current Bullish Leg Target of 45235 is formulated out of that minimum.
-------------------------------------------------------------------------------
** Please LIKE 👍, FOLLOW ✅, SHARE 🙌 and COMMENT ✍ if you enjoy this idea! Also share your ideas and charts in the comments section below! This is best way to keep it relevant, support us, keep the content here free and allow the idea to reach as many people as possible. **
-------------------------------------------------------------------------------
💸💸💸💸💸💸
👇 👇 👇 👇 👇 👇
S&P500 First 4H Death Cross in 5 months! Is it bearish indeed?The S&P500 index (SPX) is on a decline since Thursday and despite the thin holiday volume and less trading days, is a sign of weakness on the short-term. Especially having completed a Death Cross on the 4H time-frame on December 24.
In fact, this is the first 4H Death Cross in 5 months (since July 29). During that sequence, the index was under heavy seasonal selling pressure but initially rose following the Death Cross. Soon after though it collapsed lower on bad macroeconomics.
This time however, the trend turned bearish immediately after the Death Cross. The buy signal in August was the Aug 05 4H RSI Double Bottom. This time, the RSI has already started rising since yesterday.
In our opinion, this suggests that the selling pressure by the 4H Death Cross is most likely over and we can technically see the new Bullish Leg of the 3-month Channel Up.
The most common % rise these past few months has been +7.19%. If we count that from the recent December 20 Low, then we should be expecting a 6200 Target by late January - early February.
-------------------------------------------------------------------------------
** Please LIKE 👍, FOLLOW ✅, SHARE 🙌 and COMMENT ✍ if you enjoy this idea! Also share your ideas and charts in the comments section below! This is best way to keep it relevant, support us, keep the content here free and allow the idea to reach as many people as possible. **
-------------------------------------------------------------------------------
💸💸💸💸💸💸
👇 👇 👇 👇 👇 👇

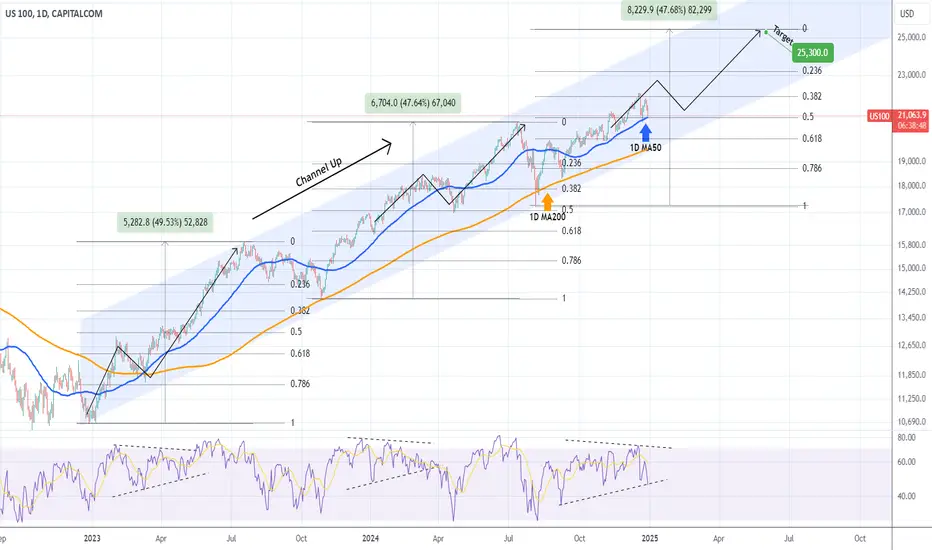
NASDAQ headed into a volatile January but uptrend remains intactNasdaq (NDX) is yet again testing the 1D MA50 (blue trend-line) following the direct hit of December 20. Despite the pull-back, it is technically respecting the 2-year Channel Up that it's been trading in since the December 26 2022 market bottom. Its most recent Higher Low was on the August 05 2024 1W candle, which initiated the Bullish Leg we're currently in.
Until we get a 1W candle closing below the 1D MA200 (orange trend-line), the pattern remains intact and the strategy is to continue buying into the current Bullish Leg. The previous two Bullish Legs had one main pull-back/ correction sequence each and apart from that, the majority of the Leg was technically a straight uptrend. Given that the current Bullish Leg has been trading above its 1D MA50 since September 12, it is not unlikely to see a correction below it.
Technically, it could be similar to the previous Bullish Leg (March 04 - April 15 2024), as we are trading within the 0.382 - 0.5 Fibonacci range. This means that one more rise above the 0.382 Fib is to be expected in the first week of January but it is likely to then see a correction for the rest of the month below the 1D MA50 into the first 2 weeks of February.
If after that, the 0.5 Fib and 1D MA200 levels hold, we expect the Bullish Leg to resume the uptrend and target 25300. That would be a rise of around +48%, which is the % rise of both previous Bullish Legs.
-------------------------------------------------------------------------------
** Please LIKE 👍, FOLLOW ✅, SHARE 🙌 and COMMENT ✍ if you enjoy this idea! Also share your ideas and charts in the comments section below! This is best way to keep it relevant, support us, keep the content here free and allow the idea to reach as many people as possible. **
-------------------------------------------------------------------------------
💸💸💸💸💸💸
👇 👇 👇 👇 👇 👇
S&P500 The new Bullish Leg has begun.The S&P500 index (SPX) has completed 4 straight green 1D candles, and is already trading above its 1D MA50 (blue trend-line) again. With its 1D RSI also reaching its MA (yellow trend-line), we view last Friday's candle as the new Higher Low at the bottom of the 4-month Channel Up.
This pattern is so far highly symmetrical with each of the 2 completed Legs so far, following an a-b-c-d structure. Right now we are on step (a) that is the start of the Bullish Leg. Based on this model, we are expected to approach the top (Higher Highs trend-line) of the Channel Up on step (b) then make the mid-Leg pull-back to (c) and then resume the uptrend for the Bullish Leg's top on (d).
We expect that to be on at least 6300, which is marginally below the 1.786 Fibonacci extension, being the minimum level that each of the previous 2 Bullish Legs hit.
-------------------------------------------------------------------------------
** Please LIKE 👍, FOLLOW ✅, SHARE 🙌 and COMMENT ✍ if you enjoy this idea! Also share your ideas and charts in the comments section below! This is best way to keep it relevant, support us, keep the content here free and allow the idea to reach as many people as possible. **
-------------------------------------------------------------------------------
💸💸💸💸💸💸
👇 👇 👇 👇 👇 👇

DOW JONES What signals the top of this Cycle?Dow Jones (DJI) has been on a highly systematic pattern ever since the 2009 bottom of the U.S. Housing Crisis and this chart on the 3W time-frame depicts very accurately the symmetrical nature of the Cycles that the index is going through in the past 15 years.
As you see, ever since the October 2011 bounce on both the 3W MA50 (blue trend-line) and 3W MA200 (orange trend-line), Dow started a hyper aggressive Bull Cycle, which after making a Top on each phase, it broke below the 3W MA50 to become a buy opportunity again but has never yet broken below the 3W MA200.
So far we have completed three such phases and we are currently on the 4th. In the three that have already been completed, the Top of the Phase was signaled by the RSI. At a certain point that it broke above the 70.00 overbought barrier, it started a Channel Down comprised of 4 legs (a through d). On the (d) leg, it gave a signal that Dow had (or is very close to) topped. That was the ultimate long-term Sell Signal. Similarly, when the index broke below its MA50 and the RSI double bottomed, it has been the ultimate signal to buy.
Right now it appears that the RSI has completed Leg (a) and is starting the rise to Leg (b) of its newly emerged Channel Down. That means that the market has around another 12 months before it Tops again.
-------------------------------------------------------------------------------
** Please LIKE 👍, FOLLOW ✅, SHARE 🙌 and COMMENT ✍ if you enjoy this idea! Also share your ideas and charts in the comments section below! This is best way to keep it relevant, support us, keep the content here free and allow the idea to reach as many people as possible. **
-------------------------------------------------------------------------------
💸💸💸💸💸💸
👇 👇 👇 👇 👇 👇
