CHINA A50 Buy signal couldn't have gone any better!Last time we looked at the China A50 index (CN50) was almost 2 months ago (September 06, see chart below) when we called for a buy opportunity:
As you can see, it couldn't have gone any better as the price rebounded exactly on our mark, hitting our 12100 Target in a matter of days.
Now the index is on a relief consolidation following this enormous rally that broke above the nearly 4-year Channel Down. Every time we had a similar bullish break-out, the market reached at least its 2.0 Fibonacci extension level. As a result, we expect to see 19500 by mid 2025.
-------------------------------------------------------------------------------
** Please LIKE 👍, FOLLOW ✅, SHARE 🙌 and COMMENT ✍ if you enjoy this idea! Also share your ideas and charts in the comments section below! This is best way to keep it relevant, support us, keep the content here free and allow the idea to reach as many people as possible. **
-------------------------------------------------------------------------------
💸💸💸💸💸💸
👇 👇 👇 👇 👇 👇
Stockindexsignals

NASDAQ Ready for an impressive finish of the year.Nasdaq (NDX) is coming off a 4H Golden Cross, the same kind if formed on November 08 2023, straight after the bottom of the 18-month Channel Up. As the 1D MA200 (red trend-line) has been in strong support of this Channel Up, the index is now on a similar Bullish Leg (blue Channel) as the one that started 1 year ago.
We are at the stage were after a roughly +20% rise from the bottom, the short-term Bullish Megaphone tested and held the 4H MA200 (orange trend-line), which based on the January 2024 fractal, could initiate the 2nd Phase of the Bullish Leg.
The previous one peaked on a +31% rise, so we expect the index to reach at lest 22000 by the end of the year.
-------------------------------------------------------------------------------
** Please LIKE 👍, FOLLOW ✅, SHARE 🙌 and COMMENT ✍ if you enjoy this idea! Also share your ideas and charts in the comments section below! This is best way to keep it relevant, support us, keep the content here free and allow the idea to reach as many people as possible. **
-------------------------------------------------------------------------------
💸💸💸💸💸💸
👇 👇 👇 👇 👇 👇

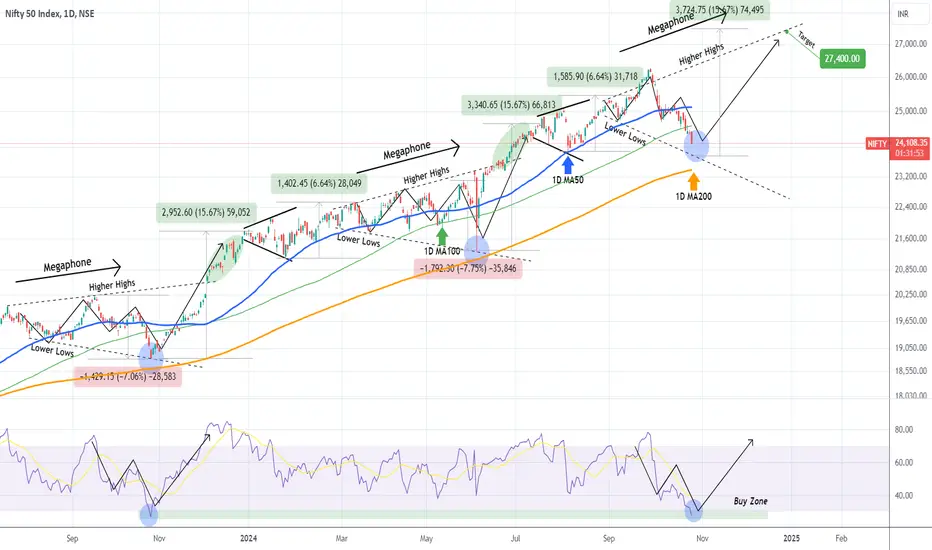
NIFTY Buy opportunity on solid cyclical patterns.We last looked into the Nifty 50 Index (NIFTY) on September 05 (see chart below), when we got an excellent buy on the 1D MA50 (blue trend-line) that quickly hit our 25700 Target:
As you can see, our trading approach was based on the recurring technical patterns (Megaphones) since July 2023. Even though the current wide price action doesn't fit the former Megaphone patters, we can still call for a bottom soon as, not only is the price approaching the 1D MA200 (orange trend-line), but also the 1D RSI is almost on the same oversold (below 30.00) level as 1 year ago (October 26 2023)!
In fact the pattern of September - October 2023 looks very similar to Sep - Oct 2024. The risk of buying here is low while the reward is high, making for a very appealing R/R ratio. As a result, we turn long again, targeting 27400 (+15.67% rise as the previous bullish break-out legs).
-------------------------------------------------------------------------------
** Please LIKE 👍, FOLLOW ✅, SHARE 🙌 and COMMENT ✍ if you enjoy this idea! Also share your ideas and charts in the comments section below! This is best way to keep it relevant, support us, keep the content here free and allow the idea to reach as many people as possible. **
-------------------------------------------------------------------------------
💸💸💸💸💸💸
👇 👇 👇 👇 👇 👇
FTSE Bullish break-out taking place. Target 8650.Almost 2 months ago (August 30, see chart below) we called for a rejection of FTSE 100 (UK100) back to the Symmetrical Support Zone (SSZ), where our next buy entry would be:
As you can see, the price action duly delivered and the price has been gradually rising off the SSZ to the point where last week it broke above the Lower Highs trend-line. The 1W RSI is also about to make a bullish break-out above its own Channel Down.
We have seen this kind of pattern during the previous two Bullish Legs since late 2022. Every time they broke above the Resistance Zone, the price peaked around the 1.382 Fibonacci extension. As a resut, our new long-term Target is 8650.
-------------------------------------------------------------------------------
** Please LIKE 👍, FOLLOW ✅, SHARE 🙌 and COMMENT ✍ if you enjoy this idea! Also share your ideas and charts in the comments section below! This is best way to keep it relevant, support us, keep the content here free and allow the idea to reach as many people as possible. **
-------------------------------------------------------------------------------
💸💸💸💸💸💸
👇 👇 👇 👇 👇 👇

S&P500 Has it topped?The S&P500 index (SPX) is ahead of critical crossroads for the short-term as the Bullish Megaphone pattern that is in effect since April 01, is showing strong signs of topping.
Even though the price isn't on the top (Higher Highs trend-line) of the Megaphone, the 1D MACD formed a Bearish Cross today and practically is repeating the sequence of the index' previous Leg from April 19 to July 17, which ended also on a MACD Bearish Cross.
As you can see besides the Bearish Cross, even the price action between the two fractals has gone through very similar phases. The current Bullish Leg is in the form of a Rising Wedge.
Despite the Bearish Cross, the trend remains bullish within this pattern until the Wedge's bottom breaks. As a result, it is more likely to see at least 6000 next. If however the price breaks below the 1D MA50 (blue trend-line), we will have a confirmed sell signal at hand, based on which we will short and target 5600.
-------------------------------------------------------------------------------
** Please LIKE 👍, FOLLOW ✅, SHARE 🙌 and COMMENT ✍ if you enjoy this idea! Also share your ideas and charts in the comments section below! This is best way to keep it relevant, support us, keep the content here free and allow the idea to reach as many people as possible. **
-------------------------------------------------------------------------------
💸💸💸💸💸💸
👇 👇 👇 👇 👇 👇

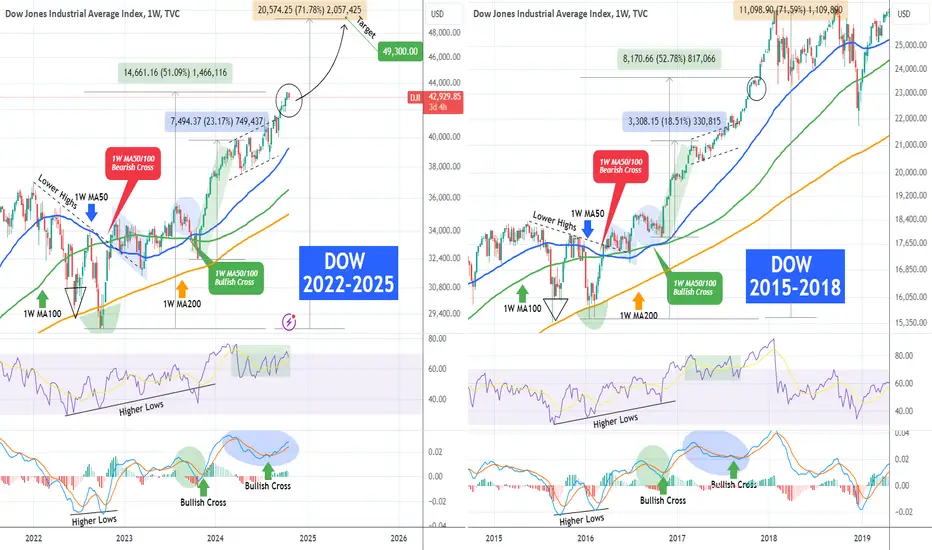
DOW JONES ahead of an huge rally based on the 2017 fractal.More than a year ago (September 13 2023, see chart below), we posted a long-term fractal comparison for Dow Jones (DJI) between the 2022 - 2025 and 2015 - 2018 periods:
As you can see the 1W MA50/100 Bullish Cross eventually placed the index on a huge rally (even though it had to go lower for a month) that hit Target 1 at 42000. The 1W RSI and MACD sequences in 2024 however evolved in such a how that we have to re-adjust the patterns in order to fit the 2017 price action.
The charts now display very symmetric fractals and it appears that we are now on a short-term consolidation (circle) after a +50% rise from the September 2022 bottom. In November 2017, that was the final consolidation before the most aggressive rally of the Bull Cycle that made Dow top and then pull back to test its 1W MA50 (blue trend-line).
As a result, we move our final target even higher at 49300, which represents a +71% rise from the 2022 bottom, similar to the rise that priced the January 2018 High.
-------------------------------------------------------------------------------
** Please LIKE 👍, FOLLOW ✅, SHARE 🙌 and COMMENT ✍ if you enjoy this idea! Also share your ideas and charts in the comments section below! This is best way to keep it relevant, support us, keep the content here free and allow the idea to reach as many people as possible. **
-------------------------------------------------------------------------------
💸💸💸💸💸💸
👇 👇 👇 👇 👇 👇
RUSSELL 2000 will finish the year in style on the All Time High.Russell 2000 (RUT) has been giving us a lot of solid signals all year as it is following a highly symmetrical Cup pattern, which delivered last time (May 09, see chart below) an excellent bottom buy trade that effectively hit our 2293 Target:
As the 1M RSI has succeeded at maintaining a sustainable trend above its MA for almost 1 year (which is highly bullish), we make the Cup pattern wider to fit the whole sequence even the start of the 2022 Bear Cycle.
The 1W MA50 (blue trend-line) continues to be the main Support, with the 1D MA50 (red trend-line) the short-term one. We expect a quick test and then rebound towards the end of the year to 2465 (Resistance 2), which is effectively the market's All Time High.
-------------------------------------------------------------------------------
** Please LIKE 👍, FOLLOW ✅, SHARE 🙌 and COMMENT ✍ if you enjoy this idea! Also share your ideas and charts in the comments section below! This is best way to keep it relevant, support us, keep the content here free and allow the idea to reach as many people as possible. **
-------------------------------------------------------------------------------
💸💸💸💸💸💸
👇 👇 👇 👇 👇 👇

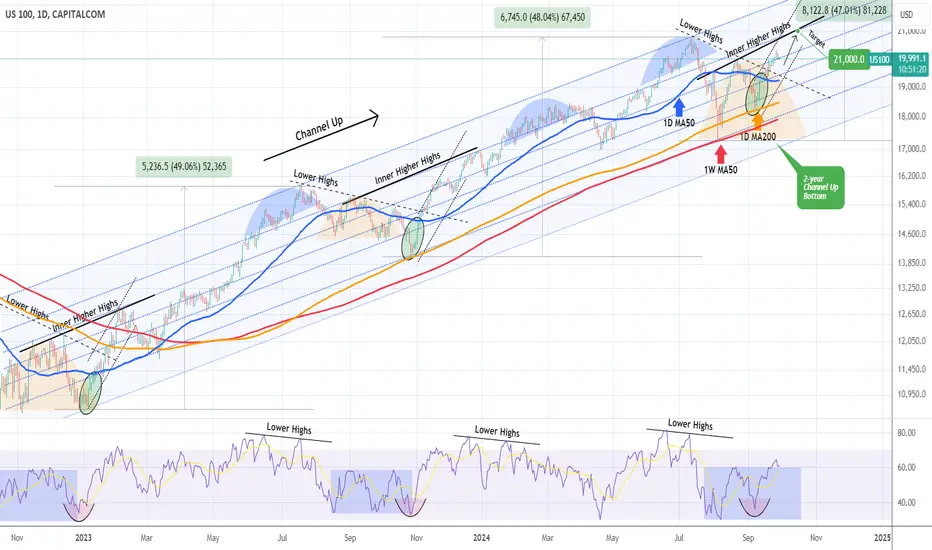
NASDAQ can explode to 25000 if the 1D MA50 keeps supporting.Nasdaq (NDX) appears to be coming off yet another short-term consolidation (ellipse pattern), the kind of accumulation it is accustomed to while trading within its 2-year Channel Up.
As we have established in previous analyses, the index is on its 3rd Bullish Leg of this pattern following the August 05 bottom (Higher Low) on the 1D MA200 (orange trend-line). When the same consolidation took place in the previous two Bullish Legs, the index remained supported by the 1D MA50 (blue trend-line) and went off to complete a rise of +49.50% and +47.80% respectively. The 1D RSI fractals of all those sequences, also display amazing symmetry.
If the rallies are on a decelerating rate, we can expect the next one to hit at least 25000 (+45.50% from the Aug bottom). As you can see, the Higher Highs of the Channel Up tend to form after the Sine Wave tops, while the bottoms are exactly on point.
-------------------------------------------------------------------------------
** Please LIKE 👍, FOLLOW ✅, SHARE 🙌 and COMMENT ✍ if you enjoy this idea! Also share your ideas and charts in the comments section below! This is best way to keep it relevant, support us, keep the content here free and allow the idea to reach as many people as possible. **
-------------------------------------------------------------------------------
💸💸💸💸💸💸
👇 👇 👇 👇 👇 👇

S&P500 If it holds this level, it can rise up to 6050.The S&P500 index (SPX) had a strong short-term pull-back yesterday, which is so far contained within the tight levels of a Channel Up pattern. The price is right at the bottom of it and if it holds, we can expect a strong rally continuation for the next 2 weeks, going into the U.S. elections.
This sequence is so far similar to the previous Channel Up patterns that emerged after the price broke above the 4H MA50 (blue trend-line). Once broken, it held right until their tops, which were after a +6.50% rise.
This is why, if this holds once more, we expect to see 6050 (+6.50% from the bottom) by the end of the month.
-------------------------------------------------------------------------------
** Please LIKE 👍, FOLLOW ✅, SHARE 🙌 and COMMENT ✍ if you enjoy this idea! Also share your ideas and charts in the comments section below! This is best way to keep it relevant, support us, keep the content here free and allow the idea to reach as many people as possible. **
-------------------------------------------------------------------------------
💸💸💸💸💸💸
👇 👇 👇 👇 👇 👇

DOW JONES 15 year cheat-sheet that can make you rich!Dow Jones (DJI) is extending what seems a relentless rally since the August 05 Low, which was the most recent short-term correction, but in reality the index has been rallying very aggressively since the October 23 2023 Low.
That was when after a 3-month correction, it found Support above the 1W MA200 (orange trend-line) and 2 weeks later it reclaimed the 1W MA50 (blue trend-line), which has been supporting ever since. So basically the index has been on a 1W MA50 Support for 1 whole year!
What's more striking however and what short-term traders/ investors tend to ignore are the long-term Cycles of a financial asset. And Dow being one, is no exception. As mentioned, the 1W MA200 supported the October 23 2023 Low and in effect has been holding since October 10 2022 (so for 2 full years!), two weeks after the Inflation Crisis bottom. Since then we have been inside a Bull Phase.
This is part of a greater trading Cycle for Dow, one that started 1 year after the March 2009 market bottom of the historic Housing Crisis. As you can see, the pattern is recurring and the phases have a high symmetry and frequency among them.
First and foremost, they tend to do two Lows within a 1 year span, which is essentially the Bear Phase, which finds Support on the 1W MA200 (exception was of course the Black Swan of the COVID flash crash but it is of course a non-technical irregularity event) and then rebounds, effectively starting the Bull Phase.
The first 2 Bull Phases rose by +75.80%, while the most recent by +70.80%, so we are roughly around the same strength levels. Also as far as duration is concerned, the 1st Bull Phase lasted for 1239 days (177 weeks), the 2nd for 1134 days (162 weeks) and the 3rd for 1106 days (158 weeks). Again the time element is quite similar. Notice also the similar pattern that the 1W MACD prints every time Dow enters the final part of the Bull Phase.
As a result, if we apply those dynamic conditions on the current Bull Phase, we can see that a minimum rise of +70.80% from the bottom, should peak a little over 48000, and if it last a minimum of 1106 days (158 weeks) it should come to an end and price the top by October 06 2025.
This indicates that we have at least another full year of bullish trend ahead of us and a fair Target could be 48000.
As you realize, investors who are methodically following this 15 year old cheat-sheet, know where and when to buy/ sell and that achieves investing's two main principles: Profit Maximization and Risk Management. Patience and proper management within such Cycles are what "can make you rich" indeed.
-------------------------------------------------------------------------------
** Please LIKE 👍, FOLLOW ✅, SHARE 🙌 and COMMENT ✍ if you enjoy this idea! Also share your ideas and charts in the comments section below! This is best way to keep it relevant, support us, keep the content here free and allow the idea to reach as many people as possible. **
-------------------------------------------------------------------------------
💸💸💸💸💸💸
👇 👇 👇 👇 👇 👇

NASDAQ Channel Up with more room to rise.Nasdaq (NDX) eventually held the 1D MA50 (blue trend-line) and no significant correction took place, a development that should extend the uptrend within the 2-month Channel Up. Technically we are still on its Bullish Leg.
We have had two rallies so far within this structure the most recent +11.00% and the one before +15.50%. Assuming there is a declining rate on those by -4.50%, we can assume that the current one will peak at +6.50% from the October 01 Low, which is ideal as it gives a 20900 short-term Target exactly at the top of the Channel Up.
-------------------------------------------------------------------------------
** Please LIKE 👍, FOLLOW ✅, SHARE 🙌 and COMMENT ✍ if you enjoy this idea! Also share your ideas and charts in the comments section below! This is best way to keep it relevant, support us, keep the content here free and allow the idea to reach as many people as possible. **
-------------------------------------------------------------------------------
💸💸💸💸💸💸
👇 👇 👇 👇 👇 👇

S&P500 Consolidation almost over. Prepare for 6300 end of year.The S&P500 index (SPX) has been consolidating for roughly the past 3 weeks, significantly above its 1D MA50 (blue trend-line), which indicates that the long-term trend is not in danger. In fact, we believe that it has already entered a Channel Up structure, similar to November 2023 - March 2024.
As you can see, in late November 2023 the index was also consolidating way above its 1D MA50 after a strong recovery from a -10.90% correction. This time the consolidation is exactly at the top of the previous High while then it was exactly below it.
The 1D CCI sequences between the two fractals show that we are on the exact same position, posting bearish divergencies on the price's consolidation.
As a result, we expect a smooth Channel Up expansion towards the end of the year (quick exception the natural volatility around the U.S. elections day) and our Target is 6300, which is the 2.0 Fibonacci extension level.
-------------------------------------------------------------------------------
** Please LIKE 👍, FOLLOW ✅, SHARE 🙌 and COMMENT ✍ if you enjoy this idea! Also share your ideas and charts in the comments section below! This is best way to keep it relevant, support us, keep the content here free and allow the idea to reach as many people as possible. **
-------------------------------------------------------------------------------
💸💸💸💸💸💸
👇 👇 👇 👇 👇 👇

DOW JONES Short-term correction or invalidation?Dow Jones (DJI) has been trading within a Channel Up ever since the August 05 bottom and right now finds itself below the 4H MA50 (blue trend-line). This is because based on the Higher Highs sequence, the pattern has topped and is potentially looking for the new Higher Low.
As long as the 42400 Resistance is holding, we will be expecting a short-term correction towards the 4H MA200 (orange trend-line), with a projected Low around 41600. Note that it will be above the 0.5 Fibonacci retracement level, where the September 11 Higher Low was priced.
If the 42400 Resistance, which we call the invalidation level for shorts, breaks first then we will take the loss on the short and turn bullish instead. The last Higher High was priced marginally above the 1.236 Fibonacci level, so that will be our Target (43200).
-------------------------------------------------------------------------------
** Please LIKE 👍, FOLLOW ✅, SHARE 🙌 and COMMENT ✍ if you enjoy this idea! Also share your ideas and charts in the comments section below! This is best way to keep it relevant, support us, keep the content here free and allow the idea to reach as many people as possible. **
-------------------------------------------------------------------------------
💸💸💸💸💸💸
👇 👇 👇 👇 👇 👇

NASDAQ critical crossroads for the short-term.Nasdaq (NDX) recovered its 4H MA50 (blue trend-line) on Friday, which is something that puts the short-term pull-back since September 26 on hold. In fact, as long as the 4H MA200 (orange trend-line) holds, the index is more likely to resume the long-term Channel Up pattern and post a similar +11.00% rebound. So for now, we remain bullish, targeting 21600 (+11.00% from the last week's low).
If on the other hand the 4H MA200 breaks, we will most likely extend the short-term correction all the way to the dotted Higher Lows trend-line. Of course in that case, the (blue) Channel Up will be invalidated, and we will take the loss on the long and sell instead, targeting 19000.
The 4H RSI is posting a Bear Flag similar to August 29 - September 02, which favors the bearish scenario.
-------------------------------------------------------------------------------
** Please LIKE 👍, FOLLOW ✅, SHARE 🙌 and COMMENT ✍ if you enjoy this idea! Also share your ideas and charts in the comments section below! This is best way to keep it relevant, support us, keep the content here free and allow the idea to reach as many people as possible. **
-------------------------------------------------------------------------------
💸💸💸💸💸💸
👇 👇 👇 👇 👇 👇

DAX This week offers a great buying opportunity.DAX (DE40) has been trading within the same Channel Up since the bottom of the Inflation Crisis on the week of October 03 2022. The recent August 05 rebound on the 1W MA200 (blue trend-line) was nothing but the start of the new Bullish Leg of the pattern, the 3rd in total.
The previous two, following their respective Bearish Legs (dotted Channel Down), they first reached a Resistance just above the previous High and after a pull-back and break-out above it, the continued for the 2nd part of the Leg.
It appears that in symmetrical terms, we are exactly there, right before the start of the 2nd phase of the Bullish Leg. Interestingly enough, the 1W MACD completed a Bullish Cross just last week (been the most solid bottom confirmation in the past Legs) so if anything, the rally could be even stronger.
In any case, keeping in mind the strict Resistance offered by the Higher Highs trend-line of the Channel Up, our target is still 20000, which is just below the 1.618 Fibonacci extension. That is the Fib level where both previous Higher Highs of the Channel Up were priced.
-------------------------------------------------------------------------------
** Please LIKE 👍, FOLLOW ✅, SHARE 🙌 and COMMENT ✍ if you enjoy this idea! Also share your ideas and charts in the comments section below! This is best way to keep it relevant, support us, keep the content here free and allow the idea to reach as many people as possible. **
-------------------------------------------------------------------------------
💸💸💸💸💸💸
👇 👇 👇 👇 👇 👇

S&P500 Fractal from 2019 points to a 6100 rally.The S&P500 (SPX) is absorbing all the negative news on the recent geopolitical unrest in the Middle East and could post its first red week after a streak of three green 1W candles. This shouldn't however make us lose our long-term perspective and a fractal from 2018 - 2020 comes to remind us why.
As you can see, the 1W RSI sequence from July 24 2023 until now, is quite similar to the one from October 01 2018 - September 30 2019. The price actions between the two fractals are also similar. Both started with a bottom on (or near) the 1W MA200 (orange trend-line) and transitioned into a Bullish Megaphone.
After the September 30 2019 Low, the index resumed the uptrend within a (green) Channel Up, which extended higher up until the COVID crash, which is of course a 1-in-100 year Black Swan event that couldn't have been predicted. If it weren't for that, the market would have at best tested the 1W MA50 (blue trend-line) for new buyers and then extended the bullish trend like it did after June 2020.
In any case, we expect a similar behavior with a bullish continuation of +25.50% from the last Low (-3% lower like the 2019 rise was from its previous Bullish Leg). This gives us an end-of-year Target around 6100.
-------------------------------------------------------------------------------
** Please LIKE 👍, FOLLOW ✅, SHARE 🙌 and COMMENT ✍ if you enjoy this idea! Also share your ideas and charts in the comments section below! This is best way to keep it relevant, support us, keep the content here free and allow the idea to reach as many people as possible. **
-------------------------------------------------------------------------------
💸💸💸💸💸💸
👇 👇 👇 👇 👇 👇

DOW JONES Pull-back possible but maintain long-term perspectiveA little more than 2 months ago (July 25, see chart below) we argued that Dow Jones' (DJI) correction wasn't over and called for a deeper buy, setting then a long-term Target of 42400:
The Target got finally hit on Friday, giving us an excellent risk/ reward ratio on our investment. As however the price almost reached the top of the 2-year Channel Up, we have to issue a warning for a potential short-term correction.
The 1D MA50 (blue trend-line) has successfully supported on September 11 last time and won't be odd to see another re-test after almost a month. The similarities after all between the first part of the 2-year Channel Up and the second (the one we're currently in) are still noticeable and on 1D RSI terms we may be symmetrically around the November 20 2023 level.
However, we may see this time the Channel Up break to the upside for the first time after the elections. Regardless of the short-term volatility, our medium-term Target as we will be heading into December is 44500. That is the 2.5 Fibonacci extension, similar to where the April 01 High was priced.
-------------------------------------------------------------------------------
** Please LIKE 👍, FOLLOW ✅, SHARE 🙌 and COMMENT ✍ if you enjoy this idea! Also share your ideas and charts in the comments section below! This is best way to keep it relevant, support us, keep the content here free and allow the idea to reach as many people as possible. **
-------------------------------------------------------------------------------
💸💸💸💸💸💸
👇 👇 👇 👇 👇 👇

NASDAQ This rally isn't over yet.Three weeks ago (September 09, see chart below) we gave a very timely buy signal on Nasdaq (NDX), just after it touched its 1D MA200 (orange trend-line):
As you can see, the index started a relentless rally, breaking the August 22 High, and the Lower Highs trend-line in the process. We don't expect that Leg to be over yet. Based on the two previous Bullish Legs of the 2-year Channel Up, they first touched the Inner Higher Highs trend-line and then pulled back to the 1D MA50 (blue trend-line).
As a result, we expect a continuation of the upside with a short-term Target around 21000 and then after mid to end of October, pull-back towards the 1D MA50 going into the U.S. elections.
-------------------------------------------------------------------------------
** Please LIKE 👍, FOLLOW ✅, SHARE 🙌 and COMMENT ✍ if you enjoy this idea! Also share your ideas and charts in the comments section below! This is best way to keep it relevant, support us, keep the content here free and allow the idea to reach as many people as possible. **
-------------------------------------------------------------------------------
💸💸💸💸💸💸
👇 👇 👇 👇 👇 👇
S&P500 This rally isn't even halfway there!Last time we plotted the S&P500 index (SPX) against the Volatility Index (VIX) was almost a year ago (November 07 2023, see chart below) and that helped as catch a more than +20% rise:
This time, the two assets who are on a negative correlation don't trade on exactly opposite patterns. The S&P500 has been trading within a Channel Up for almost 1 year (since the October 30 2023 Low), while VIX is on a (wide) range with a clear Support Zone and peaks within a 22.00 - 24.00 Resistance Zone, with the exception of the early August rise that spiked above it (recession fears).
Naturally, VIX's spikes and rejections (red circles) are SPX's bottoms and reversals (green circles). The blue circles that are bottoms for VIX inside its Support Zone are mid rally consolidations on the S&P500. This indicates that even when the Volatility bottoms and starts rising, the market is still in euphoria and it takes another half rally before it realizes that an aggressive volatility spike is coming.
This can be particularly helpful in determining how long we still have to keep buying. Based on VIX's current position (ellipse shape), we are on the consolidation phase before the Support Zone test. Which means that we aren't even halfway through SPX's Bullish Leg.
We expect that to be around mid to end of October, just before the U.S. elections to come up as a needed correction. As a result, we are expecting an end-of-year price at around 6200.
-------------------------------------------------------------------------------
** Please LIKE 👍, FOLLOW ✅, SHARE 🙌 and COMMENT ✍ if you enjoy this idea! Also share your ideas and charts in the comments section below! This is best way to keep it relevant, support us, keep the content here free and allow the idea to reach as many people as possible. **
-------------------------------------------------------------------------------
💸💸💸💸💸💸
👇 👇 👇 👇 👇 👇

DOW JONES shows no signs of slowing down.Those of you who are worried if the upcoming November U.S. Presidential Elections or medium-term pull-backs (such as those of July and April 2024 or August - October 2023), pose a threat to your investments, you have a strong reason to relax and feel safe and that is the current chart.
On this 1M time-frame analysis, we see Dow Jones (DJI) in almost the past 30 years (since late 1997) and the Cycles that have defined its Tops and Bottoms. As you can see, initially there is a clear (green) Channel Up that is always trading above the 1M MA50 (blue trend-line), leading to the eventual Top, which in turn initiates the Bear Cycle (red Arc).
The use of the Sine Waves make a great fit for the bottoms in particular. It is interesting to mention that the time period between the end of each (green) Channel Up and the start of the next one is approximately 40 months (3.3 years). Also since the 2008 Housing Crisis, we can see that a wide Channel Up has been the dominant pattern driving the expansion of Dow.
With the above information in mind, we can reach the conclusion that the index is only now entering that aggressive green Channel Up of the Bull Cycle, meaning that the Cycle is far from over and if anything, we are approaching its middle. In fact, the 3.3 year (40 month) time gap has just been completed, so there is a full Channel Up expansion ahead of us.
Now, how high can that get? Well if each Bullish Leg of the 2008 emerged Channel Up is 40% less than the previous, then we are looking for at least a +100% rise from the September 2022 bottom, giving us a rough 57000 Target on a 5-year horizon. Again that doesn't mean that we won't have medium-term pull-backs (like those mentioned in the opening paragraph) along the way, they are necessary and they reset the prices in order to attract more liquidity and investors, but on the long run you can feel comfortable holding your stocks.
-------------------------------------------------------------------------------
** Please LIKE 👍, FOLLOW ✅, SHARE 🙌 and COMMENT ✍ if you enjoy this idea! Also share your ideas and charts in the comments section below! This is best way to keep it relevant, support us, keep the content here free and allow the idea to reach as many people as possible. **
-------------------------------------------------------------------------------
💸💸💸💸💸💸
👇 👇 👇 👇 👇 👇

NASDAQ gave the best longterm bullish signal. Is 25300 possible?Nasdaq (NDX) confirmed the bounce on the 1D MA200 (orange trend-line) as argued on our previous analysis (September 09) and the rebound made the ultimate bullish break-out last week, as it crossed above the Lower Highs trend-line of the July 11 All Time High (ATH), giving us the most consistent long-term buy signal on a 2-year basis.
As you can see on this chart that goes as back as October 2022 and the bottom of the Inflation Crisis Bear Cycle, the two times that Nasdaq broke above such Lower Highs trend-line, while being above the 1D MA200, it gave the best buy signal possible, with both rallies peaking after a +49% and +48% rise respectively.
The Sine Waves have also confirmed early this month that the index bottomed and now we have the ultimate bullish break-out confirmation. The longer the 1D MA50 (blue trend-line) holds the better, but even if it breaks (April 2024), we still expect that we are on a similar Bullish Leg that should top in roughly the same way (+47% i.e. one percent less than the previous).
This gives us a long-term Target of 25300 for March - April 2025. We have plotted the Bullish Legs of 2023 and 2024 and as you can see, even though they diverge at times, they always converge again, forming a rough Channel Up, which can be a representation of our estimate course.
-------------------------------------------------------------------------------
** Please LIKE 👍, FOLLOW ✅, SHARE 🙌 and COMMENT ✍ if you enjoy this idea! Also share your ideas and charts in the comments section below! This is best way to keep it relevant, support us, keep the content here free and allow the idea to reach as many people as possible. **
-------------------------------------------------------------------------------
💸💸💸💸💸💸
👇 👇 👇 👇 👇 👇

DAX breaking above this Resistance can target 20000DAX hit yesterday Resistance 1 (the September 03 High) but got rejected and failed to close the candle above it. Naturally, the market is reacting with weakness today and so far a red 1D candle.
As you realize, the key here is to close that candle above Resistance 1, which is what happened in the middle of the previous Bullish Leg of the 1-year Channel Up. After testing the Resistance at the time on January 29 2024, the index turned sideways for a few days, until it finally closed above it and started the 2nd phase of the Bullish Leg.
All this time the 1D MA50 (blue trend-line) was supporting, just as it did recently on September 06. If those conditions are met, we expect another run towards the 1.618 Fibonacci extension (where the April 01 Higher High was priced). Our Target is slightly below it at 20000.
-------------------------------------------------------------------------------
** Please LIKE 👍, FOLLOW ✅, SHARE 🙌 and COMMENT ✍ if you enjoy this idea! Also share your ideas and charts in the comments section below! This is best way to keep it relevant, support us, keep the content here free and allow the idea to reach as many people as possible. **
-------------------------------------------------------------------------------
💸💸💸💸💸💸
👇 👇 👇 👇 👇 👇

S&P500 Powell gave what the market wanted. Rally up to mid-2025?Chair Powell went out and did it yesterday as the Fed didn't just cut the Interest Rates yesterday for the first time since March 2020, but did so by -0.50%, giving the market what it so desperately wanted. The question now on everyone's mind is this: is this what the market needed to extend the 2023 - 2024 rally?
Fundamentally of course the cuts is a strong reason and as for the technical part we will let an old analysis of ours (last updated May 16, see chart below):
As you can see, we published that at a time when there were again voices over an extended correction due to April's strong red candle. What happened instead? The S&P500 (SPX) posted 4 straight green months (not including September). Once again we present to you this chart, to help everyone maintain a healthy long-term perspective.
Wide, long-term time-frames like 1W or 1M (such as the current one) succeed at filtering out the short-term noise caused by volatility, news etc. As you can see on this chart, which we named "The Ultimate stock market cheat sheet", the index goes through very distinct market through roughly the past 20 years. More specifically, since the 2007/08 Housing Crisis, there is a very consistent pattern and the Sine Waves display perfectly that frequency.
The first observation is that there is a rough frequency when the S&P500 tops every 3.5 years. In this time-span of 42 months (3.5 years) the index either hits a High or already has and is on a minor decline before a stronger correction comes, which is always within the technical standards of pull-backs within a greater Bull Cycle expansion.
Roughly also, the sell signal is given after the 1M RSI breaks below its MA (yellow trend-line) having previously been on overbought territory (above 70.00). Once the index hits the 1M MA50 (blue trend-line) again, usually a year at most after the Sine Wave top, the most optimal long-term buy signal emerges again. Investors who have applied this strategy/ principle since 2009, have had a total of 5 excellent buy opportunities for tremendous gains at the lowest possible risk.
In conclusion, the market still has almost another year (roughly), until a sell signal emerges (July 2025). In our opinion, having always a low risk profile in our investments, it is advisable to be off stocks before that date just to be on the safe side. The important outcome of this finding, however, is that investors can continue feel safe buying for several more months, especially after the Fed gave a strong excuse to do so.
-------------------------------------------------------------------------------
** Please LIKE 👍, FOLLOW ✅, SHARE 🙌 and COMMENT ✍ if you enjoy this idea! Also share your ideas and charts in the comments section below! This is best way to keep it relevant, support us, keep the content here free and allow the idea to reach as many people as possible. **
-------------------------------------------------------------------------------
💸💸💸💸💸💸
👇 👇 👇 👇 👇 👇
