S&P500 Extremely well supported. This uptrend will continue.Just 6 days ago (September 10, see chart below) we gave the most optimal medium-term buy signal on S&P500 index (SPX) as the price tested and held the 0.5 Fibonacci retracement level:
The price rebounded strongly and is imitating the 0.5 Fib bounces of the previous 12 months that all started very strong rallies (+10.50% the weakest!).
This week we would like to go back to our long-term perspective on the wider time-frames (1W on this chart) as ahead of the Fed Rate Decision on Wednesday, we expect very high volatility that might cloud investor thinking and confidence to a strong degree.
There is no reason to diverge from our long-term bullish outlook (yet) as the index remains extremely well supported on the 1W MA50 (blue trend-line), which was approached on August's low and was last time tested (and held) a year ago (October 23 2023).
A Higher Highs trend-line guides S&P to higher prices, similar to every such trend-line since 2016. The 1W RSI has started to form a Bearish Divergence, which was effective only in early 2022 and the start of the Inflation Crisis. As long as the 1W MA50 holds, the Sine Waves show that this uptrend is far from over.
Technically we should now see a continuation to around 5800 - 6000 and then a new medium-term correction. Our long-term Target is 6500, which based on the progressive nature of cyclical rises within this pattern (+63.50% then 105.00%), seems a modest one.
-------------------------------------------------------------------------------
** Please LIKE 👍, FOLLOW ✅, SHARE 🙌 and COMMENT ✍ if you enjoy this idea! Also share your ideas and charts in the comments section below! This is best way to keep it relevant, support us, keep the content here free and allow the idea to reach as many people as possible. **
-------------------------------------------------------------------------------
💸💸💸💸💸💸
👇 👇 👇 👇 👇 👇
Stockindexsignals

NASDAQ The index is well supported to hit 25k by mid 2025.Last week (September 09, see chart below), we gave a strong buy signal on Nasdaq (NDX) right as the price was testing the 1D MA200, a strong Support on its 2-year Channel Up:
The index duly delivered and we've completed 5 straight green days already. Not only that but the 1D candle closing above the 1D MA50, practically confirmed the bullish extension into this week.
The current week however isn't just a typical one, as we anticipate the Fed Rate Decision on Wednesday and even though the expectations are fixed on at least a 0.25% cut, the volatility is expected to be high.
As a result, to filter out this short-term noise, we will resort today to the wider 1W time-frame, which helps keeping a more accurate long-term perspective. In fact it was the same chart we published 6 months ago (March 18, see chart below), which very accurately laid out the Support that you needed to calmly buy on the long-term, which as you can see, it has been a recurring signal since 2010:
Every time the price broke above a Resistance, it was the ultimate buy entry if re-tested later as a Support. That happened in mid April and that's what happened last week as well.
In fact, the index made a strong rejection on the 1.5 Channel Fibonacci level and then tested and held the 1W MA50, confirming the emergence of a Channel Up (orange) similar to June 2020 - November 2021. The 1W RSI similarities between the two fractals are also further evidence of this.
As a result, we expect Nasdaq to reach as high as 25000 by mid 2025 (a little lower than our previous 6-month estimate but still good enough to be an excellent buy opportunity even now).
-------------------------------------------------------------------------------
** Please LIKE 👍, FOLLOW ✅, SHARE 🙌 and COMMENT ✍ if you enjoy this idea! Also share your ideas and charts in the comments section below! This is best way to keep it relevant, support us, keep the content here free and allow the idea to reach as many people as possible. **
-------------------------------------------------------------------------------
💸💸💸💸💸💸
👇 👇 👇 👇 👇 👇

RUSSELL 2000 Strong buy on the 1st 1W Golden Cross in 3.5 years!The Russell 2000 (RUT) index gave us an excellent buy signal on June 19 (see chart below), hit our 2293 Target and immediately pulled-back to the 1W MA200 (orange trend-line):
The established pattern on the long-term is a Channel Up that first drove the price to Resistance 1 (and our Target) and now guiding it to Resistance 2. The 1W MA50 (blue trend-line) is providing the Higher Low support needed to sustain the Channel Up trend.
The key development this week is the formation of the first 1W Golden Cross since January 2021. We expect that to be enough to resume the Bullish Leg and post at least another +27% rise (as in October - December 2023). As a result our Target is 2400.
-------------------------------------------------------------------------------
** Please LIKE 👍, FOLLOW ✅, SHARE 🙌 and COMMENT ✍ if you enjoy this idea! Also share your ideas and charts in the comments section below! This is best way to keep it relevant, support us, keep the content here free and allow the idea to reach as many people as possible. **
-------------------------------------------------------------------------------
💸💸💸💸💸💸
👇 👇 👇 👇 👇 👇

HANG SENG Strong sell opportunity on recurring fractal.Hang Seng (HSI1!) closed below the 1D MA200 (orange trend-line) yesterday for the first time in a month and confirmed the rejection of August 30. That was a Lower High within the established Channel Down pattern that started on the May 20 High.
This Channel Down is so far following a similar structure with the one that covered the entirety of 2023. The August 30 rejection was in fact also done on the 0.5 Fibonacci retracement level after a -17.30% decline.
If this sequence of events continue to follow the April 17 2023 rejection, we should be expecting the new Lower Low to be formed on the -0.236 Fibonacci extension. Our Target is exactly on that level at 15700.
-------------------------------------------------------------------------------
** Please LIKE 👍, FOLLOW ✅, SHARE 🙌 and COMMENT ✍ if you enjoy this idea! Also share your ideas and charts in the comments section below! This is best way to keep it relevant, support us, keep the content here free and allow the idea to reach as many people as possible. **
-------------------------------------------------------------------------------
💸💸💸💸💸💸
👇 👇 👇 👇 👇 👇

DOW JONES Nothing has changed. Bull trend intact and eyes 48000.Dow Jones (DJI) is having yet again short-term volatility following the August 30 All Time High (ATH), but as we explained last week this is natural, since the medium-term Channel Up hit its top and was looking for the 1D MA50 for buyers and a Higher Low potentially a little lower.
On the longer term though, the trend is intact and is heavily bullish. The 1W MA50 (blue trend-line) is holding and as long as it supports, there is no evidence showing a correction. In fact, this is the exact same pattern that the index has been following since the 2009 bottom of the U.S. Housing Crisis.
As you can see on this 1W chart, the market first bottoms on the 1W MA200 (orange trend-line) and starts a recovery phase by breaking above the 1W MA50. After a lengthy consolidation on it with a few tests (to confirm it as Support), it enters a structured Channel Up until the Cycle's peak. The first two Cycles rose by exactly +75% from their bottom to top, while the COVID one peaked at +70%.
As a result, assuming a minimum +70% rise for this Cycle also, we can target at least 48000. It appears that the index is currently past half-way through the Cycle, already within the standard Channel Up.
In addition, you can observe the similarities between the Cycles on the 1W RSI fractals as well, which tend to 'cool down' once this Channel Up starts forming.
-------------------------------------------------------------------------------
** Please LIKE 👍, FOLLOW ✅, SHARE 🙌 and COMMENT ✍ if you enjoy this idea! Also share your ideas and charts in the comments section below! This is best way to keep it relevant, support us, keep the content here free and allow the idea to reach as many people as possible. **
-------------------------------------------------------------------------------
💸💸💸💸💸💸
👇 👇 👇 👇 👇 👇

NIKKEI 2nd phase of rally starting.NIKKEI (NI225) couldn't have given us a more reliable bullish continuation signal that our last call (August 14, see chart below), as it hit exactly our 39000 Target and then pulled-back:
The rejection took place on the 0.786 Fibonacci retracement level, similar to the, above 1D MA50 (blue trend-line) rejection on October 13 2023, which is the Megaphone fractal we used last time to come up with the buy signal.
So far, the new correction almost reached the 0.5 Fib, so it is good enough for a buy, considering also the fact that the 1D RSI hit again the Symmetrical Pivot Zone, which is where the late October 2023 decline bottomed and started a new rally to the Megaphone's top.
As a result, we turn bullish again today, targeting 42450 (the July 11 High).
-------------------------------------------------------------------------------
** Please LIKE 👍, FOLLOW ✅, SHARE 🙌 and COMMENT ✍ if you enjoy this idea! Also share your ideas and charts in the comments section below! This is best way to keep it relevant, support us, keep the content here free and allow the idea to reach as many people as possible. **
-------------------------------------------------------------------------------
💸💸💸💸💸💸
👇 👇 👇 👇 👇 👇

S&P500 just needs to recover the 1D MA50.The S&P500 recovered yesterday a great deal of Friday's losses but still that wasn't enough to reclaim the 1D MA50 (blue trend-line), which was lost as the short-term Support level. As you realize, this is the key in order to resume and sustain the uptrend that started after the August 05 rebound near the 1D MA200 (orange trend-line).
The long-term pattern is a Channel Up and even before that since late 2022 and the bottom of the Inflation Crisis, the index only once corrected below the 0.5 Fibonacci retracement level (the October 27 2023 Low). We mention that because Friday's decline stopped exactly on the 0.5 Fib.
Every rise that followed until the next correction, reached at least +10.50% from the 0.5 Fib. As a result, once the index reclaims the 1D MA50, we will buy and set the next medium-term Target at 5950 (+10.50% from the 0.5 Fib).
Notice also that yesterday's rebound was made exactly on the 1D RSI's Symmetrical Support, a level that initiated the December 19 2022 rebound.
-------------------------------------------------------------------------------
** Please LIKE 👍, FOLLOW ✅, SHARE 🙌 and COMMENT ✍ if you enjoy this idea! Also share your ideas and charts in the comments section below! This is best way to keep it relevant, support us, keep the content here free and allow the idea to reach as many people as possible. **
-------------------------------------------------------------------------------
💸💸💸💸💸💸
👇 👇 👇 👇 👇 👇

NASDAQ Is an August Low re-test inevitable?Nasdaq (NDX) got heavily rejected last week on the 1D MA50 (blue trend-line) and almost reached on Friday its 1D MA200 (orange trend-line). That was the level that was brutally breached on the August 05 Low, which only found Support on the 1W MA50 (red trend-line) and rebounded.
Technically those last two MA trend-lines are the long-term Buy Zone of the 2-year Channel Up that started after the October 13 2022 market bottom of the Inflation Crisis. Based on the last two major Higher Lows of that pattern though, it is possible for the index to re-test that August Low as it happened both on December 28 2022 (re-test of the October 13 2022 Low) and September 27 2023 (re-test of the August 13 2023 Low). The latter in fact dived on a 3rd wave a little lower to test the 1D MA200, but this time, this condition has already been met (1D MA200 already tested).
This Low re-test tendency is also evident on the 1D RSI fractals among the Higher Lows sequences. If that scenario is materialized, it would give us both a big bullish and a big bearish development. From the bullish side, a 17300 re-test would form an exact Higher Low at the bottom of the 2-year Channel Up, which is positive as it will fulfil a strong bullish condition to move forward. On the bearish side though, that would mean a breach of the 1W MA50, which technically would be very negative, unless the 1W candle that will break it, manages to close the week above it on a strong bounce.
Until then, lets initially see if the 1D MA200 holds (currently early in the day/ week it does) as if the price reverses here, we can technically have a bottom similar to October 26 2023. In any case, Nasdaq is just above the 1st long-term Buy Zone currently.
-------------------------------------------------------------------------------
** Please LIKE 👍, FOLLOW ✅, SHARE 🙌 and COMMENT ✍ if you enjoy this idea! Also share your ideas and charts in the comments section below! This is best way to keep it relevant, support us, keep the content here free and allow the idea to reach as many people as possible. **
-------------------------------------------------------------------------------
💸💸💸💸💸💸
👇 👇 👇 👇 👇 👇

CHINA A50 Death Cross to push it lower but buy opportunity lurksThe China A50 index (CN50) completed yesterday a 1D Death Cross following a convincing rejection on the 1D MA200 (orange trend-line) and that should extend the Channel Down to a new Lower Low.
Technically it appears to far to be in good symmetry with the Falling Wedge's previous Bearish Leg, that found a temporary bottom after a -14.76% decline and rebounded to the 0.618 Fibonacci retracement level.
As a result, despite the current weakness, we expect this last push to stop around 11100 - 11000 and then rebound to 12100 (0.618 Fib).
-------------------------------------------------------------------------------
** Please LIKE 👍, FOLLOW ✅, SHARE 🙌 and COMMENT ✍ if you enjoy this idea! Also share your ideas and charts in the comments section below! This is best way to keep it relevant, support us, keep the content here free and allow the idea to reach as many people as possible. **
-------------------------------------------------------------------------------
💸💸💸💸💸💸
👇 👇 👇 👇 👇 👇

DOW JONES correction to extend until the Fed.Dow Jones (DJI) did what we expected of it 3 weeks ago (August 13, see chart below) and after pricing a Higher Low at the bottom of the 5-month Channel Up, it rebounded and reached the All Time High (ATH), pricing a Higher High:
In continuation of that analysis, we now expect the new Bearish Leg to extend to possibly as low as the 0.618 Fibonacci retracement level, which was the case with the May 30 pull-back.
The 1D RSI suggests that a 35.00 value would be ideal to signal a buy (same as May 30, see how both RSI fractals priced the top on the 70.00 overbought limit), while a Bullish Cross on the 1D MACD would be the final confirmation of the buy.
Our long-term Target remains 42400 (+11.00% from the Higher Low, the same % rise as the July 18 High).
-------------------------------------------------------------------------------
** Please LIKE 👍, FOLLOW ✅, SHARE 🙌 and COMMENT ✍ if you enjoy this idea! Also share your ideas and charts in the comments section below! This is best way to keep it relevant, support us, keep the content here free and allow the idea to reach as many people as possible. **
-------------------------------------------------------------------------------
💸💸💸💸💸💸
👇 👇 👇 👇 👇 👇

NIFTY Next buy opportunity on the 1D MA50.We had another success on the Nifty 50 Index (NIFTY) on our last buy signal (August 09, see chart below), as we bought after a confirmed rebound on the 1D MA50 (blue trend-line), with the index being currently very close to our 25500 Target:
The index continues to follow the a cyclical pattern and this is how we made this previous successful prediction on the 1D MA50. As you can see it was the very same rebound on January 24 2024 (1D MA50 and bottom of the Megaphone) that rose by +6.64% before turning sideways again into a larger (dashed) Megaphone.
We are about to enter this fractal symmetry and potentially initiate a new Megaphone. The former one gave this first buy opportunity on the 1D MA50 again, then on the 1D MA100 (green trend-line) and finally near the 1D MA200 (orange trend-line). An additional buy signal was when the 1D RSI hit its Support Zone.
As a result we are closing the previous buy now on profit and will wait for the 1D MA50 contact to buy again and target the top of the Megaphone (Higher Highs trend-line) at 25700.
-------------------------------------------------------------------------------
** Please LIKE 👍, FOLLOW ✅, SHARE 🙌 and COMMENT ✍ if you enjoy this idea! Also share your ideas and charts in the comments section below! This is best way to keep it relevant, support us, keep the content here free and allow the idea to reach as many people as possible. **
-------------------------------------------------------------------------------
💸💸💸💸💸💸
👇 👇 👇 👇 👇 👇

NASDAQ won't correct again in 2024It has been almost 1 year (October 24 2023, see chart below) when we called for a mega buy opportunity on Nasdaq's (NDX) last bottom:
As you can see, the index started an insane rally sequence right on that weekly candle and didn't correct again that much before the recent July - August 2024 pull-back.
The gains from that bottom buy signal have been almost +50% and as the 1W MA50 (blue trend-line) was tested on the early August Low and held, we expect Nasdaq to resume and maintain the steady bullish trend for the rest of the year.
The next Target before it gives a medium-term correction again in our opinion is 22500, which is exactly on the 1.618 Fibonacci extension from the October 2022 market bottom.
The reason we project this target is because, as you can see on our October 2023 analysis above, we find remarkable similarities between the 2022 Inflation Crisis correction and the 2008 Housing Crisis.
This is what helped us give the mega buy signal in October, because the price formed a 1W MA50/MA100 Bullish Cross, the first since February 2010 and the correction was contained above the 0.618 Fibonacci retracement level. So with the 1.236 Fib already achieved during the current (blue) Channel Up (see how both recovery sequences take place within Channel Up patterns), the next in line is the 1.618 Fib at 22500.
According to all the above, the next time that Nasdaq could correct might be early in 2025.
-------------------------------------------------------------------------------
** Please LIKE 👍, FOLLOW ✅, SHARE 🙌 and COMMENT ✍ if you enjoy this idea! Also share your ideas and charts in the comments section below! This is best way to keep it relevant, support us, keep the content here free and allow the idea to reach as many people as possible. **
-------------------------------------------------------------------------------
💸💸💸💸💸💸
👇 👇 👇 👇 👇 👇

FTSE 100 Potentially topped. Strong pull-back incoming.Earlier this month (August 08, see chart below), we got the most optimal buy entry on FTSE 100 (UK100) that quickly hit the 8300 short-term Target, even earlier than we expected:
The price is now above the top (Lower Highs trend-line) of the Bearish Megaphone, a symmetrical pattern to May - August 2023. We expect this rally to top soon and then pull-back the same way to the symmetrical Support Zone, below the 1D MA50 (blue trend-line).
Shorters can target its top at 8150 and then buy for 8500.
-------------------------------------------------------------------------------
** Please LIKE 👍, FOLLOW ✅, SHARE 🙌 and COMMENT ✍ if you enjoy this idea! Also share your ideas and charts in the comments section below! This is best way to keep it relevant, support us, keep the content here free and allow the idea to reach as many people as possible. **
-------------------------------------------------------------------------------
💸💸💸💸💸💸
👇 👇 👇 👇 👇 👇

DAX ahead of a mega 1W Bullish Cross.Last month (July 15, see chart below), we made a bold Megaphone prediction on DAX (FDAX1!), which delivered both an excellent sell opportunity and a bottom buy entry:
The situation now is more difficult as despite DAX's recovery, the U.S. markets are under a certain degree of volatility. We need to zoom out to the 1W time-frame to answer that and get a better understanding of the long-term trend.
The key development will be the upcoming formation of a 1W MACD Bullish Cross. It will be the first since November 20 2023, which was in fact the last time the index hit and rebounded on the 1W MA100 (green trend-line), forming the previous Higher Low of the 2-year Channel Up.
As a result, having already tested and rebounded earlier this month on the 1W MA50 (blue trend-line) for the first time in 9 months, we believe that the current 4-week green rally will be extended.
The last two Bullish Legs of the Channel Up initially rose by +16.74% and +23.84% before their first corrective pull-back. As a result, our Target on the medium-term is 19800 (+16.74% rise from the recent bottom).
-------------------------------------------------------------------------------
** Please LIKE 👍, FOLLOW ✅, SHARE 🙌 and COMMENT ✍ if you enjoy this idea! Also share your ideas and charts in the comments section below! This is best way to keep it relevant, support us, keep the content here free and allow the idea to reach as many people as possible. **
-------------------------------------------------------------------------------
💸💸💸💸💸💸
👇 👇 👇 👇 👇 👇

S&P500 Why the volatility shouldn't scare you.Five months ago (March 21, see chart below), we published a comparison analysis on the S&P500 index (SPX), warning of a medium-term correction but at the same time setting a long-term 6500 Target:
As you can see, the fractal comparison of March 2024 with March 2017 worked very well and this is why the recent July - August correction shouldn't scare you. The 2022 - 2024 sequence continues to replicate to a solid degree the 2015 - 2017 period, which after holding both the 1W MA50 (blue trend-line) and testing and bouncing on the 1.786 Fibonacci extension, it rallied towards the 3.0 Fib.
Check also how similar the 1W RSI sequences are within the two fractals. At the moment we are just past the RSI Double Bottom formation (August 14 2017 and August 05 2024 respectively), which should initiate a rally that will peak deep into the overbought zone in Q1 2025.
As a result, our long-term Target of 6500 is intact, and as the title says, the volatility shouldn't scare you and make you diverge from the long-term goal and perspective.
-------------------------------------------------------------------------------
** Please LIKE 👍, FOLLOW ✅, SHARE 🙌 and COMMENT ✍ if you enjoy this idea! Also share your ideas and charts in the comments section below! This is best way to keep it relevant, support us, keep the content here free and allow the idea to reach as many people as possible. **
-------------------------------------------------------------------------------
💸💸💸💸💸💸
👇 👇 👇 👇 👇 👇

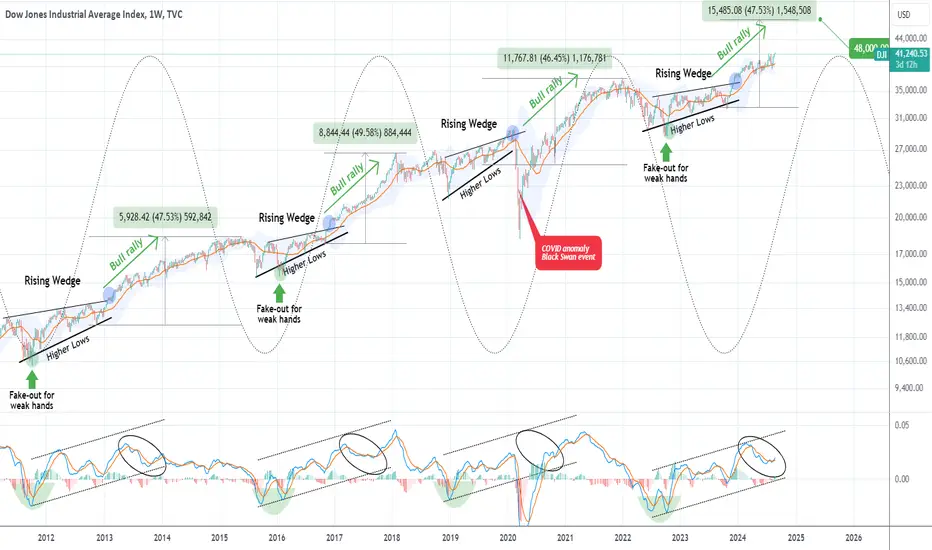
DOW JONES The pattern that never failed is now targeting 48000Dow Jones (DJI) gave us the best bullish break-out signal of the year 8 months ago (December 13 2023, see chart below), as our buy entry at 36577 is very close to hitting our 42900 Target:
At that time we made a clear point why that rally 'shouldn't surprise you' and now you see why. This 1W time-frame chart shows the cyclical behavior of the index, which peaks (Sine Wave top) then pulls back and starts forming a Rising Wedge (Sine Wave bottom) and when it breaks above the Rising Wedge, is where it flashed the bullish break-out signal we got back in December.
As you can see it then starts a gradual rise on the BB20 and completes the Cycle again (Sine Wave top) after roughly a +47% rally. The title mentions that this pattern 'never failed', in practice it only broke during the COVID flash crash, which is a non-technical event than occurs once every 100 years. As you can see even the 1W MACD sequences between the cyclical patterns are identical.
As a result, our Target towards the Sine Wave peak is 48000.
-------------------------------------------------------------------------------
** Please LIKE 👍, FOLLOW ✅, SHARE 🙌 and COMMENT ✍ if you enjoy this idea! Also share your ideas and charts in the comments section below! This is best way to keep it relevant, support us, keep the content here free and allow the idea to reach as many people as possible. **
-------------------------------------------------------------------------------
💸💸💸💸💸💸
👇 👇 👇 👇 👇 👇
NASDAQ Normal volatility. Bullish trend intact.Nasdaq (NDX) gave as the ultimate bottom signal on our buy call 2 weeks ago (see chart below) and staged a massive recovery from July's correction:
Right now it tested and held the 1D MA50 (blue trend-line) as a Support, establishing the new demand zone. During the previous Bullish Legs of the nearly 2-year Channel Up, when the price action remained above the 1D MA50, Nasdaq extended to a new Higher High on that pattern.
We may face some minor volatility for max a week, as the index encountered during the first to Bullish Legs but we should soon test the Inner Higher Highs trend-line, which most likely will see us reach our first Target of 20900.
-------------------------------------------------------------------------------
** Please LIKE 👍, FOLLOW ✅, SHARE 🙌 and COMMENT ✍ if you enjoy this idea! Also share your ideas and charts in the comments section below! This is best way to keep it relevant, support us, keep the content here free and allow the idea to reach as many people as possible. **
-------------------------------------------------------------------------------
💸💸💸💸💸💸
👇 👇 👇 👇 👇 👇

S&P500 This is how it will reach 6000.The S&P500 index (SPX) has recovered almost all of its losses since its July 16 All Time High (ATH), firmly establishing again itself above the 1D MA50 (blue trend-line), which is the usual short-term Support level during uptrends.
The underlying pattern is a Channel Up and every time the index breaks above a former Resistance level (such as the current ATH), it consolidates for a few days and retests it as a Support, before starting the next wave of the Bullish Leg.
As a result, we expect the index to break above 5670 soon and then turn sideways, sustained above it for 1-2 weeks. By the end of October we are targeting for a 6000 Higher High at the top of the long-term Channel Up pattern.
-------------------------------------------------------------------------------
** Please LIKE 👍, FOLLOW ✅, SHARE 🙌 and COMMENT ✍ if you enjoy this idea! Also share your ideas and charts in the comments section below! This is best way to keep it relevant, support us, keep the content here free and allow the idea to reach as many people as possible. **
-------------------------------------------------------------------------------
💸💸💸💸💸💸
👇 👇 👇 👇 👇 👇

DOW JONES Don't lose sight of the great picture. Still bullish.Last week, while Dow Jones (DJI) was still under its 1D MA50, we called for a major rally, as technically the 5-month Channel Up has just priced its new Higher Low:
The index has now almost reached the Target of the first Bullish Leg of this pattern, pointing to a potential relief next.
On the larger picture however (1M time-frame), we had posted an article named 'Secret Cycles' on April 12 2024 (see chart below), during Dow Jones' previous pull-back that again inflicted fear in the markets, calling for a strong buy:
It is this chart that we revisit and expand up today, as we don't think the long-term trend has changed. We want to maintain a clear long-term perspective and following August's massive recovery 1M candle, we believe that Dow will enter by Q4 2024, the final stage (rally) of its current Cycle.
That has historically been 1 year at least, so as long as the index keeps holding and closing the monthly candles above the 1M MA50 (red trend-line), we will continue buying all monthly dips. Our 48850 long-term Target is intact.
-------------------------------------------------------------------------------
** Please LIKE 👍, FOLLOW ✅, SHARE 🙌 and COMMENT ✍ if you enjoy this idea! Also share your ideas and charts in the comments section below! This is best way to keep it relevant, support us, keep the content here free and allow the idea to reach as many people as possible. **
-------------------------------------------------------------------------------
💸💸💸💸💸💸
👇 👇 👇 👇 👇 👇

NASDAQ Reality will again hit those betting against the market.10 months ago (October 06 2023, see chart below), we published an idea with a similar title, as following a standard technical 3-month correction, there was a growing bearish sentiment amidst market fear over a potential economic slowdown of the 2023 recovery:
As you can see none of the 'fears' prevailed and instead the index offered us the best buy opportunity at the time. The early August correction has been the best buy opportunity since then.
After a 3-week correction, quite aggressive for sure, Nasdaq (NDX) reached its 1W MA50 (blue trend-line) for the first time in almost 1.5 years and rebounded emphatically, making the strongest case possible that this Support level priced the new market bottom.
We made slight changes on this 10-month chart and we've set 2 new long-term targets: Target 1 at 23250 (the 0.236 Fibonacci level) and 27000 (top of the Channel Up).
We utilized the Fib symmetry of the previous Bull Phase, prior to the 2022 (inflation) correction and since Nasdaq is currently at 97 weeks (697 days) since its Bear Cycle bottom (October 10 2022), we could assume that proportionally, we are around November 02 2022, around the 0.382 Fib.
The 1W RSI just rebounded on the 5-year Symmetrical Support Zone that only breaks during Bear Phases and the 1W MACD is also posting a similar sequence to Nov 2022. Note that as long as the 1W MA50 holds, the index is technically on a long-term Bull Phase with the Green Ichimoku Cloud supporting within the 1W MA50 and MA100 (green trend-line). Technically, the index can rise up to 29000 - 30000 before entering a new 1-year Bear Phase.
-------------------------------------------------------------------------------
** Please LIKE 👍, FOLLOW ✅, SHARE 🙌 and COMMENT ✍ if you enjoy this idea! Also share your ideas and charts in the comments section below! This is best way to keep it relevant, support us, keep the content here free and allow the idea to reach as many people as possible. **
-------------------------------------------------------------------------------
💸💸💸💸💸💸
👇 👇 👇 👇 👇 👇

RUSSELL starting a 1 year rally at least, targeting 3500.Ten months (October 7 2023, see chart below) ago we made the ultimate buy call on Russell 2000 (RUT) based on a 15-year Cyclical pattern:
As you can see the index made a straight up rebound on the 1M MA100 (green trend-line), while at the same time holding the Previous All Time High (ATH) Support. Excluding the black swan event of COVID, the ATH Support Zones have held every time since the 2009 Housing Crisis bottom, initiating the next Bull Phase of the Cycle.
This is representative of economic conditions thus far and this model shows that technically, we can only get higher from here. The index has just completed the 1st rebound phase (green ellipse) and is effectively supported by the 1M MA50 (blue trend-line). The 3 times that this happened during this 15 year Cycle, a Channel Up followed that easily broke above the ATH and peaked the Cycle on the 2.0 Fibonacci extension from ATH - bottom.
As a result, as long as the 1M MA50 holds, we are more bullish than ever on the Small Caps, targeting long-term 3500 (Fibonacci 2.0 extension).
Note: Every time the 1M RSI breaks above its MA trend-line again following a Bear Phase, the new Bull Cycle begins. We have displayed that with the ellipse patterns.
-------------------------------------------------------------------------------
** Please LIKE 👍, FOLLOW ✅, SHARE 🙌 and COMMENT ✍ if you enjoy this idea! Also share your ideas and charts in the comments section below! This is best way to keep it relevant, support us, keep the content here free and allow the idea to reach as many people as possible. **
-------------------------------------------------------------------------------
💸💸💸💸💸💸
👇 👇 👇 👇 👇 👇

HANG SENG Sell Signal on the 1D MA200.Hang Seng (HSI1!) has been trading within a Channel Down pattern and since the start of this week, it's sideways around the 1D MA200 (orange trend-line). As long as the 1D MA50 (blue trend-line) remains intact, we continue to be bearish within this pattern, targeting 16000 next (Support 1), expecting this to be the start of the new Bearish Leg.
-------------------------------------------------------------------------------
** Please LIKE 👍, FOLLOW ✅, SHARE 🙌 and COMMENT ✍ if you enjoy this idea! Also share your ideas and charts in the comments section below! This is best way to keep it relevant, support us, keep the content here free and allow the idea to reach as many people as possible. **
-------------------------------------------------------------------------------
💸💸💸💸💸💸
👇 👇 👇 👇 👇 👇

S&P500 Inflation below 3% 1st time since 2021! Must the FED cut?The U.S. Consumer Price Index (CPI) was reported today below 3% for the first time since April 13 2021! This means that Inflation (red trend-line) is getting closer to the Fed's desired benchmark, coming in contrast with the fears of an economic slowdown last week.
On today's S&P500 (SPX) analysis we examine the effect of an Inflation drop on the market.
As you can see, the sudden drop on the Inflation Rate in mid-2022 was followed by a sideways trend in the past year (since July 2023). This is not the first time we see such consolidation after a strong decline. In fact, the most similar pattern to today's is the post August 2012 consolidation on Inflation.
The similarities don't stop there. As this chart is our well-known 'S&P500 +10 year Cheatsheet' which we have published in the past and updated numerous times, we can see that the index has most likely entered the 2nd phase (green Rectangle) of its cyclical expansion (Channel Up), that tends to lead to a cooling Bear Phase in the form of a Megaphone. The current 1W RSI pattern is also similar to post 2013.
As a result, we expect the index to resume the uptrend and even hit 6900 at least as it will be a +95.84% rise (similar to 2011 - 2014).
Regarding the Fed, and whether or not they should cut the interest rates in September, we believe that this will be welcomed, especially on a 1 year basis, as it will stimulate the economy with inflation getting as close to the Fed's target as possible.
-------------------------------------------------------------------------------
** Please LIKE 👍, FOLLOW ✅, SHARE 🙌 and COMMENT ✍ if you enjoy this idea! Also share your ideas and charts in the comments section below! This is best way to keep it relevant, support us, keep the content here free and allow the idea to reach as many people as possible. **
-------------------------------------------------------------------------------
💸💸💸💸💸💸
👇 👇 👇 👇 👇 👇
