Shriram Finance on Radar ! Bullish Setup !This is the daily chart of SHRIRAMFIN.
SHRIRAMFIN having a good law of polarity near at 580-600.
if this level is sustain then we may see higher prices in SHRIRAMFIN.
Thank You !!
Stockmarketanalysis

AMD 1W: If Not Now — Then When?The weekly chart of AMD looks like it’s holding its breath: a well-defined falling wedge, double bottom support, and price pressing right against long-term trendline resistance. Everything’s in place — now it just needs to break and run, preferably without tripping over nearby Fibonacci levels.
The stock is trading around $114 and attempting to hold above the 50-week MA. Just ahead is the 200-week MA (~131) — not only a technical hurdle but also a psychological pivot. A move above it could reignite talk of $150+ targets.
The wedge has been narrowing since late 2024. After repeated bounces off support, price has returned to the top of the pattern. A confirmed weekly close above the wedge could trigger a real breakout. Without that — it risks yet another scripted pullback.
Key Fibonacci levels:
0.618 — $133.60
0.5 — $151.42
0.382 — $169.25
0.236 — $191.30
0.0 — $226.95 (all-time high)
The roadmap looks clean — but only if volume follows through. There are signs of quiet accumulation at the bottom, but no explosive buying just yet.
Fundamentals:
AMD delivered solid Q1 results: revenue is growing, EPS beat expectations, and margins are holding. More importantly, the company launched a new $6 billion stock buyback program — showing clear internal confidence in its long-term trajectory.
There’s also a strategic AI partnership underway with a Middle Eastern tech group. This move positions AMD to challenge not just for GPU market share, but for future AI infrastructure dominance — long game stuff.
Analyst sentiment has turned bullish again, with new price targets in the $130–150 range. All of this makes the current chart structure more than just technical noise — it’s backed by strong tailwinds.

Quantum's BBY Outlook 7/20/25🚀 G.O.D. Flow (Gamma, Orderflow, Dealer Positioning)
1. 🧩 Summary Overview
Ticker: BBY
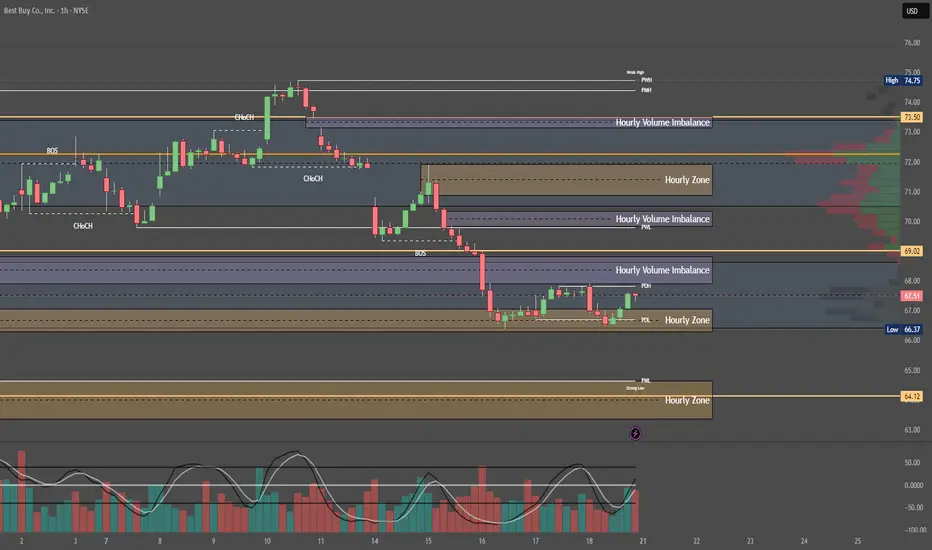
Current Price: $67.50
Flow Setup Date: Current Session
Trade Type: Intraday / 0–2 Day Swing
2. 🔬 Flow Breakdown
🔵 GEX (Gamma Exposure):
Highest -GEX at 70 → potential volatility pocket and resistance zone.
Despite matching +GEX at 70, net gamma is negative — bearish skew.
Additional +GEX at 72 & 73, but overwhelmed by -GEX at 68 and 67.
🔺 Overall gamma environment favors chop and downside unless 70 is reclaimed.
🟡 DEX (Delta Exposure):
Mirrors GEX layout.
Dealer short delta bias = likely selling into strength.
Reclaim of 70+ may signal a squeeze, but not favored without sweep confirmation.
🟣 Vanna:
Strong -Vanna clusters from 70 to 77: if IV rises, dealers sell into strength.
⚠️ This limits bullish continuation unless IV drops drastically.
Minor +Vanna at 60 = support base on deep dip (liquidity pocket if flushed hard).
🔴 Charm:
Extreme -Charm peak at 70 = time decay creates headwind at this level.
Additional -Charm pressure at 72, 73, and 77.
Minor +Charm at 60 suggests dealer support only comes much lower.
⚪ Volatility:
Neutral past week.
If vol spikes, expect dealer selling pressure to intensify under this skew.
🟢 Open Interest:
Heavy put OI at 70 = possible support IF price breaks hard.
Calls OI lighter at 72 and 73, meaning less resistance absorption if price does push up.
3. 📊 Chart Structure Setup
Price: $67.50, sitting below key gamma and charm cluster at 70.
Chart bias: Bearish unless strong reclaim of 70.
Key flush zones: 68 → 67 → 65
Confirmed supply above 70 due to clustered charm/vanna.
4. 🎯 Trade Plan
🟥 Bias: Bearish unless 70 is reclaimed and held with size.
🛠 Entry Triggers:
Rejection of 69.50–70 zone → PUT
Break and retest of 67 → PUT
📦 Contract Picks (0–5 DTE):
67p, 65p, 60p
🛑 Risk Stop:
Breakout and hold above 70.50 with size = exit or flip long bias intraday
🎯 Targets:
Target 1: 66.00 (Gamma flush)
Target 2: 63.00 (next +Charm liquidity zone)
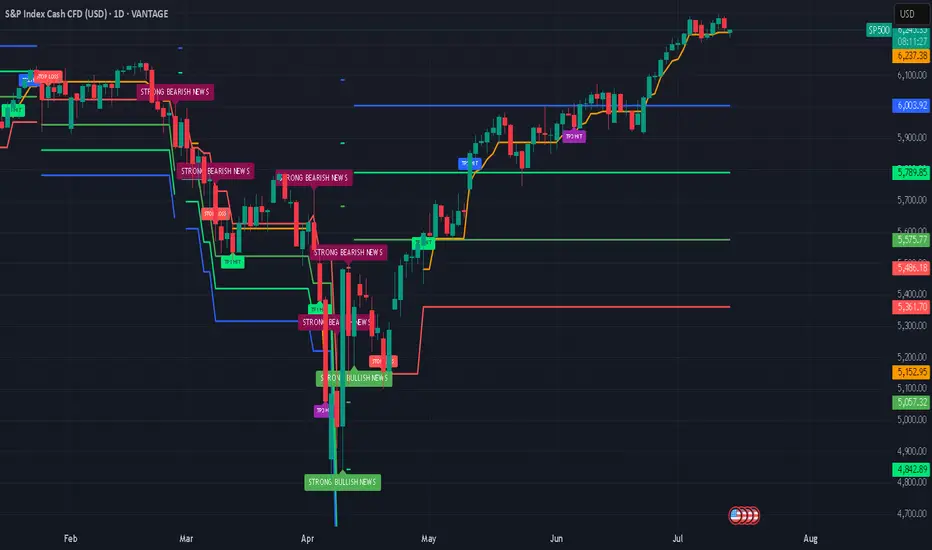
S&P 500: Defying Tariff Headwinds, Breaking RecordsThe S&P 500 has staged a remarkable rally in 2025, shattering all-time highs and capturing global attention. This surge has unfolded despite the negative economic overhang of renewed tariff threats and ongoing trade tensions, raising critical questions for investors: How did the market overcome such headwinds, and what lies ahead for both the short and long term?
The Rally Against the Odds
Tariff Turbulence: Earlier this year, President Trump announced sweeping new tariffs, sparking fears of supply chain disruptions and higher costs for American companies. Historically, such moves have triggered volatility and corrections.
Market Resilience: Despite these concerns, the S&P 500 not only recovered losses from the spring but surged to new record highs, with the index climbing over 23% since April’s lows. Major tech companies, especially those leading in AI and innovation, have been at the forefront of this advance.
Investor Sentiment: The rally has been fueled by optimism around potential Federal Reserve rate cuts, robust corporate earnings, and expectations of long-term economic growth—even as the immediate impact of tariffs remains uncertain.
Short-Term Correction: A Healthy Pause?
While the long-term outlook remains bullish, several indicators suggest the market may be due for a short-term correction:
Narrow Market Breadth: The current rally has been driven by a handful of mega-cap stocks, leaving the median S&P 500 stock well below its own 52-week high. Historically, such narrow leadership often precedes periods of consolidation or pullbacks.
Valuation Concerns: Stock valuations are at elevated levels, and some analysts warn that earnings growth could slow as companies adapt to higher input costs and shifting trade policies.
Correction Forecasts: Some strategists predict the S&P 500 could correct to around 5,250 by the third quarter of 2025, citing factors like slowing consumer spending and persistent policy uncertainty.
Long-Term Outlook: Higher Highs Ahead
Despite the potential for near-term volatility, the long-term trajectory for the S&P 500 remains positive:
Fed Policy Tailwinds: Anticipated rate cuts and lower bond yields are expected to provide further support for equities, encouraging risk-taking and higher valuations.
Corporate Adaptation: Companies are actively offsetting tariff impacts through cost savings, supply chain adjustments, and strategic pricing.
Growth Sectors: Innovation in technology, productivity gains, and deregulation are setting the stage for sustained profit growth, especially in sectors like AI, robotics, and defense.
Key Takeaways for Investors
Stay Disciplined: While a short-term correction is possible, history shows that markets often rebound strongly after periods of volatility.
Diversify Exposure: With market gains concentrated in a few names, diversification and active stock selection are more important than ever.
Focus on Fundamentals: Long-term investors should look beyond headlines and focus on companies with resilient earnings and adaptive business models.
The S&P 500’s ability to break records in the face of tariff headwinds is a testament to the underlying strength and adaptability of the U.S. economy. While short-term bumps are likely, the path ahead still points toward new highs for those with patience and perspective.
This article is for informational purposes only and does not constitute investment advice. Always consult with a financial advisor before making investment decisions.
#spx500 #stockmarket #analysis #economy #us #nasdaq #fed #bonds #rates #trading
S&P 500: Time For A Pullback??
In this Weekly Market Forecast, we will analyze the S&P 500 for the week of July 14 - 18th.
The S&P 500 had a strong week, until Tariff Tensions Friday arrived.
This by itself doesn't mean we should start looking for sells. With Tuesday CPI Data coming, this short term consolidation is to be expected until the news is announced.
Let the markets pick a direction, and flow with it.
Have a plan of action in place so you can react to the price action promptly!
Enjoy!
May profits be upon you.
Leave any questions or comments in the comment section.
I appreciate any feedback from my viewers!
Like and/or subscribe if you want more accurate analysis.
Thank you so much!
Disclaimer:
I do not provide personal investment advice and I am not a qualified licensed investment advisor.
All information found here, including any ideas, opinions, views, predictions, forecasts, commentaries, suggestions, expressed or implied herein, are for informational, entertainment or educational purposes only and should not be construed as personal investment advice. While the information provided is believed to be accurate, it may include errors or inaccuracies.
I will not and cannot be held liable for any actions you take as a result of anything you read here.
Conduct your own due diligence, or consult a licensed financial advisor or broker before making any and all investment decisions. Any investments, trades, speculations, or decisions made on the basis of any information found on this channel, expressed or implied herein, are committed at your own risk, financial or otherwise.

Dow Could Be Gearing Up for a Run Toward 50,000We’ve seen it before—and we might be seeing it again . The Dow Jones is showing a familiar pattern, and here’s what’s happening:
The index has been repeatedly hitting the 1.618 Fibonacci extension from previous ranges.
Right now, we’re approaching the 100% extension between the last swing high (~45,000) and swing low (~36,600).
If the Dow breaks above that previous high at 45,000, there's a good chance we’ll see the pattern repeat—with 50,000 as the next target.
It’s all about that breakout confirmation. Until then, we watch and wait.
This market has a memory—let’s see if it chooses to repeat it again.

VTI 1D: breakout on the daily within a long-term weekly uptrend On the daily chart, VTI (Vanguard Total Stock Market ETF) has broken through the key $303.5 resistance level with strong volume. This breakout occurs within a larger weekly uptrend channel, highlighting a continuation of the long-term bullish structure.
Volume profile shows a clear path ahead: $321.7 (1.272 Fibo) and $345 (1.618 Fibo). The golden cross (MA50 crossing MA200 from below) further supports the bullish case.
Fundamentally, VTI represents the entire U.S. equity market - large to small caps - and benefits from economic resilience, declining inflation, and passive inflows. It’s a logical macro play for trend continuation.
Tactical plan:
— Entry by market or after retest $303.5
— TP1: $321.7
— TP2: $345
— Invalidation below $300
The whole market breaking out? That’s not noise — it’s the signal.

XLK ETF. TO WAR, OR NOT TO WAR — THAT IS THE QUESTION..US stock futures edged lower Wednesday evening ahead of Thursday’s market closure for Juneteenth.
The moves came after the Federal Reserve held interest rates steady, with Chair Jerome Powell striking a cautious tone amid rising geopolitical and economic uncertainty.
Powell reaffirmed a data-dependent approach, pointing to unclear inflation impacts from President Trump’s tariffs and the risk of stagflation.
Fed projections now include two rate cuts in 2025, alongside downgraded growth expectations and higher inflation forecasts.
Investor sentiment was further dampened by escalating tensions in the Middle East, as the ongoing Israel-Iran conflict stoked fears of deeper US involvement, while North Korea has recently launched 10 rockets from near capital Pyongyang.
Futures for 7 of the 11 S&P 500 sectors ended the Prime Day holiday in the red, led by declines in energy, while technology outperformed.
What is more important Technology sector is the one and only over 11 S&P 500 sectors that has printed recently new all the history high, just one - two days before Prime Day.
What is XLK The Technology Select Sector SPDR Fund ETF
AMEX:XLK ETF is respectively The Technology Select Sector ETF, that seeks to provide investment results correspond generally to the price and yield performance of the S&P 500 Technology Sector Index.
The largest 5 holdings of this ETF are Microsoft NASDAQ:MSFT , Nvidia NASDAQ:NVDA , Apple NASDAQ:AAPL , Broadcom NASDAQ:AVGO and Oracle NYSE:ORCL , while all together they weight nearly 50 percent of the fund by market cap.
Microsoft NASDAQ:MSFT shares have experienced a significant upward trend in 2025, reaching new all-time highs and reflecting the company’s robust financial performance and strategic positioning in the technology sector.
Record Highs and Price Momentum
As of June 18, 2025, Microsoft’s stock closed at $480.24, marking its highest closing price ever. This price is just below its 52-week high of $481.00 and represents a 14% gain year-to-date, making Microsoft one of the best-performing stocks among the so-called “Magnificent Seven” tech giants in 2025. The stock’s average price over the past 52 weeks was $422.77, and its 52-week low was $344.79, which is 28.2% below the current level, highlighting the impressive rally over the past year.
Short-Term and Long-Term Performance
In the immediate term, Microsoft’s stock has shown steady gains. Over the past week, the share price rose by 2.03%, and over the past month, it increased by 6.36%. Looking at a broader horizon, the stock is up 6.79% over the last year, underscoring consistent investor confidence and the company’s ability to capitalize on growth opportunities.
Drivers Behind the Rally
Several factors have contributed to Microsoft’s recent share price surge:
Artificial Intelligence Investment. Microsoft continues to invest heavily in AI infrastructure, with plans to spend $80 billion in fiscal 2025. This aggressive investment is seen as crucial to maintaining a competitive edge in cloud computing and AI services, areas that are driving much of the company’s growth.
Cost Management. Despite the heavy spending on AI, Microsoft is also focused on controlling costs. The company is reportedly planning to trim thousands of jobs, particularly in sales, to offset rising expenses and protect profit margins. This follows earlier workforce reductions and reflects a broader trend among major tech firms to optimize operations amid escalating AI-related costs.
Diversified Revenue Streams. Microsoft’s strong position in software, cloud computing, and AI, along with its subscription-based business model and consistent dividend growth, have bolstered investor sentiment. The company’s cloud platform Azure and productivity tools continue to show strong adoption across industries.
Market and Analyst Sentiment
Microsoft’s market capitalization recently reached $3.55 trillion, with a price-to-earnings ratio of 36.94, indicating high investor expectations for future growth. Analysts’ price targets for MSFT range from $432 to $700, suggesting a wide spectrum of views but generally positive long-term sentiment.
Competitive and Operational Challenges
Despite its strong performance, Microsoft faces competitive pressures, particularly from OpenAI, which has been offering discounted ChatGPT subscriptions, impacting Microsoft’s own AI products like Copilot. Additionally, negotiations with OpenAI over continued access to its technology have reportedly stalled, introducing some uncertainty into Microsoft’s AI strategy.
Technical challenge and summary
While Microsoft shares have recently hit record highs, driven by aggressive AI investment, disciplined cost management, and strong core business performance, it robustly helped to all the Technology sector came back to 6-month key resistance after nearly 40 percent recovery rally.
While the market faces different challenges, we keep our strategic focus on next positions and further stock market development.
--
Best wishes,
@PandorraResearch Team 😎

Tesla-Heading For A New ATH?NASDAQ:TSLA is looking good!
Robo-Taxi, Optimus Robots...and so more to come!
Tesla to $692 in the next years? Or months?
#stocks #tesla #stockmarket

Broadcom - This was just the first all time high!Broadcom - NASDAQ:AVGO - just created new highs:
(click chart above to see the in depth analysis👆🏻)
Over the course of the past three months, Broadcom has been rallying an impressive +80%. However looking at market structure, all of the previous "dump and pump" was not unexpected. Following this recent bullish strength, Broadcom is likely to channel a lot higher.
Levels to watch: $250, $400
Keep your long term vision!
Philip (BasicTrading)

Amd - This is just the beginning!Amd - NASDAQ:AMD - perfectly plays out:
(click chart above to see the in depth analysis👆🏻)
Despite the harsh drop of about -65% which we have been witnessing starting back in 2024, Amd remains bullish. Just three months ago, Amd retested a textbook confluence of support. We saw bullish confirmation, the bottom is in and Amd will rally significantly from here.
Levels to watch: $200, $300
Keep your long term vision!
Philip (BasicTrading)

Canadian Dollar vs. US Dollar. The Spring Is Compressing.In previous posts, we have already begun to look at the key drivers of the US outperformance over the past decade.
The US market dominance has been largely driven by the rapid rise of tech giants (such as Apple, Microsoft, Amazon and Alphabet), which have benefited from strong profit growth, global market reach and significant investor inflows.
Unsatisfactory International Performance
Markets outside the US have faced headwinds including multiple stifling sanctions and tariffs, slowing economic growth, political uncertainty (especially in Europe), a stronger US dollar and the declining influence of high-growth tech sectors.
The Valuation Gap
By 2025, US equities will be considered relatively expensive compared to their international peers, which may offer more attractive valuations in the future.
Recent Shifts (2025 Trend)
Since early 2025, international equities have begun to outperform the S&P 500, and European and Asian equities have regained investor interest. Global market currencies are also widely dominated by the US dollar.
Factors include optimism around the following three big themes.
DE-DOLLARIZATION. DE-AMERICANIZATION. DIVERSIFICATION.
De-dollarization is the process by which countries reduce their reliance on the US dollar (USD) as the world's dominant reserve currency, medium of exchange, and unit of account in international trade and finance. This trend implies a shift away from the central role of the US dollar in global economic transactions to alternative currencies, assets, or financial systems.
Historical context and significance of the US dollar
The US dollar became the world's primary reserve currency after World War II, as enshrined in the Bretton Woods Agreement of 1944. This system pegged other currencies to the dollar, which was convertible into gold, making the dollar the backbone of international finance. The United States became the world's leading economic power, and the dollar replaced the British pound sterling as the dominant currency for global trade and reserves.
The dollar has been the most widely held reserve currency for decades. As of the end of 2024, it still accounts for about 57% of global foreign exchange reserves, far more than the euro (20%) and the Japanese yen (6%). However, this share has fallen from over 70% in 2001, signaling a gradual shift and prompting discussions about de-dollarization.
How De-Dollarization Works
Countries looking to reduce their reliance on the dollar are pursuing several strategies:
Diversifying reserves: Central banks are holding fewer U.S. dollars and increasing their holdings of other currencies, such as the euro, yen, British pound, or new alternatives such as the Chinese yuan. While the yuan's share remains small (about 2.2%), it has grown, especially among countries like Russia.
Using alternative currencies in trade: Countries are entering into bilateral or regional agreements to conduct trade in their own currencies rather than using the dollar as an intermediary. For example, China has introduced yuan-denominated oil futures (the "petroyuan") to challenge the petrodollar system. Increasing gold reserves: Many countries, including China, Russia and India, have significantly increased their purchases of gold as a safer reserve asset, reducing their dollar holdings.
Developing alternative financial systems: Some countries and blocs, such as BRICS, are working to develop alternatives to the US-dominated SWIFT payment system to avoid the risk of sanctions and gain true economic and political independence.
Reasons for de-dollarization
The move towards de-dollarization is driven by geopolitical and economic factors:
Backlash against US economic hegemony: The US often uses dollar dominance to impose sanctions and exert political pressure, encouraging countries to seek financial sovereignty.
Rise of new economic powers: Emerging economies like China and groups like the BRICS are seeking to reduce their vulnerability to U.S. influence and promote regional integration and alternative financial infrastructures.
Geopolitical tensions: Conflicts like the war in Ukraine have intensified efforts by countries like Russia to remove the dollar from their reserves to avoid sanctions.
Implications and outlook
While the dollar remains dominant, a more de-dollarized world is already changing global economic power. The U.S. may lose some advantages, such as lower borrowing costs and geopolitical influence. For the U.S. economy, de-dollarization could lead to a weaker currency, higher interest rates, and reduced foreign investment, although some effects, such as inflation from a weaker dollar, could belimited .
For other countries, de-dollarization could mean greater economic independence and less exposure to U.S. policy risks. However, no currency currently matches the dollar’s liquidity, stability, and global recognition, so a full transition is unlikely in the near future .
Summary
De-dollarization is a complex, ongoing process that reflects a gradual shift away from the global dominance of the U.S. dollar. It involves diversifying reserves, using alternative currencies and assets, and creating new financial systems to reduce dependence on the dollar.
Driven by geopolitical tensions and the rise of emerging economic powers, de-dollarization challenges the entrenched role of the dollar but is unlikely to completely replace it anytime soon.
Instead, it is leading to a more multipolar monetary system in international finance, increasing demand for alternative investments to the U.S.
Technical task
The main technical chart is presented in a quarterly breakdown, reflecting the dynamics of the Canadian dollar against the US dollar FX_IDC:CADUSD in the long term.
With the continued positive momentum of the relative strength indicator RSI(14), flat support near the level of 0.70 and a decreasing resistance level (descending top/ flat bottom) in case of a breakout represent the possibility of price growth to 0.80, with the prospect of parity in the currency pair and strengthening of the Canadian dollar to all-time highs, in the horizon of the next five years.
--
Best wishes,
Your Beloved @PandorraResearch Team 😎

Nvidia - 100% new all time highs!Nvidia - NASDAQ:NVDA - is just too bullish now:
(click chart above to see the in depth analysis👆🏻)
Honestly it was not unexpected that Nvidia is now the most valuable company in the world. The chart is just so strong and perfectly following structure; it seems to be just a matter of days until Nvidia will create a new all time high. If this happens, a breakout rally will follow.
Levels to watch: $150
Keep your long term vision!
Philip (BasicTrading)

Nasdaq: Bull flag breakout on daily chart, testing ATHsBeen a while since I last posted. So figured I'd share this quick chart. Market undoubtedly have been incredibly volatile this month. However luckily, the Nasdaq has been forming bull flag on the daily chart. This follows a strong prior uptrend. The breakout took place today, sending the index to test ATHs.
Notable stocks making a move are names like NASDAQ:AMZN and NASDAQ:NVDA , mainly due to the broader market strength. Other indices, such as the S&P 500 ( SP:SPX ) also are breaking out as they form a similar bull flag pattern.
At ATHs, this is a deciding factor of where the market goes next. Either it bounces off to near-term support, or the market rallies to a new all-time high until next cooldown.
Note: not financial advice

Meta Platforms - This stock tastes sooo good!Meta Platforms - NASDAQ:META - will print a new all time high:
(click chart above to see the in depth analysis👆🏻)
Over the course of the past two months, Meta has been rallying +40%. This recent behaviour was not unexpected at all but rather the consequence of the all time high break and retest. Now - back at the previous all time high - Meta will most likely break out higher again.
Levels to watch: $700, $900
Keep your long term vision!
Philip (BasicTrading)

NRB Bearing Limited - 290 CMP Short-term Looking good for 100%+Good Buy For Short- Term 1 Year Investment Horizon.
NRB Bearing Limited - 290 CMP
Expected Return - 580 (100)%
Drawdown - 205 (35%)
*This POST for educational purpose only. Concern your advisor before investing in market related instrument...*
- AB_INV_7

ZETA: when a wedge isn’t just a wedge — it’s a launchpadTechnically, this setup is textbook clean. Price completed the fifth wave within a falling wedge and instantly reacted with a bullish breakout. The expected breakdown didn’t happen — instead, buyers stepped in, confirmed by rising volume. All EMAs are compressed at the bottom of the structure, signaling a clear shift in momentum. The volume profile shows strong accumulation around $14, while the area above current levels is a vacuum — ideal conditions for acceleration.
The key resistance zone is $16.70–17.20 — former base highs and the 0.236 Fibonacci retracement. If price breaks this area with volume, the next stop is likely $24.48 (0.5 Fibo). Classical wedge targets land at $38.28 and $55.33 (1.272 and 1.618 extensions). If a trending leg begins, it could move fast — because there’s simply no supply overhead.
Fundamentals:
ZETA isn’t a profitable company yet, but it shows consistent revenue growth and aggressive expansion. Capitalization is rising, debt is manageable, and institutional interest has increased over recent quarters. In an environment where tech and AI are regaining momentum, ZETA could be a speculative second-tier breakout candidate.
Tactical plan:
— Entry: market or after a retest of $14.00–14.30
— First target: $17.20
— Main target: $24.48
— Continuation: $38.28+
— Stop: below $13.00 (bottom wedge boundary)
When the market prints a wedge like this and the crowd ignores it — that’s often the best trap setup. Only this time, it’s not for retail buyers. It’s for the shorts. Because when a falling wedge breaks to the upside with volume — it’s time to buckle up.

Micron Technology - Starting the next +80% move!Micron Technology - NASDAQ:MU - perfectly respects structure:
(click chart above to see the in depth analysis👆🏻)
Starting back in mid 2024, Micron Technology created the expected long term top formation. We witnessed a correction of about -60%, which ultimately resulted in a retest of a confluence of support. So far, Micron Technology rallied about +60%, with another +80% to follow soon.
Levels to watch: $150, $180
Keep your long term vision!
Philip (BasicTrading)

Nasdaq - This starts the next +50% rally!Nasdaq - TVC:NDQ - might break out soon:
(click chart above to see the in depth analysis👆🏻)
Despite the quite harsh correction of about -25% which we saw in the beginning of 2025, the Nasdaq is clearly heading for new all time highs. It sounds almost incredible but if the Nasdaq breaks above the current confluence of resistance, a breakout rally of +50% will follow thereafter.
Levels to watch: $21.500, $33.000
Keep your long term vision!
Philip (BasicTrading)

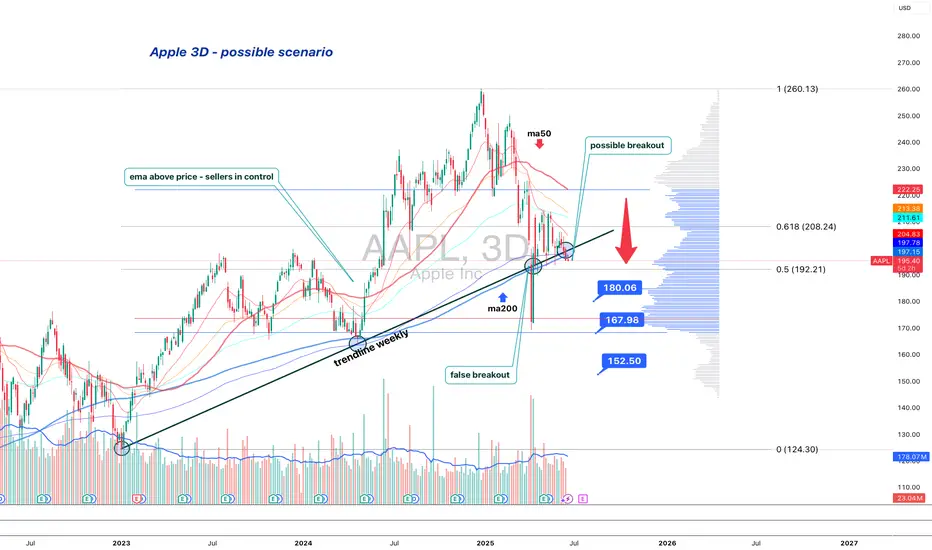
Apple is standing at the edgeApple (AAPL) is losing its long-term structure — second retest of the broken trendline suggests a bearish setup
On the 3D chart, Apple shows signs of structural breakdown. The weekly trendline from 2023 was broken and retested — twice. The price failed to regain it and now trades below, with candles showing weakness: low body closes, upper wicks, and no upside follow-through.
MA200 is now above price, and all EMAs are turning down. Volume Profile shows a heavy resistance block near $197. If the price remains below, sellers are in control.
Key levels:
— $192.20 = 0.5 Fibo support.
— Breakdown ➝ targets: $180 → $167 → $152.
Fundamentals:
Apple's recent reports show decelerating growth, weak China demand, and compressed margins. While AI buzz supports sentiment, institutional flow suggests distribution. BigTech may be topping out, and Apple is positioned for pullback.
Strategy:
Short below $196 with confirmation. Stop: $198. Targets: $180 / $167 / $152.
Failure to reclaim $192–197 = broken trend confirmed.
This is not a growth setup. This is where trends end — and profit-taking begins.
What's Nifty Next?With rising tensions between countries, market sentiment is becoming increasingly cautious. This geopolitical uncertainty is likely to weigh heavily on investor confidence in the coming weeks.
Based on the current scenario, a realistic target for Nifty seems to be around 21,000 by July, especially if the negative sentiment continues and foreign institutional investors (FIIs) remain net sellers. Global cues, crude oil prices, and currency fluctuations could further impact the index's performance.
📌 However, if by any chance Nifty manages to close above 25,500, it would indicate an extremely strong bullish breakout, defying current market fundamentals. Given the present conditions, this seems highly unlikely, unless there is a sudden positive catalyst such as:
A major resolution in geopolitical issues
Strong corporate earnings
Aggressive policy support from the government or RBI
🧠 My Take:
For now, it’s wise to remain cautious and watch key support/resistance levels. Volatility may remain high, and short-term traders should manage their positions carefully.
💬 Let me know your thoughts in the comments below. Do you think 21k is coming soon, or can the bulls surprise us all?

Meta Platforms - The rally is clearly not over!Meta Platforms - NASDAQ:META - can rally another +30%:
(click chart above to see the in depth analysis👆🏻)
Some people might say that it seem counterintuitive to predict another +30% rally on Meta Platforms while the stock has been rallying already about +750% over the past couple of months. But price action and market structure both tell us, that this will soon turn into reality.
Levels to watch: $850
Keep your long term vision!
Philip (BasicTrading)

Amd - This starts the next +200% rally!Amd - NASDAQ:AMD - is preparing a major rally:
(click chart above to see the in depth analysis👆🏻)
It has - once again - not been unexpected at all that we now see a major reversal rally on Amd. After the harsh drop of about -65%, Amd retested a significant confluence of support and already created bullish confirmation. It is quite likely that this now starts the next bullrun.
Levels to watch: $100, $300
Keep your long term vision!
Philip (BasicTrading)
