Intel - Reversing to the upside!Hello Traders and Investors, today I will take a look at Intel .
--------
Explanation of my video analysis:
On the chart of Intel there are actually two major horizontal structure levels which you have to keep an eye on. First of all there is quite strong support at the $26 level and just a couple of months ago Intel rejected this support towards the upside. Vice versa there is resistance at the $44 level, always pushing price lower. As we are speaking Intel is also retesting a minor support so there is the chance to capitalize on a short term bounce.
--------
Keep your long term vision,
Philip (BasicTrading)
Stockmarketanalysis

ASIR.N0000📈 Stock ASIR closed at 23.9 on 31/05/2024
🔹 Resistance Level: 25
🔹 200 EMA: 24.8
🔹 Last Friday's candle: Pin Bar
The recent pin bar candle suggests a potential reversal, with the 200 EMA acting as a significant resistance level at 24.8. Keep an eye on this stock as it approaches the 25 resistance level.
Disclaimer: The information and analysis provided in this publication are for educational purposes only and should not be construed as financial advice or recommendations to buy, sell, or hold any securities. The author and TradingView are not responsible for any investment decisions made based on the content presented herein. Always consult a financial professional before making any investment decisions.

Intuitive Surgical (ISRG) Analysis Market Leadership:
Intuitive Surgical NASDAQ:ISRG , the leader in robotic-assisted surgery with its da Vinci system, is poised for substantial growth. The increasing adoption of robotic surgeries, currently under 5% of potential procedures, presents a significant opportunity. Additionally, the aging global population boosts demand for minimally invasive surgeries, favoring Intuitive Surgical's market position.
Analyst Projections:
Analysts project a median upside of 13% to 25% over the next year. For investors seeking steady returns and a strong healthcare business with a solid competitive moat, ISRG is an excellent choice.
Investment Outlook:
Bullish Outlook: We are bullish on ISRG above the $350.00-$355.00 range.
Upside Potential: With a target set at $540.00-$550.00, key growth drivers include the ongoing adoption of robotic surgeries and favorable demographic trends.
📊🤖 Monitor Intuitive Surgical for promising investment opportunities! #ISRG #RoboticSurgery 📈💼

Alibaba - Don't forget chinese stocks!Hello Traders and Investors, today I will take a look at Alibaba.
--------
Explanation of my video analysis:
Back in 2020 Alibaba stock created a textbook breakout of an ascending triangle formation which was followed by more continuation towards the upside. Then Alibaba stock topped out in 2021 and we saw a massive decline of -80% from the previous highs. At the moment Alibaba is still in a very bearish market but there is a chance that we will see a reversal in the near future.
--------
Keep your long term vision,
Philip (BasicTrading)

Tesla - Triangle and -33% drop!Hello Traders and Investors, today I will take a look at Tesla .
--------
Explanation of my video analysis:
With Tesla stock breaking above previous resistance in 2019 and coming back to retest it in 2020, this stock then took off and created one of the most insane rallies which I have ever seen. At the moment though, Tesla is consolidating in a descending triangle formation and there is a high chance that Tesla will again come back to retest the lower support at $110 for a third time.
--------
Keep your long term vision,
Philip (BasicTrading)

💻💡 GigaCloud Technology (GCT) Analysis 📊🔍Strategic Acquisitions:
GigaCloud Technology NASDAQ:GCT , a B2B e-commerce solutions provider, recently completed two significant acquisitions: Noble House Home Furnishings' assets for $85 million and Wondersign, a digital signage company, for $10 million. These strategic moves are expected to significantly enhance GigaCloud's revenue and margins.
Leadership Highlights:
CEO Larry Wu emphasized the company's adaptability and strong profitability. Notably, GigaCloud Marketplace's gross merchandise volume surged by 40.8% year-over-year to $684.8 million. Active buyers increased by 9.6%, and spend per buyer rose by 28.5% to $148,793.
Investment Outlook:
Bullish Outlook: We hold a bullish stance on GCT above the $29.00-$30.00 range.
Upside Potential: With a target set at $58.00-$60.00, investors should closely monitor key performance indicators such as growth in merchandise volume and the successful integration of acquisitions.
📈💻 Stay informed about GigaCloud Technology's progress for potential investment opportunities! #GCT #EcommerceSolutions 📊🔍

🍔📈 Shake Shack (SHAK) Analysis 🌍🔍Strong Performance:
Shake Shack NYSE:SHAK , a growing restaurant chain, ended 2023 on a high note with successful sales strategies and margin expansion. CEO Randy Garutti highlighted the opening of 41 new U.S. restaurants and 44 international locations, including in Thailand and the Bahamas. Despite inflationary pressures, same-store sales saw a 2.8% year-over-year increase.
Expansion Potential:
With the Federal Reserve potentially maintaining or lowering interest rates, Shake Shack could see further expansion in 2024. With 518 locations (334 in the U.S.) at the end of 2023, there is significant growth potential. While it may not reach the size of McDonald's, it could approach Five Guys' nearly 1,500 U.S. locations, potentially quadrupling its current count.
Investment Outlook:
Bullish Outlook: We are bullish on SHAK above the $87.00-$88.00 range.
Upside Potential: With an upside target set at $145.00-$150.00, investors should monitor sales growth and expansion efforts as key performance drivers.
📊🍔 Keep a close watch on Shake Shack's growth for promising investment opportunities! #SHAK #RestaurantGrowth 🌍📈

NASDAQ (US100): Possible scenarios NASDAQ is the strongest index in comparison to S&P500 and Dow Jones.
If the price wants to move lower, it should stay below the inversion, if it happens then we can target the previous week's low and sell-side liquidity, but if the price breaks the inversion we will see the new all-time high again.
💡Wait for the update!
🗓️27/05/2024
🔎 DYOR
💌It is my honor to share your comments with me💌

Nvidia - Earnings, Channel, $1.000!Hello Traders and Investors, today I will take a look at Nvidia .
--------
Explanation of my video analysis:
If you are objectively looking at the stock chart of Nvidia, you can see that Nvidia is currently trading in a solid rising channel formation. But as we are speaking, Nvidia is retesting the upper resistance and considering that we just saw a rally of +700% without any real correction, it is quite likely that we will see at least a short term bearish rejection from here.
--------
Keep your long term vision,
Philip (BasicTrading)

Stock Market Outlook For 2nd Half of 2022 & 2023we could see another rebound in 2nd half of this year due to easing inflation rate.
july is uncertain.


Trading Insight: Bombay Burma (NSE: BBTC) SharesI always use a 200-period EMA and RSI with a 200-period. An RSI above 50 indicates bullish strength in the EMA. Let's analyze Bombay Burma (NSE: BBTC) shares. Based on the chart and the April 25, 2024, closing price of 1578.90 , the best buy is below 1553 . The stop loss is set at 1321.60 , with a probable target of 2107.00 . This setup offers a risk-reward ratio of nearly 1:2.40.

🍌🍌 SUPERMICRO — AI INFRASTRUCTURE STOCKS GO BANANA Supermicro is an American company, a major manufacturer of motherboards, cases, power supplies, cooling systems, SAS controllers, Ethernet and InfiniBand. The company specializes in the production of x86-server platforms and various components for servers, workstations and data storage systems. The headquarters is located in San Jose, USA. Founded in 1993.
Supermicro, Inc., a provider of end-to-end IT solutions for cloud computing, artificial intelligence/machine learning, storage, and 5G/Edge communications, continues to expand its data center portfolio with NVIDIA end-to-end rack cabinet solutions HGX H100 equipped with liquid cooling systems.
Supermicro's advanced liquid cooling technologies help reduce time-to-commissioning, improve performance levels, and reduce data center operating costs while dramatically reducing energy efficiency.
It is estimated that when using Supermicro liquid cooling systems (compared to air-cooled data centers), data centers save up to 40% in terms of power costs. In addition, direct cooling costs can be reduced by up to 86% compared to existing data centers.
"Supermicro continues to lead the industry by meeting the ever-growing needs for AI systems and modern data centers around the world," said Charles Liang, President and CEO of Supermicro.
AI-optimized racks powered by Supermicro's latest product lines, including server product lines from AMD, can be quickly created from standard engineering templates and easily customized to meet unique user requirements.
The ultra-modern GPU liquid cooling server includes dual processors from NASDAQ:INTC or NASDAQ:AMD and four or eight interconnected NVIDIA ( NASDAQ:NVDA ) HGX H100 Tensor Core GPUs.
The use of liquid cooling systems can reduce the energy consumption of data centers by up to 40%, which in turn leads to lower operating costs.
In addition, both systems significantly outperform previous generation NVIDIA HGX GPU-powered solutions, delivering up to 30x performance gains and improved efficiency of today's Transformers with faster connections between GPUs and networks and storage built with PCIe 5.0 standard.
The technical picture illustrates the possibility of continued explosive growth in Supermicro shares, which are up more than 160 percent since the beginning of the year.

SPX: And Mrs. Market says not yet!!Well, my previous idea for a higher degree wave 4 got busted! Market is not ready to be bearish just yet. On Friday we got a breakout from the trendline resistance and retest. Next week we should expect a move upwards toward the next resistance at 5402. However, it seems like Market is poised to run towards the 1.236 fib extension of waves AB which is also around the 0.618 fib extension of Primary waves 1 and 2. If the contracting diagonal theory is correct, then that would be an area of interest to see the market turn for a bigger correction. If market decides to blow through those levels, then we need to rethink this whole count and maybe get even more bullish. For now, still looking for a higher degree top and a good 25%-30% correction in the next few months.

🏥💡 Oscar Health (OSCR) Analysis 📈🔍Market Disruption:
Oscar Health NYSE:OSCR is at the forefront of revolutionizing the health insurance industry through technological innovation, significantly enhancing market reach and member experience.
Expansion Plans:
In 2024, Oscar Health aims to introduce new technology-enabled plans across 165 new counties spanning 11 states. These initiatives prioritize accessibility, affordability, and personalized member experiences, aimed at driving premium growth.
Innovative Programs:
The company's +Oscar program, catering to 500,000 lives, fosters improved healthcare access and quality through innovative partnerships, such as the collaboration with Stanford Health Plan.
Investor Sentiment:
Bullish sentiment surrounds OSCR, with long positions taken by sell-side firms and institutional investors like The Vanguard Group and Millennium Management LLC. Upgraded price targets from Bank of America Securities and Wells Fargo further bolster this positive sentiment.
Robust Performance:
OSCR's performance demonstrates strength, including a remarkable 40% year-over-year increase in total health plan membership, reaching 1.44 million, and a substantial 46% revenue growth to $2.1 billion in the latest quarter.
CEO Endorsement:
CEO Mark Bertolini highlighted strong membership retention, an increased Net Promoter Score (NPS) of 60%, and improved core ratios during the latest earnings call, further affirming OSCR's positive trajectory.
Investment Outlook:
Bullish Outlook: Given these positive indicators, a bullish stance on OSCR above $16.50-$17.00 appears justified.
Upside Potential: With an upside target set at $34.00-$35.00, OSCR's growth potential in the health insurance market is poised for significant expansion.
📊🔍 Stay attuned to Oscar Health's progress for potential investment opportunities! #OSCR #HealthInsurance 🏥💼

Meta Platforms 33-Days Cyclical price patternThere are many ways to make money with stocks. You can buy well-managed companies with growing earnings, hold them for years and watch the stock prices rise as the company succeeds. This conservative investing style sometimes rewards investors with huge long-term gains. For example, early investors in Microsoft or Bitcoin saw their investments grow MultiX in a decade.
This is what patient long-term investors dream about. But more often buy-and-hold investors don't hit the jackpot; rather they realize more modest returns.
Another investing style is to trade stocks very frequently with the help of computer programs that buy and sell shares of selected companies. Here traders make small profits or losses on many trades minute after minute. If you like lots of action while you're glued to a computer screen, this investing style might be for you.
Cyclical Price Pattern - An Opportunity to Make Money
And then there is every imaginable money making scheme that falls between the above two styles. You can buy mutual funds, exchange-traded funds, index funds, buy and sell individual stocks, time the market, buy on margin, sell short, buy and sell options, reinvest dividends, or some other variation on the theme. Talk with fellow investors and everyone has their own tailor-made approach to investing.
This article is about one investing style - buying and hold Meta Platforms (META) shares using Cyclical price pattern.
It's a style that I use and I know it makes money.
Buying cyclical stocks for a profit at certain points is a huge challenge but with commitment, multi-year trading experience and the proper technical tools you can consistently make money over your investing career.
Cyclical price pattern is very simple to understand. A single cycle has an upside during which prices rise to a peak and a downside or cooling off when prices fall to a bottom.
Based on this cyclical price pattern, I expect further upside price action in Meta Platforms stock, somewhere until National Unicorn Day.
Days to go: 33.

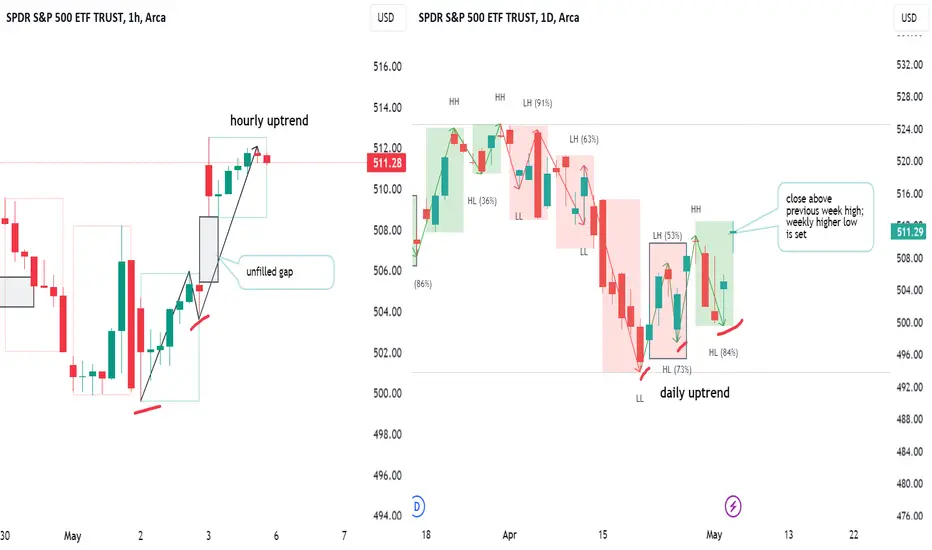
S&P Bulls prove their controlThe strong close last week indicates a shift in control to the buyers. They managed to close above the previous week’s high, establishing a weekly higher low and confirming the daily uptrend. Currently, the bulls have control across all key timeframes: the price is trending upward on the hourly, daily, weekly, and monthly charts. The only challenge they face is on the monthly timeframe, where bears have initiated consolidation; however, this is not a critical issue.
It's plausible that the bulls might either retrace the entire bearish wave or, more likely, close May as an inside bar, setting a price equilibrium that could persist throughout the summer. Given this scenario, the current position might not be ideal for a long entry since we are in the middle of April’s range. If you're considering buying, it would be wiser to wait for a pullback that could provide a more favorable opportunity.
Disclaimer
I don't give trading or investing advice, just sharing my thoughts.
Nifty 50 within the Channel. Trend Analysis for short term TradeNifty 50 is currently trading within a Channel. This analysis suggests a short-term or swing trade approach. As the market is currently trending downward, consider using Trend Continuation technic and Fibonacci Retracement for your trading strategy.

JKH.N0000 - Key fib levels in monthly chartJKH is consolidating in golden pocket now. It should close above golden pocket to keep bullish momentum.In next few months, Next support will be around 0.5 fib level and resistance will be 0.718
Disclaimer: The information and analysis provided in this publication are for educational purposes only and should not be construed as financial advice or recommendations to buy, sell, or hold any securities. The author and TradingView are not responsible for any investment decisions made based on the content presented herein. Always consult a financial professional before making any investment decisions.

Nasdaq - Shifting back bearish?Hello Traders and Investors, today I will take a look at the Nasdaq.
--------
Explanation of my video analysis:
For over a decade the Nasdaq has been trading in a pretty obvious rising channel formation. We saw the last retest of support in 2022 which was followed by an enormous +70% rally towards the upside. Considering that the Nasdaq is now retesting the upper resistance, there is a quite high chance that we will see at least a short term correction lower before the Nasdaq will follow its overall uptrend.
--------
Keep your long term vision,
Philip (BasicTrading)

📈🚀 Robinhood (HOOD) Growth Analysis 📊💰User Growth Momentum:
NASDAQ:HOOD demonstrates impressive user growth driven by strategic promotions and incentives, solidifying its position with 23.6 million funded accounts as of February.
Institutional Investor Appeal:
Initiatives like the 3% match on IRA contributions attract institutional investors, boosting assets under custody to $118.7 billion.
Revenue Diversification:
Subscription revenue, particularly from Gold membership, saw a 25% increase in Q4 and is expected to rise further with continued advertising and promotions.
Trade Projection:
Bullish stance above $14.50-$15.00.
Upside target of $28.00-$30.00 reflects potential growth and value appreciation as Robinhood expands its user base and revenue streams.
📈💡 Stay tuned for HOOD's growth trajectory! #Robinhood #FinancialIndustry 🚀📊

🛢️💡 CNX Resources (CNX) Strategic Initiatives 📈🚀Market Adaptation Strategy:
CNX partners with NuBlu Energy to innovate CNG and LNG production, enhancing efficiency and market reach, showcasing adaptability to natural gas dynamics.
Supply Management Approach:
To address oversupply, NYSE:CNX reduces production and delays activities, demonstrating strategic flexibility in response to market conditions.
Market Outlook:
Analysts anticipate natural gas price stabilization in Q1 2024, with seasonal demand upticks favoring CNX's stock.
Trade Projection:
Bullish stance above $21.00-$22.00.
Target price of $31.00-$32.00 reflects potential stock appreciation as CNX optimizes operations and market conditions improve.
📈🔍 Stay tuned for CNX's operational developments! #CNXResources #NaturalGasMarket 🌐📊

JP Morgan Chase & Co. Hitting The Top The JPMorgan Chase CEO's WSJ was interviewed recently with Wall Street Journal Editor-in-Chief Emma Tucker, for a range of topics.
JPMorgan Chase & Co. Chief Executive Jamie Dimon ranked geopolitics as his top worry and said he's less optimistic about a soft landing than Wall Street in an interview on Thursday.
While Wall Street seems to be betting of a roughly 70% chance of avoiding a recession in a so-called soft landing in the economy, Dimon said he sees the odds about half that.
The green economy, the remilitarization of the world, fiscal deficits and geopolitics are all factors that could keep inflation higher for longer, he said.
"When I look at the range of possible outcomes, you can have that soft landing," Dimon said. "I'm a little more worried it may not be so soft and inflation may not quite go away as people expect. I'm not talking about this year - I'm talking about 2025 or 2026."
While the economy continues to do well for the majority of Americans due to low employment, rising home values and stronger stock prices, the threat of slow growth and inflation - stagflation - from roughly 45 to 50 years ago could return.
"It looks a little bit like the 70s to me," Dimon said. "Things looked pretty rosy in 1972. They were not rosy in 1973. Don't get lulled into a false sense of security."
Dimon said he has "enormous respect" for Jerome Powell when asked whether the Fed chairman is doing a good job as the central bank signals that it's not in a hurry to cut interest rates.
"I think the Fed was probably late in raising rates," Dimon said. "They caught up. They're probably right in watching right now. We don't know what's going to happen. They might as well wait."
Dimon declined to state a preference in presidential candidates and said the bank would work with whomever is in the White House.
Biden's economic policies are working "partially," he said, party due to the huge amounts of economic stimulus such as the Bipartisan infrastructure bill, which Dimon praised.
But the bottom 20% of wage earners in the U.S. continues to struggle.
"If you go to rural America, or inner cities, I'm not sure they feel they're being lifted up by this economy," he said.
He avoids social media but said he pulls up popular destinations such as TikTok once a year to see what's happening on them.
"I am not a fanatic on the phone....I think people should spend a little less time on that and a little more time thinking," Dimon said. "I'm not on any social media."
In technical terms, JPMorgan Chase's stock (JPM) has risen 14.43% so far in 2024 (compared to a 7.48% gain by the S&P500), hit the Upper side of Long-Term upside channel near $200 per share, able to further technical declines.
