HDFCBANK Long Term AnalysisWe expect that the price will increase. After neckline of inverse head & shoulders, the price have started to increase as expected. RSI is overbought therefore we expect the price to pull back and test the support which would be our entry for long,
Moreover, Gator shows us that the price will increase.
Stop loss below the neckline of the pattern.
The target level is shown in the chart.
Stockmarketanalysis

BUY oppertunity for TIME TECHNOPLAST hey guys ,
TIME TECHNOPLAST stock was moving in a uptrend in a fixed area
and now this stock has touched it's support area and made a candle called
A MORNING STAR
i have marked the RR RATIO for you ,
you can see the target and sl by zooming in the above image
RR RATIO is 3:1
try to trade according to that ratio or adjust it accordingly to you
TIME TECHNOPLAST 😀😀

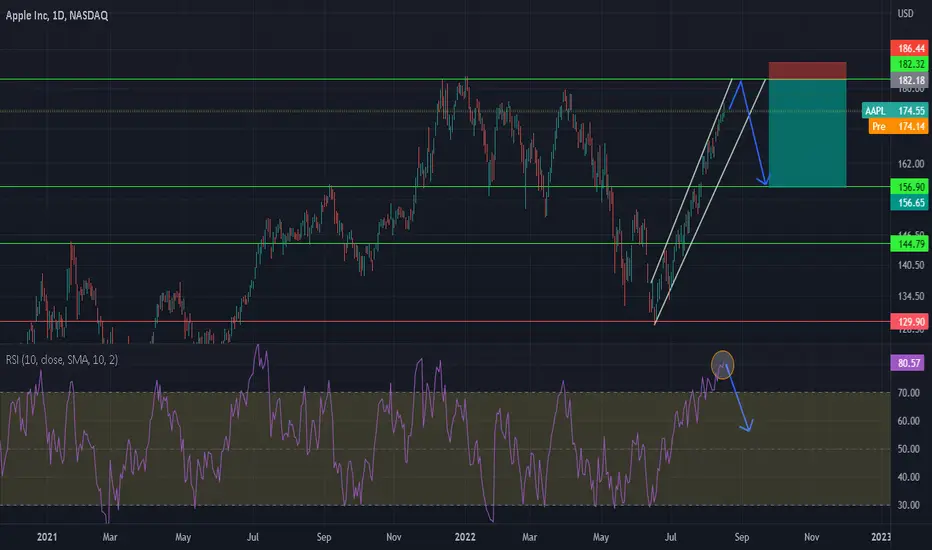
APPLE Short Position (NEW)We expect that the price will increase to the 180 price levels and then the price will drop to the 160 price levels. RSI is overbought. On 4h we can see that potential bearish divergences forming , but we still wait for bearish divergences on 1D timeframe to get more confirmation which may come at the key resistance.
Entry, stop-loss, and target levels are in the chart.
spx500Hello everyone,
We have a very clear 3 wave structure here that has extended the 3rd over the 1.618% fib extension after breaking up from the ending diagonal in the intermediate 4th wave position. I wouldn't expect SP500 to fill the 3,800 or 3,600 gap anytime soon guys. So I think 4,000 or maybe , possibly over shot 3,900 worst case IMO. The 1 fib level will likely hold as strong support, but let's see.
We also know our buddy Jim Crammer is bearish, so there's that...

SPX Daily TA Neutral BullishSPXUSD Daily neutral with a bullish bias. Recommended ratio: 55% SPX, 45% Cash.
* The Fed Minutes confirmed preexisting knowledge that inflation is still the primary concern for the economy (making this release a low impact event) and that more downsizing of the Fed balance sheet + another 50bps is the baseline scenario for the next FOMC meeting on 09/21. Fed Staff (FOMC) agreed that 3.4% is the current peak target rate for FFR, the current range is 2.25%-2.5% implying that perhaps two 25bp rate hikes will follow September's anticipated 50bps hike to end the year. Some participants (Fed members) commented on how commodities (primarily energy and food) are likely to keep inflation up in the near term, some Participants mentioned that the policy adjustments are already seeing a substantial effect but almost all agreed that most of the effects haven't been felt yet, and most participants agreed that they support rate hikes until PCE is closer to the 2% long-run target. July US Retail Sales stayed roughly the same as in June and posted ~0% change compared to estimates of 0.1% (sales are still up 9.2% from July 2021), this surprised many analysts who expected more spending with the recent significant reduction in gas prices. Key Upcoming Dates: S&P US August PMI at 945am EST on 08/23; US Q2 Final GDP Estimate at 830am EST 08/25; US July PCE at 830am EST 08/26; UofM Final August Sentiment Survey Index at 10am EST 08/26; Jackson Hole Economic Symposium on 08/25-08/27.*
Price is currently testing $4254 minor support after being rejected by the upper trendline of the descending channel from November 2021 + the 50 MA at ~$4325. Volume remains consistently Moderate and broke a three day streak of buyer dominance with a seller dominated close in today's session; this was a capitulation type of initial reaction which is indicative of a critical resistance. Parabolic SAR flips bearish at $4220, this margin is bearish. RSI is currently testing 68.42 support after forming a soft peak at 73. Stochastic is bearish and currently trending down at 87; it remains in the 'bullish autobahn zone' which is mildly bullish at the moment. MACD remains bullish but is beginning to trend sideways as it forms a soft peak just above the ATH (91.78) at 93.54; it has been bullish for 54 days now, implying that perhaps this is more than just a bear market rally. ADX is currently trending up at 31 as Price continues to push higher, this is bullish at the moment.
If Price is able to bounce here at $4254 minor support then it will likely retest the upper trendline of the descending channel from November 2021 + the 50 MA at ~$4300 as resistance . However, if Price loses $4254 minor support , it will likely retest $4175 support before potentially retesting the uptrend line from 06/16 at ~$4k psychological support. Mental Stop Loss: (one close below) $4226.

Buy HALO in US stock market 17/8/2022You can buy it Target 50.27 stop loss 41.24 money management is your responsibility . good luck

BUY Entry on SPX Retracement Situation
------------------------------------------------------------------
- SPX touched and rejected from Key Resistance
region @ 4150
- Elliot Wave 1 to 5 completed
- MACD overbought near 80; histogram
shows weakening buy momentum
Strategy
-----------------------------------------------------------
- LIKELY RETRACEMENT to pocket 38.2-61.8% fib retracement zones
- BUY @ 3850 to 4000
TP @ 4500
SL @ 3800 (Below first higher low of elliot wave
2 + 61.8% pullback level)
Otherwise, buy low and never sell if you are a long term investor like me :)
@GolDRoger

SP500 Pullback, Perfect LONG Entry!SPX near the key resistance level @4305 that it tried to break unsuccessfully 3 times on 25 April, 28 April and 5 May 2022. This subsequently led to a continuous bear run down to the lows of 3643.
I'm expecting at least a slight pullback/retracement from here @4305, back down to 4200 to find support at the 200 Day EMA.
Buy Zones: 4100 (100 Day EMA + Previous support) to 4200 (200 Day EMA)
Stop Loss @ 4066
Take Profit @ 4500

GEOThe crash from ATH's looks about finished, HTF ABC bullish correction. I would think we now impulse 5 up. If that turns into an A wave then there is much more pain. If we do 3 up here and only hit $10 then this would be an X wave and the price action did a fib extension 1 to 1 and would expect much more downside.

Buy ALKS in US stock market 15/8/2022You can buy it Target 28.36 stop loss 24.56 money management is your responsibility . good luck

BIOR Biora Therapeutics Options Ahead Of EarningsIf you haven`t bought the all time low:
Then looking at the BIOR Biora Therapeutics options chain, i would buy the $1.5 strike price Calls with
2022-10-21 expiration date for about
$0.13 premium.
Looking forward to read your opinion about it.

The deal closed CALM in US stock market with profitAlhamdulillah , The deal was closed on CALM in US stock market with a profit of 5.94 % in a 1 week . I wish good luck to everybody.

The deal closed WRB in US stock market with profitAlhamdulillah , The deal was closed on WRB in US stock market with a profit of 6.1 % in a 1 week . I wish good luck to everybody.

The deal closed BTU in US stock market with profitAlhamdulillah , The deal was closed on BTU in US stock market with a profit of 13.14 % in a 4 days . I wish good luck to everybody.

Bank of America Corp.: the instrument trades sidewaysNYSE:BAC
Current trend
The shares of Bank of America Corp., one of the US's largest banks and analytical agencies, are moving sideways around 33.00.
The downward dynamics of the asset are developing against the backdrop of investor pessimism regarding the recent Q2 report, which was one of the worst for the company: net profit fell by 33% and amounted to 6.2B dollars compared to 9.2B dollars a year earlier, EPS is at the level 0.73 dollars, well below 1.03 dollars a year earlier, while the corporation's revenue reached 22.69B dollars, down from 23.23B dollars a quarter earlier. The main disappointment for traders was that the division responsible for capital markets investments suffered a loss of 5.0%, which reduced revenue to 4.5B dollars. The new report, published on October 17, is expected to increase revenue to 23.51B dollars, while EPS could increase to 0.8011 dollars.
The next dividend payout is scheduled for September 30, and shareholders will receive 0.22 dollars per share, reflecting an average quarterly return of 2.66% per annum.
Support and resistance
n the global chart, the price has left the downwards channel and is preparing to continue its local growth. Technical indicators maintain a buy signal: Alligator's EMA oscillation range expands, fast EMAs are above the signal line, and the AO oscillator histogram trades in the positive zone, forming downward bars.
Resistance levels: 33.85, 37.34.
Support levels: 32.40, 30.00.
Trading tips
Long positions may be opened after the price rises and consolidates above 33.85 with the target at 37.34 and stop loss 32.00. Implementation period: 7 days or more.
Short positions may be opened after the price drops and consolidates below 32.40 with the target at 30.00. Stop loss — 33.00.
***All indicator readings and price values are historical data. Past price behavior is not a reliable indicator of future performance.

SPX Daily TA Cautiously BullishSPXUSD Daily cautiously bullish. Recommended ratio: 75% SPX, 25% Cash . *The BLS reported PPI numbers this morning and they followed in the footsteps of CPI by coming in lower than the month prior, from a 1% rise in June to a -0.5% drop in July. This was a surprise because consensus estimates had PPI rising by 0.2%, such a dramatic fall can largely be attributed to the 19% decline in national average retail gas prices since last month. Year over year, PPI registered its lowest rise from the 12 months prior at 7.6% (this is the lowest it's been since October 2021). This inflation data has markets believing that inflation has peaked and July's PCE numbers due on 08/26/22 will help to clarify whether the drawdown in inflation was largely due to a big pullback in gas prices. June's PCE numbers came in higher than estimates and, all things considered, the supply chain situation has only improved nominally which brings a bit of uncertainty regarding whether or not PCE will follow in the footsteps of CPI and PPI. Key dates next week: US Housing Starts and Building Permits at 830am EST 08/16; 5th GDPNow US Q3 GDP estimate at 915am EST 08/16 ; US Retail Sales at 830am EST 08/17.* Price is currently testing $4254 minor resistance (new resistance) after breaking out above $4175 resistance and flipping it to support (two consecutive closes above $4175). Volume remains Moderate and has favored sellers in three of the past four sessions even as Price is going higher, this is mildly bearish at the moment. Parabolic SAR flips bearish at $4109, this margin is mildly bearish. RSI is currently trending down at 67 after being rejected at 68.42 resistance, the next support is at 53. Stochastic is currently crossing over bullish at 91, the next resistance is max top while the next support is at 76. MACD remains bullish for a 48th consecutive session and is currently beginning to form a soft peak at 74, the next support (minor) is at 55 and the next resistance is the ATH at 91.78. ADX is currently trending up at 25 as Price is pushing higher, this is bullish. If Price is able to break out above $4254 minor resistance then the next likely target is a retest of the upper trendline of the descending channel from November 2021 at ~$4300 as resistance (which would probably coincide with the 200 MA). However, if Price is rejected here, it will likely formally retest $4175 support . Mental Stop Loss: (two consecutive closes) below $4175.

Buy CTRA in US stock market 10/8/2022You can buy it Target 30.85 and 33.5 stop loss 24.99 money management is your responsibility . good luck

This is Beautiful.. major levels marked.my bias is still bearish. coming this night us info data and guess whate we have a doji on daily time frame which I probably think will turn into evening star by tommorrow. so I will only trade the short position tomorrow if market went up I wont doing any trading tomorrow.
theres a chance we may have a trending and much volatile market tomorrow so dont forget to maintain your RRR traders.
BEST OF LUCK TRADERS.

WTIOil in a bit of trouble here, likely entering a 6-10 month bear market correction. Downside target can hit the 618% of the entire 5 moves off the 2020 lows when WTI went negative.
Currently a lower time frame A wave has bounced off the 618% fib retracement level of the 5th wave. But we must correct that entire 5 up not just the 5th wave. We should bounce into a B wave soon on the daily
before making the larger C wave down close to $80. After that The HTF weekly A wave is complete and bounce again into HTF weekly B wave before finally nuking to $50 wave C to complete the entire move. You better BTFD IMHO guys because after this is done oil prices likely to run back turbo over $130.

Buy BTU in US stock market 9/8/2022You can buy it Target 22 and 24.74 stop loss 17.5 money management is your responsibility . good luck

SPX Daily TA Neutral BearishSPXUSD Daily neutral with a bearish bias. Recommended ratio: 40% SPX, 60% Cash . * CRITICAL RESISTANCE WATCH . Equities finished the session relatively flat as markets are sending mixed signals ahead of CPI and PPI data on 08/10 and 08/11. Crypto, Gold, VIX and Oil are trending higher while DXY and Treasuries are down. Palantir reported an earnings miss and revenue beat and forecasted weaker revenue guidance for the second half of 2022; this likely isn't a market moving event but is important because it not only reflects a slowdown in growth stock interest but it hints at a slowdown in economic activity ( due to their significant number of government contract delays ). Key dates this week: COIN earnings 08/09; 4th US Q3 GDP estimate at 10am (EST) 08/10 ; CPI at 830am (EST) 08/10 ; Disney earnings 08/10; and PPI at 830am (EST) 08/11 .* Price continues to retest $4175 major resistance and briefly broke above it in today's session. Volume remains Moderate and fairly balanced between buyers and sellers reaffirming that Price is trading at a critical resistance. Parabolic SAR flips bearish at $4060, this margin is mildly bearish. RSI is currently trending down slightly at 63 after peaking at 66, it is also exhibiting minor Bearish Divergence; the next resistance is at 68 and next support at 53. Stochastic is currently crossing over bearish at 92 as it continues to trend sideways in the 'bullish autobahn'; the next support is at 76. MACD is currently beginning to form a soft peak at 68 and is still technically testing 55 minor resistance. ADX is currently trending up at 22.50 as Price continues its attempt to break above $4175, this is mildly bullish. If Price is able to bounce here then it will need to close above $4175 major resistance for two consecutive sessions in order to flip it to support; only after this will it be able to retest the upper trendline of the descending channel from November 2021 at ~$4300 as resistance . However, if Price breaks down here, it will likely retest $4100 before potentially retesting the uptrend line from 06/16/22 at $4k psychological support . Mental Stop Loss: (two consecutive closes above) $4175 .

The deal closed PGR in US stock market with profitAlhamdulillah , The deal was closed on PGR in US stock market with a profit of 4.69 % in a 4 days . I wish good luck to everybody.

Buy CALM in US stock market 4/8/2022You can buy it Target 56.39 stop loss 49.49 money management is your responsibility . good luck
