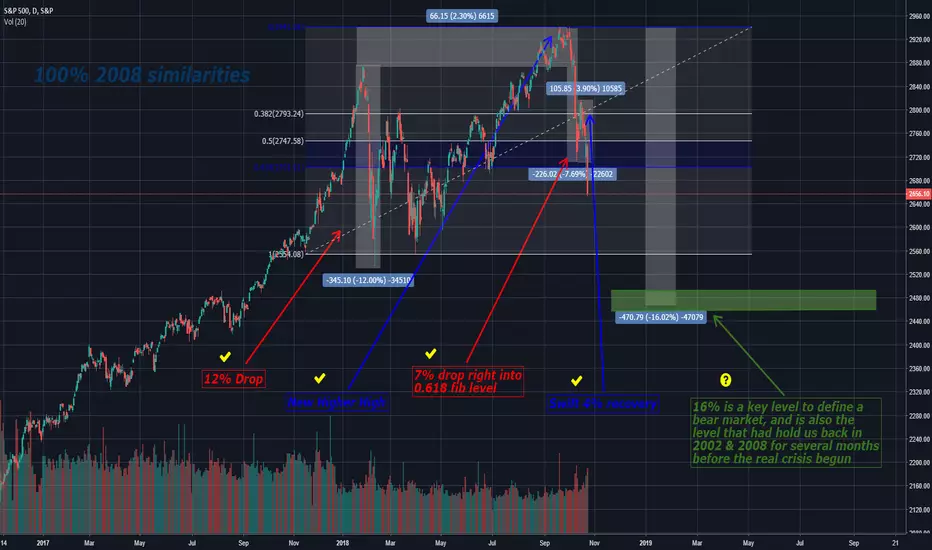
SPY - Stock Market Outlook into the futureLooking at past market crashes, I drew a chart to where we are heading in the next 2 years. I could be totally wrong but at least I can look back and see how accurate this hypothesis is.
Stockmarketcrash

My personalized bitcoin index (factoring in USDT fluctuations)It averages the price across 9 exchanges, while calculating the actual USD value of bitcoin in USDT markets by multiplying the respective exchange rates by the value of USDT according to Kraken.
Here's the formula for the chart in case anyone wants to use it themselves: (COINBASE:BTCUSD+BITSTAMP:BTCUSD+GEMINI:BTCUSD+POLONIEX:BTCUSDT*KRAKEN:USDTUSD+BITFINEX:BTCUSD*KRAKEN:USDTUSD+BINANCE:BTCUSDT*KRAKEN:USDTUSD+BITTREX:BTCUSDT*KRAKEN:USDTUSD+OKCOIN:BTCUSD+HITBTC:BTCUSD)/9
See related ideas(or find me on twitter/facebook/steemit) for more reasons why I'm so bullish.
The chart should pretty much speak for itself, breakout of a falling wedge...


Breakthrough discovery was found, (Part 2)This is unusual for us to analyse the S&P500 since our expertise is in the crypto space,
but since the last S&P500 minor crash interfere with our bitcoin prediction, and ruined nearly two months of perfect accuracy( imgur.com ) we had to come and check how serious this really is.
A another chart will be released soon of today's in the comments
16% explanation - thedowtheory.com
Everything that has a check sign next to it has already happened.
We also expect this to bring Bitcoin into a new highs, as the ETF is closer then ever to being approved, and it should happen within the next 4 months,
it will be just in time before the stock markets collapsed, and investors are seeking to hedge against it on Gold 0.03% & Bitcoin 0.37% .
We will always be here to welcome you if you decide to join the crypto space, our website is www.whaletank.trade
We are giving market predictions, Daily signals, and many masterpiece features on our website.
Unemployment rate making new lowsThis chart shows great correlation with financial crisis' in the past . The unemployment rate has hit lows it hasn't seen since 1970.

Prepare for Monday Crash!After having several distribution days in the last half a year, with the beginning of 2018 the Nasdaq has further accelerated from its usual uptrend, only to have a sharp 10% decline with volume increasing. It broke the previous highs later, but on miserable volume, followed by other high volume selloffs. The recent rally back to the 50 day Moving Average is also accompanied by significantly decreasing volume. All of these signs combined with the Bearish Engulfing candlestick pattern right at the 50 day MA is a really big danger sign for Monday. The S&P500 and the Dow is also showing the exact same patterns.

Silver long on log scaleSilver weekly on log scale. If inflation keeps rising and stocks keep falling. I foresee a strong rise in gold and silver in the near future.

Due for a stock crash or will we be reaching a new high?Blue parallel channel: main price trend channel
Purple parallel channel: secondary price trend channel
I know I'm missing some crises here and there, but I figured I only need to mark some.
The correlations I am able to make is that a high RSI along with an unsavory reason leads to big trouble.
Great Depression: credit **(Edit: I forgot to add that the huge run up in the 1920s leading up to the Great Depression was due to credit and an economic boom after WWI)**
Asian/Japanese Economic Bubble: credit and overvaluation of assets
Internet Bubble: money being poured into fundamentally lacking ideas/companies
Housing Market Crash: predatory lending and falsified documentation leading to investors taking on loans they couldn't afford
2018 Crash or Moon?
I'm welcome to contrarian discussion. What i'm most interested in right now is why the stock market has been on such a bullish run since the recession.
RSI and OBV looking down. Personally I believe the stock market is going for a correction after its run. I'd be sure to change my mind once I figure out why we ran up so quickly.

Stock Market Crash for Every Recent 8-Year Term President ]Why for all of the Recent 8-Year Term Presidents There Has Been a Stock Market Crash Around the Time of Thier Exit
