NASDAQ (Nas 100): Buyers Are In Control. Wait For LongsWelcome back to the Weekly Forex Forecast for the week of July 28 - Aug 1st.
In this video, we will analyze the following FX market:
NASDAQ (NQ1!) NAS100
The Nasdaq rose Friday to fresh highs, following a busy week of tariff updates and earnings. The index is showing no signs of bearishness.
Wait for pullbacks to FVGs to buys.
FOMC and NFP warrant caution with new entries. Wait until the news before new entries.
Enjoy!
May profits be upon you.
Leave any questions or comments in the comment section.
I appreciate any feedback from my viewers!
Like and/or subscribe if you want more accurate analysis.
Thank you so much!
Disclaimer:
I do not provide personal investment advice and I am not a qualified licensed investment advisor.
All information found here, including any ideas, opinions, views, predictions, forecasts, commentaries, suggestions, expressed or implied herein, are for informational, entertainment or educational purposes only and should not be construed as personal investment advice. While the information provided is believed to be accurate, it may include errors or inaccuracies.
I will not and cannot be held liable for any actions you take as a result of anything you read here.
Conduct your own due diligence, or consult a licensed financial advisor or broker before making any and all investment decisions. Any investments, trades, speculations, or decisions made on the basis of any information found on this channel, expressed or implied herein, are committed at your own risk, financial or otherwise.
Stockmarkets

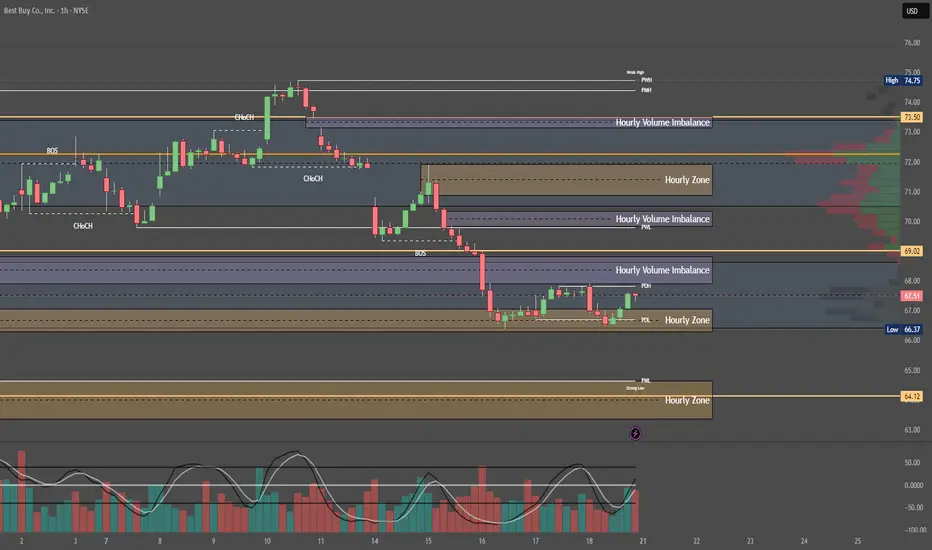
Quantum's BBY Outlook 7/20/25🚀 G.O.D. Flow (Gamma, Orderflow, Dealer Positioning)
1. 🧩 Summary Overview
Ticker: BBY
Current Price: $67.50
Flow Setup Date: Current Session
Trade Type: Intraday / 0–2 Day Swing
2. 🔬 Flow Breakdown
🔵 GEX (Gamma Exposure):
Highest -GEX at 70 → potential volatility pocket and resistance zone.
Despite matching +GEX at 70, net gamma is negative — bearish skew.
Additional +GEX at 72 & 73, but overwhelmed by -GEX at 68 and 67.
🔺 Overall gamma environment favors chop and downside unless 70 is reclaimed.
🟡 DEX (Delta Exposure):
Mirrors GEX layout.
Dealer short delta bias = likely selling into strength.
Reclaim of 70+ may signal a squeeze, but not favored without sweep confirmation.
🟣 Vanna:
Strong -Vanna clusters from 70 to 77: if IV rises, dealers sell into strength.
⚠️ This limits bullish continuation unless IV drops drastically.
Minor +Vanna at 60 = support base on deep dip (liquidity pocket if flushed hard).
🔴 Charm:
Extreme -Charm peak at 70 = time decay creates headwind at this level.
Additional -Charm pressure at 72, 73, and 77.
Minor +Charm at 60 suggests dealer support only comes much lower.
⚪ Volatility:
Neutral past week.
If vol spikes, expect dealer selling pressure to intensify under this skew.
🟢 Open Interest:
Heavy put OI at 70 = possible support IF price breaks hard.
Calls OI lighter at 72 and 73, meaning less resistance absorption if price does push up.
3. 📊 Chart Structure Setup
Price: $67.50, sitting below key gamma and charm cluster at 70.
Chart bias: Bearish unless strong reclaim of 70.
Key flush zones: 68 → 67 → 65
Confirmed supply above 70 due to clustered charm/vanna.
4. 🎯 Trade Plan
🟥 Bias: Bearish unless 70 is reclaimed and held with size.
🛠 Entry Triggers:
Rejection of 69.50–70 zone → PUT
Break and retest of 67 → PUT
📦 Contract Picks (0–5 DTE):
67p, 65p, 60p
🛑 Risk Stop:
Breakout and hold above 70.50 with size = exit or flip long bias intraday
🎯 Targets:
Target 1: 66.00 (Gamma flush)
Target 2: 63.00 (next +Charm liquidity zone)
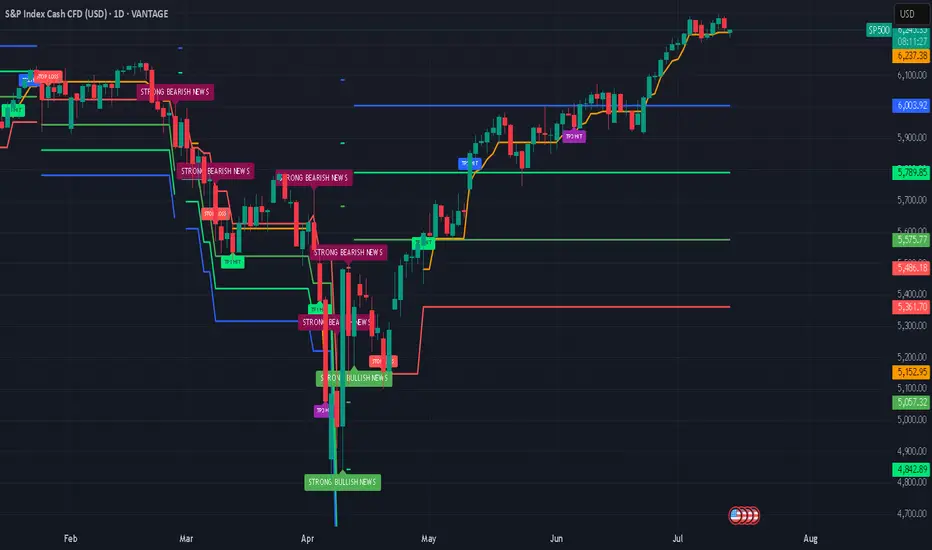
S&P 500: Defying Tariff Headwinds, Breaking RecordsThe S&P 500 has staged a remarkable rally in 2025, shattering all-time highs and capturing global attention. This surge has unfolded despite the negative economic overhang of renewed tariff threats and ongoing trade tensions, raising critical questions for investors: How did the market overcome such headwinds, and what lies ahead for both the short and long term?
The Rally Against the Odds
Tariff Turbulence: Earlier this year, President Trump announced sweeping new tariffs, sparking fears of supply chain disruptions and higher costs for American companies. Historically, such moves have triggered volatility and corrections.
Market Resilience: Despite these concerns, the S&P 500 not only recovered losses from the spring but surged to new record highs, with the index climbing over 23% since April’s lows. Major tech companies, especially those leading in AI and innovation, have been at the forefront of this advance.
Investor Sentiment: The rally has been fueled by optimism around potential Federal Reserve rate cuts, robust corporate earnings, and expectations of long-term economic growth—even as the immediate impact of tariffs remains uncertain.
Short-Term Correction: A Healthy Pause?
While the long-term outlook remains bullish, several indicators suggest the market may be due for a short-term correction:
Narrow Market Breadth: The current rally has been driven by a handful of mega-cap stocks, leaving the median S&P 500 stock well below its own 52-week high. Historically, such narrow leadership often precedes periods of consolidation or pullbacks.
Valuation Concerns: Stock valuations are at elevated levels, and some analysts warn that earnings growth could slow as companies adapt to higher input costs and shifting trade policies.
Correction Forecasts: Some strategists predict the S&P 500 could correct to around 5,250 by the third quarter of 2025, citing factors like slowing consumer spending and persistent policy uncertainty.
Long-Term Outlook: Higher Highs Ahead
Despite the potential for near-term volatility, the long-term trajectory for the S&P 500 remains positive:
Fed Policy Tailwinds: Anticipated rate cuts and lower bond yields are expected to provide further support for equities, encouraging risk-taking and higher valuations.
Corporate Adaptation: Companies are actively offsetting tariff impacts through cost savings, supply chain adjustments, and strategic pricing.
Growth Sectors: Innovation in technology, productivity gains, and deregulation are setting the stage for sustained profit growth, especially in sectors like AI, robotics, and defense.
Key Takeaways for Investors
Stay Disciplined: While a short-term correction is possible, history shows that markets often rebound strongly after periods of volatility.
Diversify Exposure: With market gains concentrated in a few names, diversification and active stock selection are more important than ever.
Focus on Fundamentals: Long-term investors should look beyond headlines and focus on companies with resilient earnings and adaptive business models.
The S&P 500’s ability to break records in the face of tariff headwinds is a testament to the underlying strength and adaptability of the U.S. economy. While short-term bumps are likely, the path ahead still points toward new highs for those with patience and perspective.
This article is for informational purposes only and does not constitute investment advice. Always consult with a financial advisor before making investment decisions.
#spx500 #stockmarket #analysis #economy #us #nasdaq #fed #bonds #rates #trading
Dow’s fighting hard for that breakoutDow Jones is moving within a bullish channel
with low selling pressure —
strong legs pushing toward the top.
I’m expecting another solid bullish leg.
BLACKBULL:US30

Preparing for price correctionThe previous scenario is still valid, except that the price correction is taking time and is turning into a diametric.
We are currently in wave-(f) of the diametric
Good luck
NEoWave Chart

Nasdaq: Bull flag breakout on daily chart, testing ATHsBeen a while since I last posted. So figured I'd share this quick chart. Market undoubtedly have been incredibly volatile this month. However luckily, the Nasdaq has been forming bull flag on the daily chart. This follows a strong prior uptrend. The breakout took place today, sending the index to test ATHs.
Notable stocks making a move are names like NASDAQ:AMZN and NASDAQ:NVDA , mainly due to the broader market strength. Other indices, such as the S&P 500 ( SP:SPX ) also are breaking out as they form a similar bull flag pattern.
At ATHs, this is a deciding factor of where the market goes next. Either it bounces off to near-term support, or the market rallies to a new all-time high until next cooldown.
Note: not financial advice

$ROOT IS IN A LONG TERM WEDGE WHICH SHOULD BREAK OUT SOONNASDAQ:ROOT that is in that bullish wedge is constricting and consolidating, it's like a rocket ship getting ready to launch NASDAQ:ROOT to $200 and higher like $230 or so.

Trading at the Market OpenTrading at the Market Open
The market open marks a critical juncture in the financial world, presenting a unique blend of opportunities and challenges for traders. This article explores the essence of trading at the open across stocks, forex, and commodities. It delves into the heightened volatility and liquidity characteristic of this period, offering insights and strategies to navigate these early market hours effectively, setting the stage for trading opportunities.
What Does the Open Mean in Stocks, Forex, and Commodities?
The open signifies the start of the trading day for various financial markets. It's a time when trading activity surges, marked by a rush of orders that have accumulated since the previous close. In stock markets, this includes shares, indices, and Exchange-Traded Funds (ETFs). The influx of orders often leads to significant price movements as the market absorbs overnight news and global economic developments.
For forex and commodity markets, the open can vary by region, reflecting their 24-hour nature. This period is crucial for setting the tone of the trading day, offering insights into sentiment and potential trends. Traders closely watch the market open to gauge the strength of these movements, which can indicate broader market trends or sector-specific shifts.
Volatility and Liquidity at Market Open
Trading at the open is often marked by enhanced volatility and liquidity. Heightened volatility is primarily due to the influx of orders accumulated overnight, reacting to various global events and news. As traders and investors assimilate this information, rapid price movements are common, especially in the first few minutes of the session. These price fluctuations can present both opportunities and risks for traders.
Increased liquidity, which refers to the ease with which assets can be bought or sold without causing significant price movements, is also a characteristic of the open. A higher number of market participants during this period may result in better order execution and tighter bid-ask spreads, particularly in highly liquid markets like forex and major stock indices.
What to Know Before the Market Opens
In terms of things to know before the stock market opens, it's essential to review the overnight and early morning news that can affect stocks. This includes company earnings reports, economic data releases, and geopolitical events. Traders also check pre-market trading activity to gauge sentiment and potential opening price movements.
For forex and commodities, understanding global events is crucial. Developments in different time zones, like policy changes by central banks or shifts in political scenarios, can significantly impact these markets. Additionally, reviewing the performance of international markets can provide insights, as they often influence the US open.
It's also vital to analyse futures markets, as they can indicate how stock indices might open. Lastly, around the forex, commodity, and stock market openings, indicators and other technical analysis tools applied to the previous day can also offer valuable context for the day ahead.
Market Open in Different Time Zones
Market open times vary globally due to different time zones, significantly impacting trading strategies. For instance, the New York Stock Exchange (NYSE) opens at 9:30 AM Eastern Time, which corresponds to different times in other parts of the world. For traders in London, this translates to an afternoon session, while for those in Asian markets like Tokyo, it's late evening.
Forex, operating 24 hours a day during weekdays, see overlapping sessions across different regions. For example, when the Asian trading session is concluding, the European session begins and later overlaps with the North American session. Such global interconnectivity ensures that forex markets are active round the clock, offering continuous trading opportunities but also requiring traders to be mindful of time zone differences and their impact on liquidity and volatility.
Strategies for Trading at Market Open
Trading at market open requires strategies that can handle rapid price movements across all markets. Here are some effective approaches:
- Pay Attention to Pre-Market Trends: This helps traders assess how a stock might behave at the market open. If a stock is fading from post-market highs, it might be wise to wait for a trend change before entering.
- Gap and Go Strategy: This involves focusing on stocks that gap up on positive news at market open, an indicator of potential further bullishness. Traders look for high relative volume in pre-market and enter trades on a break of pre-market highs. This strategy is fast-paced and requires quick decision-making.
- Opening Range Breakout (ORB): The ORB strategy uses the early trading range (high and low) to set entry points for breakout trades across all types of assets. The breakout from this range, typically the first 30 to 60 minutes of the session, often indicates the price direction for the rest of the session. Time frames like 5-minute, 15-minute, and 30-minute are commonly used for ORB.
- Gap Reversal: The gap reversal method is used when the price creates a gap, but then the range breaks in the opposite direction. If the gap is bullish and the price breaks the lower level of the opening range, it signals a gap reversal. The same concept applies to bearish gaps but in reverse.
The Bottom Line
In essence, understanding unique features of market open trading is vital for those participating in stock, forex, and commodity markets. The opening moments are characterised by heightened volatility and liquidity, driven by global events and sentiment. However, savvy traders may capitalise on these early market dynamics with effective strategies.
This article represents the opinion of the Companies operating under the FXOpen brand only. It is not to be construed as an offer, solicitation, or recommendation with respect to products and services provided by the Companies operating under the FXOpen brand, nor is it to be considered financial advice.

BANKNIFTY is moving towards 59000The monthly Cash Data chart is forming a diametric pattern. Waves (a) through (f) have completed and we are currently in the middle of wave (g) of the diametric pattern.
This wave is moving towards 59,000

Trent Ltd: Breakout or Fakeout?Trent Ltd: Breakout or Fakeout? Someone’s positioning — the question is which side.
Trent Ltd remains one of the more resilient players in India’s retail landscape. While broader consumer sentiment remains mixed, the company continues expanding its footprint, especially through its Westside stores and fashion vertical. Recent earnings have been stable, and institutional interest appears to be creeping back in — confirmed by a steady rise in volume.
Technically, we’re at a decision point. Price is testing a major descending trendline drawn from the all-time highs. So far, no breakout — but signs of accumulation are building. All major EMAs (50/100/200) are below the price, putting buyers firmly in control. Volume is rising on bullish candles, with no signs of distribution. RSI is holding above 50, climbing steadily, and showing a healthy impulse without overheating — plenty of room left for upside.
The key setup: wait for a confirmed breakout above the trendline, then a retest, and only after that consider entering. Targets, based on Fibonacci levels, line up cleanly:
tp1: 6337.60 (0.618)
tp2: 7484.65 (1.0)
tp3: 8301.40 (1.272)
Until then — this is a watching game, not a trading one. Momentum is building, the structure is clean — but confirmation is king.

NIFTY SMALLCAP250 - LONG SET-UP (2025-26 Target)NSE:NIFTYSMLCAP250
📊𝐂𝐡𝐚𝐫𝐭 𝐀𝐧𝐚𝐥𝐲𝐬𝐢𝐬 – 𝐍𝐢𝐟𝐭𝐲 𝐒𝐦𝐚𝐥𝐥𝐂𝐚𝐩 𝟐𝟓𝟎 (𝐌𝐨𝐧𝐭𝐡𝐥𝐲 𝐓𝐅)
The index is approaching a crucial resistance zone between 20,045 – 20,795, projected to be tested around 2025–26. This area aligns with the previous bullish expansion's Fibonacci extension and also shows a 21.13% upside move from current levels—highlighting a final exhaustion zone before a potential reversal
The marked red zone (similar to the 2021-22 range) suggests a possible distribution phase or topping structure. If price faces rejection there, a corrective wave could follow—targeting the 14,450 level, which coincides with the trendline retest and a high-volume area
𝐊𝐞𝐲 𝐒𝐮𝐩𝐩𝐨𝐫𝐭 𝐙𝐨𝐧𝐞𝐬:
14,450 – Trendline + structure confluence
13,292.60 – Prior base and horizontal support
10,495.85 – Major long-term demand zone
💡 𝐄𝐱𝐭𝐫𝐚 𝐈𝐧𝐬𝐢𝐠𝐡𝐭𝐬
You’ve rightly anticipated a multi-leg rally followed by correction—smart play on cycles and exhaustion
Watch for volume divergence or momentum slowdown (RSI, MACD) near the 20.8K mark as confirmation
This wave could be the last leg (Wave 5) in Elliott structure, after which a larger ABC correction is possible
If 14,450 breaks, it could trigger a steeper correction—possibly toward the 10.5K demand zone, offering long-term entries

SPY: Bullish Outlook Based on Market StructureETF Strategy: Still Buying for 2025 Growth
I'm continuing to buy SPY and adding other strong ETFs like VEA, QQQ, and TQQQ. The market structure looks solid after the recent bounce, and I’m positioning for continued growth through the rest of 2025. My goal is to close the year with a strong percentage gain.


CHAMBLEFERT IDEAChamblfert looks like at a good demand zone. Expecting good one time bounce from this area and one green candle after long rail of back to back red candles.

NIFTYI see these levels on Nifty. Forgot to paste the good shorting trade opportunity yesterday, however shared 2 charts with analysis of gift nifty which hinted short for market from past 2 days. Don't go into patterns and take early trades trade only when levels break or sustain.
S&P 500 Index Most Bullish Signal In 15 YearsThis is why it is very clear, certain, that the stock market, the S&P 500 Index (SPX) is set to grow in the coming months. Last week produced the highest volume session, on the bullish side, since April/May 2010, that's 15 years. Back then, when this signal showed up, this index went to grow for years non-stop.
The SPX also produced the strongest weekly session in several decades, maybe the strongest week ever, and a bounce happened (support found) exactly at the 0.618 retracement Fib.
This is all we need to know. When the bulls enter the market and do so with force, it is because the market is set to grow. The correction produced decline of 21%. This is pretty standard. The fact that the correction happened really fast, it means that it will also have a fast end.
The low is in. The correction is over. The S&P 500 Index is set to grow.
You can be certain. If you have any doubts, just ask the chart.
Namaste.

Two Shots at NQ: Because One's Never EnoughAlright, here’s the game plan – because let’s be honest, the market loves nothing more than pretending to break out, then snapping back just to mess with us.
🔥 The Setup:
I’m eyeing the Micro E-mini Nasdaq-100 Futures (June 2025), and I’m giving myself two shots at this breakout. Yeah, I know – ambitious. But the market’s been playing hard to get lately, so I’m hedging my enthusiasm.
💡 Why Two Long Entries?
Because, let’s face it, the first entry will probably get stopped out. I like to think of it as a “testing the waters” trade. If it works, great – I’m a genius. If not, well, it was just practice.
First Entry (The Optimist):
I’m jumping in if it breaks out, keeping the stop tight – because nothing says confidence like a cautious stop loss.
Second Entry (The Realist):
If the first entry faceplants, I’ll wait for the market to freak out and then calm down. Then, I’ll slide back in when it looks like it’s actually serious this time.
🧠 Managing the Chaos:
Short-Term Target: The last high – because if it doesn’t clear that, what’s the point?
Long-Term Target: The equal move – assuming the market doesn’t chicken out halfway.
Stop-Loss: Snug and sensible, because I’d rather not watch my account do a disappearing act.
Take profit targets are set where the equal move would complete – assuming the market cooperates for once.
💭 The Thought Process:
I’m not here to pretend I can predict the future – if I could, I’d be on a yacht, not posting on TradingView. But this setup gives me two chances to be right, which is at least one more than usual.
🔥 Your Thoughts?
If you’re also giving your trades a second (or third) chance, drop a comment. Or just let me know how your latest breakout fake-out went – because misery loves company. 😅

Is ETH - Next 3,000?ETHUSDT – Market Insight & Price Structure
Ethereum has been shaping a falling wedge pattern over the past 2 to 3 months—a structure that typically suggests a bullish reversal. Recently, price action confirmed a breakout above the key resistance zone between $2034 and $2040, along with a clean break of the upper trendline of the wedge. These movements point to a strong bullish signal, suggesting potential continuation to the upside.
Currently, Ethereum is approaching a significant resistance level around $2860. If price reaches this zone, we’ll be watching closely for confirmed reversal signals to consider a potential short/sell setup.
On the other hand, the primary bullish trend trade remains valid near the $2160–$2150 support range. A long position will only be considered upon confirmation, such as a bullish engulfing candlestick pattern, market structure shift (MSS), or other trusted technical signals.
Disclaimer: This is not financial advice. Always do your own research (DYOR).

What Is Random Walk Theory and Its Implications in Trading? What Is Random Walk Theory and Its Implications in Trading?
Random walk theory argues that market prices move erratic, making it difficult to analyse past data for an advantage. It suggests that technical and fundamental analysis provide little to no edge, as prices instantly reflect all available information. While some traders embrace this idea, others challenge it. This article explores the theory, its implications, criticisms, and what it means for traders navigating financial markets.
What Is Random Walk Theory?
Random walk theory reflects the idea that financial markets move erratic, making it impossible to analyse past price data for an advantage. The theory argues that price changes are random and independent, meaning past movements don’t influence future direction. This challenges both technical and fundamental analysis, arguing traders who attempt to time the market are essentially guessing.
The concept was first introduced by Maurice Kendall in 1953, who found no meaningful patterns in stock prices. Later, Burton Malkiel popularised it in A Random Walk Down Wall Street (1973), arguing that a blindfolded monkey throwing darts at a stock list would perform as well as professional traders. The underlying principle is that markets are efficient, instantly reflecting all available information.
The theory states that prices truly follow a random path, so a trader analysing charts or company reports has no statistical edge. It’s like flipping a coin—the next move is unrelated to the last. This has major implications: active trading strategies become questionable, and passive investing (e.g., index funds) may be a more logical approach.
However, while randomness can explain short-term price movements, longer-term trends still emerge. Factors like liquidity, institutional flows, and investor psychology create periods where price action deviates from pure randomness. This is where the debate arises—are markets entirely random, or do trends exist that skilled traders can take advantage of?
Understanding random walk theory helps frame this debate, offering insight into why some traders dismiss traditional analysis while others continue searching for patterns in price action.
Theoretical Foundations and Key Assumptions
The random walk hypothesis is based on mathematical models and probability, arguing that financial markets follow a stochastic process—where future price movements are independent of past trends. It builds on several key principles that shape how economists and traders view market efficiency and price behaviour.
Market Efficiency and Information Absorption
A core assumption of random walk models is that markets are efficient, meaning all available information is already reflected in asset prices. If new data emerges, prices adjust instantly, making it impossible to gain an edge through analysis. This aligns with the Efficient Market Hypothesis (EMH), which classifies efficiency into three forms:
- Weak form: Prices already reflect past movements, rendering technical analysis ineffective.
- Semi-strong form: Fundamental data (e.g., earnings reports) is priced in immediately, limiting the usefulness of research.
- Strong form: Even insider information is priced in, meaning no trader has an advantage.
Brownian Motion and Stochastic Processes
The theory borrows from Brownian motion, a model describing random movement, often used in random walk algorithms to simulate stock price fluctuations. Prices are treated as a series of independent events, much like molecules colliding in a gas.
No Clear Patterns
If prices truly follow a random walk, trends and cycles do not exist in a statistically significant way. This challenges traders who attempt to use historical data to analyse future movements.
Implications for Traders and Investors
If random walks in trading are truly the norm, then analysing market movements using historical price data is no more effective than flipping a coin. This has significant implications for both traders and long-term investors.
For traders relying on technical analysis, random walk theory presents a major problem. If price changes are independent, then tools like support and resistance, trendlines, and moving averages hold no real value. The same applies to fundamental analysis—if all available information is instantly priced in, then even detailed financial research doesn’t offer an edge.
This would mean day traders and swing traders aren’t consistently able to generate higher returns than the broader market. It’s why proponents of the theory often argue that attempting to time the market is a losing battle in the long run.
However, many supporters of the random walk theory advocate for passive investing, arguing that since, for example, individual stock movements are erratic, holding a diversified index fund is a more rational approach. Instead of trying to outperform the market, investors simply track it, reducing costs associated with frequent trading.
Criticism and Counterarguments
While random walk theory argues that market movements are independent, real-world trading data argues that markets are not entirely random. Critics point to patterns, inefficiencies, and the effectiveness of certain trading strategies as evidence that price action isn’t purely a coin flip.
Market Inefficiencies Exist
One of the biggest challenges to random walk theory is that markets display recurring inefficiencies. Certain price behaviours, like momentum effects, mean reversion, and seasonal trends, suggest that past movements do have an impact on future price action. For example:
- Momentum strategies: Studies show that assets that have performed well over the past three to twelve months tend to continue in the same direction. If price action were purely random, these trends wouldn’t exist.
- Earnings reactions: Stock prices often drift in the direction of an earnings surprise for weeks after the announcement. If markets were perfectly efficient, all adjustments would happen instantly.
Real Results
Random walk theory suggests that no trader can systematically outperform the market over time. Yet, some fund managers and proprietary traders have done exactly that. Warren Buffett’s long-term track record is often cited as evidence that skill, not just luck, plays a role in investing and trading. Similarly, hedge funds employing quantitative strategies have consistently generated returns, challenging the idea that price movements are entirely random.
The Adaptive Markets Hypothesis
A more flexible alternative is Andrew Lo’s Adaptive Markets Hypothesis, which seeks to reconcile the EMH’s claim that markets are rational and efficient with behavioural economists’ argument that markets are, in reality, irrational and inefficient. Instead of being entirely random, markets evolve based on participants’ actions, allowing patterns to emerge.
While random walk theory provides a useful framework, real market behaviour often deviates from its assumptions, leaving room for traders to find potential opportunities beyond pure randomness.
Practical Considerations for Traders
Even if markets exhibit randomness in the short term, traders still need a structured approach to analysing price action and managing risk. While random walk theory challenges traditional methods, it doesn’t mean traders should abandon analysis altogether. Instead, it highlights the importance of probabilistic thinking, risk control, and understanding market conditions.
Short-Term vs. Long-Term Price Behaviour
Markets may behave randomly on a daily or weekly basis, but longer-term trends can emerge due to liquidity shifts, institutional positioning, and macroeconomic factors. Traders focusing on short-term moves often work with probabilities, using statistical models and historical tendencies to assess risk and potential trade opportunities.
Risk Management in an Uncertain Market
If price movements are largely unpredictable, risk control becomes even more important. Traders typically limit their exposure using stop losses, position sizing, and diversification to avoid being caught on the wrong side of market volatility. Instead of focusing on certainty, they manage the probability of different outcomes.
The Role of Quantitative Strategies
While traditional chart patterns may be questioned under random walk theory, quantitative and algorithmic strategies analyse large datasets to identify inefficiencies. High-frequency trading firms, for example, exploit microsecond price discrepancies that aren’t visible to the human eye.
Rather than proving whether markets are fully random, traders adapt by testing, refining, and adjusting their strategies based on what works in real conditions. The most experienced traders accept uncertainty but structure their approach around probabilities and risk management.
The Bottom Line
Random walk theory challenges the idea that past price movements provide an edge, arguing that markets move erratically. While some traders accept this and focus on passive investing, others analyse inefficiencies to find potential opportunities.
FAQ
What Is the Random Walk Theory?
Random walk theory suggests that asset prices move unpredictably, with past movements having no influence on future direction. It argues that markets are efficient, meaning all available information is instantly reflected in prices. This challenges the idea that traders can consistently outperform the market using technical or fundamental analysis.
What Is the Meaning of the Random Walk Fallacy?
Critics of the theory argue that the random walk fallacy is the mistaken belief that financial markets move in a completely random manner, disregarding factors such as fundamental analysis, technical patterns, and behavioural finance that can influence price trends. This misconception may cause traders to overlook potential opportunities for strategic analysis.
What Are the Criticisms of Random Walk Theory?
Critics argue that markets display patterns, inefficiencies, and behavioural biases that contradict pure randomness. Studies on momentum, mean reversion and liquidity effects show that past price movements do influence future trends.
This article represents the opinion of the Companies operating under the FXOpen brand only. It is not to be construed as an offer, solicitation, or recommendation with respect to products and services provided by the Companies operating under the FXOpen brand, nor is it to be considered financial advice.

Monster Beverage: A Rally Built on Solid Ground?Monster Beverage recently achieved a significant milestone, reaching a new record high after a multi-week rally. This ascent, surpassing its previous peak, indicates robust market confidence. While the proximity of an earnings report may have initially fueled anticipation, the sustained upward movement suggests that investors are reacting to more fundamental strengths within the company.
A primary driver behind this rally is the increasingly positive sentiment from financial analysts, evidenced by multiple upward revisions to price targets. Complementing this is strong support from institutional investors, who collectively own a majority of the stock and have been actively increasing their holdings. This significant institutional accumulation provides a solid foundation and reflects conviction in Monster's future prospects.
The company's operational performance, particularly the resilience and international growth of its core energy drink segment, underpins investor optimism, effectively counteracting challenges in other areas like the alcohol market. Furthermore, Monster's aggressive share buyback program signals management's confidence and enhances shareholder value. These combined factors – external validation, institutional backing, operational strength, and capital returns – appear to be the key forces propelling Monster Beverage shares to new heights, despite some market headwinds.

Netflix price correction will continueBased on the 2-month Cash Data chart, it is quite clear that the diametric pattern is completing.
Considering that the diametric wave-(B) has taken a lot of complexity and time, it seems that the wave-(F) is not completed and has little complexity and time, so we considered two scenarios for the wave-(F):
Scenario 1
Considering that after the wave-(E) there was a rapid downward movement, the wave-(F) will become an irregular contracting triangle, then the wave-(G) will start and grow
Scenario 2
The wave-(F) can turn into a flat pattern with a strong wave-b. In this type of flat, usually the wave-c cannot retrace the entire wave-b, as a result, the wave-c of this type of flat pattern can turn into a terminal pattern, and then the diametric wave-(G) of a higher degree will start.

Is a Tesla Stock Rebound Imminent?Tesla's stock has recently faced volatility, partly due to first-quarter 2025 delivery figures that did not meet some market expectations. Despite this, several significant factors suggest a potential for upward movement in the share price. As the stock hovers around $292 in late April 2025, market observers are closely watching for catalysts that could shift sentiment and drive value appreciation for the electric vehicle and energy company.
Key indicators pointing towards a potential rebound include notable insider activity and the highly anticipated launch of a dedicated robotaxi service. A Tesla board member and Airbnb co-founder recently purchased over $1 million in TSLA stock, marking the first insider buy of this magnitude in approximately five years. This action signals strong internal confidence. Furthermore, the planned June launch of a robotaxi service in Austin, Texas, using autonomous Model Y vehicles, is viewed as a transformative step that could open substantial new revenue streams and redefine Tesla's market position.
Adding to the bullish sentiment is unusual activity in the options market, where a significant investor placed a large bet on a substantial price increase in the near term through out-of-the-money call options. While recent delivery misses and concerns regarding external factors have contributed to past stock pressure, the combination of insider conviction, a looming disruptive service launch, and aggressive bullish options trading suggests that the market may be poised for a significant reaction to upcoming positive developments. Investors are keenly focused on the successful execution of the robotaxi strategy as a critical determinant of future stock performance.
