SPX OutlookSPX is opening up mostly flat. We need to hold 3900 early on this week for a move up to 4000. There are a few easier Gap targets above if we can hold. Below 3900 its possible to see a drop back towards 3800 quickly.
Stockmarkets

Indexes and Cryptos under the pump so where to for markets now?The Morning Jumpstart Weekly Review 20/06/22...key levels to watch on major markets for the coming week!!
Cryptocurrencies remain under pressure and I expect that things will get worse before they potentially get better as we see cracks appearing in the underlying fundamentals of the asset class. Solana is taking an unprecedented step of freezing a large account that goes against the idea of a decentralised exchanges...and will potentially trigger shockwaves in the crypto space. Major share market Indexes are heading lower as traders unwind risk assets in the face of raising interest rates and continued high inflation.
The general trend for major Indexes remains down with the the USD in the driving seat....continuing to be careful into shares as prices could continue the trend lower.
Markets covered
US - DOW, Nasdaq and SP500
Europe - DAX and FTSE100
Asia - Hang Seng, ASX200 and Nikkei
FX - Dollar Index (USD), EURUSD , GBPUSD , AUDUSD and USDJPY
Commodities - GOLD , Oil and Copper
Crypto - Bitcoin and Ethereum

2022 - Not the Recession We Want, but the Recession We NeedIn response to the Federal Reserve increasing interest rates yet again, the markets - both in stocks and crypto (and housing soon to come) - have been dropping pretty hard lately. For crypto investors out there: this is the sound of mainstream money from the general public leaving the space - they came for the party, then left after the party was over. The craze that we saw in 20’-21’ was really the result of NFT projects targeting people - largely cooped up indoors due to the pandemic - with a hype-based marketing strategy that seemingly resonated very strongly.
Out of all the NFT projects that could have reached #1, it was the Bored Apes Yacht Club: it doesn’t take an art expert (although I do like to fancy myself as one at times) to see what BAYC’s success “means” - it’s obviously targeted at people who’s primary ethos is boredom…and exclusivity. In a way, BAYC is the perfect sign of the times - people bored of the lockdown, the rise of digital marketing and remote work, our reliance on artificial scarcity to determine “value”, and Web2 marketing/hype and investing practices all rolled into one. There’s a reason why even the Ethereum team (most visible Vitalik) renounced BAYC as something that ETH “wasn’t intended” to do. Adjective-Animal JPGs basically missed the point of why Web3 was created from the very beginning.
Now that the Feds are tightening up their money supply (finally, after having printed endless amounts of it during the last few years) the “casino” market is about to come to an end. But just because the market is in a downturn doesn’t automatically mean that everything will be bad…there are lots of opportunities still there; they just look different from what we’re used to seeing up until now. For some of us out there, we’ve been waiting for this moment for a very long time.
If you might have been thinking about changing or trying new things out in your life, now is probably the best time to do it because in a few months the world as we know it will probably get flipped on its head and most things will become unrecognizable anyway. During recessions people’s priorities tend to shift away from speculative assets and into savings; short-term investments into long-term; people shopping for interest rates on savings rather than loan accounts; and so on. Those who adapt will do well - but it will require a shift in mindset that may feel strange and unfamiliar. People say that “everyone” suffers during a recession but I tend to disagree - in any given market there are always winners and losers; money is game of how the idea of “value” compares itself to the price of goods around us. It is always relative to each other, in other words - and there are always ways to get ahead if you’re willing to look at the details close enough.
- The Market Itself is a Bubble
One thing to keep in mind that 80%+ of people don't own any stocks/crypto, so all the panic, hype, and emotional reactions you see in the media/social media is already a bubble of its own. Most people only see the prices of the things that they interact with every day - thing most people are seeing right now is that they see that inflation is cutting into their ability to survive day to day - and that something needs to be done. Until crypto products address these sorts of “bigger issues” of the public directly, it will always follow the general markets rather than setting the tone.
The reality is that most people in living in United States were already used to massive inflation - the costs of living was already on the rise since 12’ onward (especially in housing, education, and healthcare - typically the 3 biggest expenses for the average person out there) and people were already getting squeezed out every year anyway. In the upcoming months there will be a lot of people with lots of money complaining about how “hard” things are for them, but I don’t expect there will be any sympathy for them - in fact, they will probably be the target for the next ridicule cycle if anything, really.
What that means is that the economy was already hell for most people during the "good times" - inflation was already well out of control but we simply failed to acknowledge it. On a personal level, I lost more friends (especially artists) than I care to talk about: many were forced to move away from the places they loved because the costs of simply existing in certain areas became untenable. A lot of people I knew gave up on having kids, gave up on their dreams, went back living with their parents - worse case, some of them literally ended up on the streets simply because they were unable to pay their rent.
People who have known me long enough know that prior to getting into crypto I was heavily involved with housing politics through the YIMBY movement - though this downturn is hurting my portfolio too, it's hard for me to think that a market crash would be a bad thing long-term, because not only would it would lessen the pearl-clutching incentives/behaviors of NIMBYs, it should also bring down costs of everything as a whole. And that is good for everybody, not just the few who happen to be lucky enough to get their hands on a certain type of ERCs.
So while it may be unpleasant to see the numbers in your accounts go down, this is the correction that many have been waiting for - the correction that we need. Once the housing market stops going up, there’s less reason (and ability) for NIMBYs to defend their imaginary gains against the tides of supply and demand - and in the long run, the market should equalize itself to where it should be. What Web3 needs more of is people with a mindset of abundance rather than of scarcity - and this will become more important as the crypto ecosystem starts to mature.
Web3 is not only a movement of its own, but it’s also a repudiation of the bad habits of the Wall Street/Web2 model - which has, over time, become a ponzi scheme of its own. Low interest loans allowed startups, politicians, and scammers to “fundraise” their way out of trouble: No money to pay for things we need? No problem - just print more! Company not profitable? No problem - just raise your Series Z to keep it going just a little bit longer! Ponzi schemes do actually “work” on some level, after all - as long as the market keeps on going up.As we’ve seen with what happened with LUNA/3AC - which was entirely backed on the fantasy of Bitcoin going up forever and forever - there’s going to be a backlash against the stock market too, so that’s something to keep an eye out for. How did Bernie Madoff get away with what he did for over 20 years? The market was always going up. Now that the tide is pulling, we’ll get to see who was swimming naked underneath this whole time.
- It’s Time for the King (Bitcoin) to Serve its People
Bitcoin is obviously the first of its kind and currently the market leader in the crypto space as we speak - but for how long? While Ethereum is moving towards proof-of-stake as its primary economic engine (taking most of its tokens along with it), Bitcoin leaned hard into the proof-of-work + scarcity model in the last few years and never looked back. Given that the store-of-value idea is not unique to any coin - and that the only “value” Bitcoin currently provides is potential speculative gains (which are on its way out as staking rewards start to look more appealing during a recession) and a strange retro-nostalgia aesthetic for the pre-08’ eras (which will gradually fade over time), it’s hard to see it surviving for the long term. More broadly speaking, “it was there first” is exactly the type of NIMBY argument that the market will “correct” in the upcoming recession, taking down a multitude of asset classes that have been relying on that mentality up until this point. Ethereum is attempting to escape that fate through their “merge” (we’ll see if they’re successful in doing that this summer), but Bitcoin has basically signed the pact to go down with the ship. In a few months, it could potentially be the only proof-of-work system left on the charts, quite literally.
I’ve always found it odd that a lot of Bitcoin fans aren’t too shy about calling their coin of choice “King” - which is actually a fairly new phenomenon that came during the 16’-18’ run, not before. (The dev community was much purer back then.) This phrase clashes directly with their supposed support for decentralization and democratization of money - the cognitive dissonance there is massive, to say the least. (Since there is no on-chain governance in BTC systems a small group of miners usually end up controlling everything on the protocol level behind closed doors, btw.)
There’s something very disturbing about the glint you see in their eyes when they claim that Bitcoin holders (not anyone else, obviously) will become the most “powerful” people in the world in a few years - I don’t think anyone outside of that bubble really believes that - especially now. This is the year 2022 and we don’t really have the time to idolize or fantasize the absolute powers of monarchy, even in imaginary forms. Web3 will rely on the transparency of ledgers to establish partnerships of mutual benefit, enforced by precision and reliability of smart contracts - but this requires us to get better at collaboration, rather than moving unilaterally and monopolistically, as Web2 has typically done.
As is the case with modern monarchies - the royalty can either choose to step down or be taken down forcibly - one or the other will happen, either way. BTC has largely been left out of the development talks of Web3 systems as a whole, since they refused to fork out their systems to make compatibility improvements - it will eventually get left behind as the world continues to move without them. Luckily this will happen through the simple process of numbers going up and down - rather than having to deal with the fallout of it in the real-world itself.
- What’s Coming Next for Web3?
The typical pattern that the economy goes through during periods of recession is that they switch from a speculative to a savings mindset - when both the banks and the government spends all their money and have literally nothing left, what do they do? Raise interest rates to incentivize people to put money back in. As far as anyone can tell, the fundamentals of this relationship hasn’t changed and is not likely to have done so during this cycle either.
In crypto this means that there will be less demand for NFT lotteries and higher demand for coins that offer staking rewards as a benefit - undoubtedly there will be more and more people searching for the best rates out there as the Fed starts to raise its rates even further in order to keep inflation under control. Interest rates has been at 0% for so long that most people probably forgot that it was a thing - staking was a hard sell even during last year’s run since news of its developments were largely out-blasted by the NFT mania as a whole. But as we start transitioning into a different phase of the economy, people’s priorities are likely to shift.
Some coins that are well positioned to take advantage of this shift are Tezos, Algorand, Cardano, NANO, and many of the other coins that have been proof-of-stake from the very beginning. Ethereum and Dogecoin both have plans on switching over to proof-of-stake in the future (ETH supposedly in August, Dogecoin’s date is unknown), but the elephant in the room that nobody is talking about right now is the fact that Bitcoin doesn’t have the means (nor the plans to) transition into anything that is likely to be relevant in the near future.
Time will tell, but we’ll see what happens over the course of the next few months, next few years, since what happens is likely to be a crucial turning point for the industry as a whole. Now that mainstream money has left the space, both whales and HODLers are waiting for the right time to reorganize their portfolios and get back in. With fiat money out of the picture, we’re likely to see more independent movement between coins and clear winners and losers emerge within the ecosystem rather than always moving in parallel as it has up until now. What comes out in the aftermath of all of this will be a very different crypto landscape - possibly with the “flippening” happening during the midst of it as well.
As one last reminder, your portfolio going down is not necessarily a bad thing, if the goods that you pay for day-to-day gets, on average, cheaper. So I hope people don’t lose sight of the bigger picture and sees the opportunities and benefits that can come out of this transition as a whole. Money is about to get smarter: something that people have been demanding for a very long time. Well, if that’s what you’re looking for it’s coming right for us - hope people can recognize it when it’s here.

TIME TO SELL RGC STOCK$RGC rally now looks exhausting, price begins to lose momentum and RSI indicates that stock is overbought and needs re-evaluation.

prize action ema conformationTechnical analysis is Very important one of Trading field.
My Own steatergy Prize Action & Ema Conformation

NIFTY 50 TrendOn crucial support juncture around 15700, if holds then we could see a rally uptill 17500 atleast. Still, needed to break the trendline around 17500 to change the bearish trend

NASDAQ TrendAt the breaking point of lower part of the downward chanell. Can see a good upsurge to the top of the channel or a breakdown toll 16250 atleast depending upon the volume and g;oba; scenarios

Bearish stock market and S&P500 heading to 3800Hey traders, in today's trading session we are monitoring US500 for a selling opportunity around 4070 zone, once we will receive any bearish confirmation the trade will be executed.
Trade safe, Joe.

What we doing on SPY Flag.. Rip.. Dip.. Whats happening? What are we doing?' Maybe it was just a pullback..
I think we breakout over $408.50

QQQ ETF (NASDAQ)2 year chart starting with the COVID flash crash Feb 19, 2020 to current day, May 10, 2022. Dates on the chart indicated when support and resistance are established. Areas of consolidation circled in blue.

DJI potential for a rise! | 9th May 2022On the H4, with price expected to reverse off the ichimoku cloud , we have a bearish bias that price will drop from our 1st resistance at 33193 where the horizontal pullback resistance and 38.2% Fibonacci retracement is to our 1st support at 32422 in line with the pullback support. Alternatively, price may break 1st resistance structure and head for 2nd resistance where the horizontal pullback resistance.
Any opinions, news, research, analyses, prices, other information, or links to third-party sites contained on this website are provided on an "as-is" basis, as general market commentary, and do not constitute investment advice. The market commentary has not been prepared in accordance with legal requirements designed to promote the independence of investment research, and it is therefore not subject to any prohibition on dealing ahead of dissemination. Although this commentary is not produced by an independent source, FXCM takes all sufficient steps to eliminate or prevent any conflicts of interest arising out of the production and dissemination of this communication. The employees of FXCM commit to acting in the clients' best interests and represent their views without misleading, deceiving, or otherwise impairing the clients' ability to make informed investment decisions. For more information about the FXCM's internal organizational and administrative arrangements for the prevention of conflicts, please refer to the Firms' Managing Conflicts Policy. Please ensure that you read and understand our Full Disclaimer and Liability provision concerning the foregoing Information, which can be accessed on the website.

Will Market Bounce Back? Weekly Wrap #Tradeplan Nifty50 9th May First Step of a successful trader is to build a Trade plan & review what he has done.
This is my Trade Journal . (education purpose for all )
Trade plan
Nifty 50 : Trend is Down - Sell on rise ( see video for details )
Jai Hind.
Disclaimer :
This video is only for educational purposes. Please consult your financial advisor before you take any trade


SPCE is it ready to fly to the stars?Virgin Galactic has developed an ABC downside corrective pattern. Now it seem to have ended wave 1 and 2 to the upside. Is it ready to fly to the stars? www.youtube.com

FB Meta, did actually end this wave 4?Pattern looks complete to me. A deep wave 4 with a triangle in B and a deep 5-segment C wave.

AMZN One more low to end this wave 4 correction?Looks like AMZN needs wave 5 of C to end this ABC wave 4 correction.

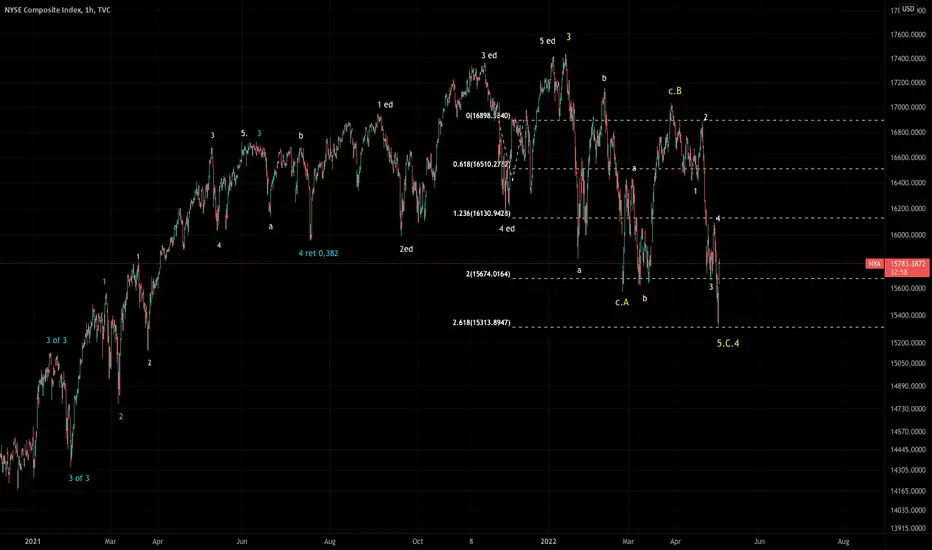
NYSE index nice ABC wave 4 correctionThe NYSE index, as well as all other USA indexes, has completed wave 4 correction in a text book ABC pattern. It's time for it to develop wave 5.
NIFTY SYMMETRICAL TRIANGLE WITH OPTIONS TRADING STRATEGIESNifty Symmetrical Triangle
After being stuck in a range this week, the Index is expected to be directional next week.
Tomorrow's Range: 17,000 - 17,300
Bullish: >17,300
Bearish: < 17,000
Long Strangles recommended for 5/5 Expiry

Stock markets in the era of high inflation part 2In my previous analysis I went deep into a lot of the fundamentals of what is going in stock markets in the current environment. At the moment the main theme is that the Fed will keep on hiking until the market crashes or something else breaks in the financial system. It is unknown how much time will it take for something to break, but it is probably going to happen in 2022. The current inflationary pressures seem extremely strong as they mostly have to do with issues on the supply side, however the Fed can only affect the demand side and they are determined to crush it. At least that’s their goal and it is unknown whether they will be able to do so. The problem is that inflation regardless of high or low interest rates, does a lot of damage on a lot of companies, as it affects both the consumers and the expenses a company has. Therefore, a lot of stocks started coming under significant pressure many months ago, something that wasn’t really visible when someone was looking at an index.
The major US indices looked fairly strong up until recently, however by looking at ARKK it is clear that many of the more speculative stuff that don’t make money right now started going down since Feb 2021. That was exactly the point where inflation started going up. As inflation was going higher and higher, more and more companies/indices started peaking in 2021. Some in April-May 2021, others in September 2021 and others in November 2021, while many are now down more than 40-50%. For example, Meta (Facebook) is down 50%, and its current situation looks similar to late 2018 (major gap down and then continued lower), but worse. Another example is Netflix which is down 70% and looks like it could go a lot lower.
What is interesting is how Tesla had a huge move up in October – early November, a move that was incredibly abnormal and all indicators were flashing extremely overbought conditions, and Elon Musk managed to sell right at the top while making his move public. This was pretty similar to when Charlie Lee, the founder of Litecoin, made public the fact that he was going to sell his Litecoin position, and his selling marked the top for Litecoin, which occurred a few weeks before the crypto market topped in 2018. What is even more interesting is how Tesla has done so well when many other tech companies have done so poorly, something that could be explained by the fact that finally Tesla is becoming more and more profitable, and on the 20th it announced its earnings which had a big positive surprise. However now these earnings could mark the top for the stock, as its chart is starting to look like a proper top. First an extraordinary blow off top, then failure to push higher or even fill the gap at the top. Then filled the gap at the top while also forming an SFP, and then fell a lot lower. Since then, the market recovered and several exhaustion gaps have occurred up until now, with the most important one being the one that occurred post earnings. When the market opened the day after the announcement, it immediately filled a little gap higher and got quickly slammed back down. These are not good signs for a bull market.
Now I’d like to get into the 4 major US indices, with the S&P500 being the main focus. Here I will go deep into the TA in order to get a better idea of where we are and what is going on. The first one is an uncommon one, but one I really like, and that is the Russell 3000 (top 3000 US stocks). Both the topping and the bottoming processes were pretty clean, as at first the top occurred with a nice distribution pattern after the market had been slowing down. Then the bottom came after a 15% correction from its ATHs, and as the market retested its Feb-March 2021 highs which turned into support and right after it swept the May lows. Initially there was strong bounce, then retested the May lows which held and then it pushed higher. However once the market retested the September highs and swept the Feb 2022 highs, it got badly rejected and yesterday it had an awful close. So far this chart could have been the perfect guide for someone trading the US stock market, however it isn’t enough from now on.
The next one we are going to look at is the Russell 2000, which had an insane rally in 2020 and early 2021, but since March of 2021 it entered a huge distribution phase. In September the distribution phase was confirmed as the market had a huge breakout that quickly failed and the index quickly retested its range lows. When the range lows broke, they then turned into resistance and have rejected the market twice. Currently the market is retesting the lows once again, which makes me think that they will be broken after being tested so many times. This area could be seen as a double/triple bottom that hasn’t been swept and therefore it is acting like a magnet. In my opinion the market will break the lows, and at best it will have a little bounce after sweeping them, as this pattern looks extremely bearish. After a year of distribution and multiple confirmations of it, it is pretty hard for the market to bottom quickly and therefore after breaking the lows it could collapse further. It looks like the minimum target from here is the 2018 ATH, while fully reversing the vaccine/election trade is pretty likely and means that the Russell could get to 1700 this year.
The third index we’ll look into is the Nasdaq 100, and we will look at the spot ETF, not the futures. The reason why I want to look at the spot ETF and not the futures, is that the ETF has some major areas which are of interest, that don’t exist on the futures. In terms of the topping and the bottoming processes, there isn’t much to be said here that differs from what was said above or the futures, other than the fact Nasdaq had two major gaps down that haven’t been filled. This is clearly an indication that tech is being sold a lot harder than the rest of the stock market and that in the future these areas could act as resistance. Now the key area I am looking at, is the triple bottom in the first green zone which like the Russell 2000 bottom will probably be broken even it’s just to sweep the lows and then move higher. The second area is the second green zone which was major resistance in the past and has turned into support, and the third one is that major gap at 276 which could be filled.
Another similar chart is that of the S&P500 spot ETF, which has two double bottoms waiting to be broken, and one of the double bottoms is right above a major gap. Like with all the areas mentioned above, these could simply be local bottoms and the market might just have weak bounces or no bounces there. However, I expect the test of 390-400 on the SPY to give a major bounce as it looks a lot like when the Russell 3000 retested its Feb-Mar 2021 highs, swept the lows and filled the gap.
Before I zoom out to get better perspective of what is going on the SPX, I’d like to zoom in on the SPY and see how important these gaps and double tops/bottoms are. For example, the two most recent local tops occurred with a gap and by filling a gap, with the first one also sweeping a triple top. The major bottom at 410 occurred after filling a double gap (two unfilled gaps in the same area) and the second bottom around 415 occurred with an SFP. Therefore, you can see how important these patterns are.
By zooming out again and using the major Moving Averages, we can see that they are giving us clear signals of whether the market is in an uptrend or downtrend, as well as clear signals of where major support or resistance levels lie. For example, the market bottomed at the 400 DMA, and recently topped at an area where the 100 & 200 DMAs were about to cross. Usually when a major MA is tested so many times, it eventually breaks (400 DMA about to be broken). So at the moment the market is in downtrend which might accelerate below the 400 DMA, which looks like it will get broken fairly soon. Then until it gets reclaimed, I assume the trend is bearish and we need to be cautious.
By zooming out even more, the two other major MAs I am paying attention to are the 200 and 400 WMAs. At the moment, getting to the 400 WMA seems a bit far-fetched as by that time the Fed will have probably stepped in to save the day.
Many are comparing the current hiking cycle with that of 2018, as the Fed kept raising rates until the market collapse and then it quickly stopped hiking rates, and in my opinion this is a decent comparison. Clearly not a perfect one as inflation is much higher, the Fed Funds Rate much lower, the Fed is about to start hiking by 0.5%, markets are more elevated and the global economy in a worse position than back then. The reason why I think this is a decent one and I want to compare it to 2018, is because I think the Fed is in a similar or probably worse position that back then, and therefore they will have to reverse course. Back then the market bottomed after a 20% from its ATHs and at the 200 WMA, which is currently 28% below the ATHs. On the chart below you can see what these corrections would look like when zooming out. I’ve also added what it would look like if we had a mega crash and the market retested the 2000-2008 highs, something I think is extremely unlikely at the moment. As our fiat system is crumbling, the Fed and the US government will be forced to print a lot of money, and therefore the stock market will keep going higher and higher, regardless of how bad the financial conditions are and how many deep corrections will it have.

Stock markets in the era of high inflation part 1As inflation prints are coming hotter and hotter, and the bond market keeps tumbling lower, there is a lot of debate on whether the stock market remains a good ‘hedge’ or ‘bet’ under these conditions. Well, this isn’t an easy debate and there are no easy answers, but in this analysis, I will try to outline certain important things I am looking at. I will also provide both a short term and long-term outlook by using both fundamental and technical analysis, however I will split the analysis into two pieces. This is part one and you will find part 2 in the links below.
First of all, I’d like to look at the big picture and then start zooming in, as it is good to have an idea of where the global economy is right now and how that affects stocks. Well, the global economy is not in a good place as there is too much debt in the world, supply chains have all sorts of issues from the China lockdowns to the war in Ukraine, the population is aging, Covid created a lot of negative imbalances and the underinvestment in commodities has create a lot of shortages. Now all these are occurring after stocks had reached insane valuations in 2020-2021, inflation is at multiyear highs and at the same time the Fed wants to hike rates by 0.5% on every meeting in 2022 in order to fight that inflation. Their goal is to reverse the wealth effect it created in 2020-2021 in order to fight deflation, and they might keep hiking until the stock market collapses.
When someone looks at all the above, he must be thinking that shorting stocks is a great idea and that the market will collapse soon. However, the truth is that the US economy is in a much better shape than many others as it produces a lot of the commodities it needs, US companies have been strong and earning prove that, while several companies substantially benefit from the current inflationary circumstances. For example, consumer staples and commodities producers are greatly benefiting from all the shortages and therefore their stocks have gone up. Of course, not all companies are doing well, as many of the more unprofitable/speculative companies are suffering greatly due to their profits being reduced or the debts repayments being increased. Higher inflation is eating away from the profits of some of those companies, while higher bond yields have increased the borrowing costs for others. These in turn have a negative effect on the stock prices at best some of these companies pay less dividends, while many companies might be pushed to bankruptcy if they can’t repay their debts.
You might now be thinking: ‘If so many companies are doing poorly and bond yields are going higher, shouldn’t we be worried? If the 60/40 portfolio is getting crushed, couldn’t that create a larger crash? If the Fed is ‘telling us’ that it wants stocks to go lower, shouldn’t we get out?’ Well, during all the previous hiking cycles stocks mostly rose at the beginning and fell towards the end, and in our situation the Fed has barely begun hiking. Bond yields going higher means that bonds are being sold, and some of that capital could redirected into the stock market. Stocks are much more of hard asset than bonds are, as companies can profit from bad situation and investors can dump the losers to buy the winners, while the government usually ends up borrowing more and more, diluting the value of existing bonds. The market might have taken yields to 2.5-3%, but based on my analysis this is close to the point where I believe bond yields are going to top (bonds bottom). The more the Fed is raising rates, the more I believe they will create a recession and this in turn could make inflation come down. Inflation won’t go away, though it could be much closer to 3-4%, than 8-9%. In my opinion getting back into a disinflationary trend would greatly benefit stocks, and therefore in case stocks dip because of the Fed, I am a buyer.
My reasoning is that if the Fed keeps raising rates, something will break and they will then be forced to the cut rates and start buying bonds. Essentially based on the current set of circumstances stocks could keep going up for a while, then crash, and then the Fed will be forced to step in to prevent the financial system from melting down. However, one thing is clear and it is very clear. There is so much leverage in the system, there is so much debt, there are so many issues in the economy, that the only way out is by devaluing the dollar, not by making it stronger. Raising rates to crush demand isn’t what ordinary people who can’t pay their rent need. They need cash in order to buy stuff they need, yet can’t afford. Politically this is the only politically acceptable way moving forward, and at the same time is the best outcome for the stock market. It will of course exacerbate the inflation and increase the liquidity in stocks which has been lacking recently. Actually, since Feb 2021 things have started deteriorating for stocks as governments stopped supporting businesses and banks cut down on lending, hence if they resume this would be pretty bullish. Oftentimes we see stocks do well in nominal terms during bad times, as the currency is losing value and people are trying to escape the devaluation. In real terms investors might be underperforming, but it might be better than holding fiat. Hence even if stocks have topped for now, it doesn’t mean the bull market is over, because the devaluation of fiat isn’t over.
Another interesting thing to note here is that real rates have gone back to 0, as they were deeply negative before. These deeply negative rates definitely benefited the stock market as investors were trying to escape cash and bonds, but now cash and bonds have become somewhat attractive again. My belief is that inflation will start slowing down in the next few months and that the Fed is already too late, hence real rates will probably increase even more. This could be either seen as a positive if you believe that the Fed will slow down its rate hikes as they realize they don’t need to hike as much or it could be seen as a negative if you believe that they will completely ignore future inflation prints and raise rates until prices go down or something breaks.

THE NEXT ECONOMIC CRISIS IS IN FRONT OF USTo see what will happen in the economic world, we must look more broadly at what has happened, but in this analysis I will use technical analysis patterns to predict what will happen.
What happened?/b]
1. Gold is clearly visible in the cup and handle pattern
An uptrend followed by a cup and handle pattern in technical analysis means that the price will continue to rise at least it will touch the height according to the cup height.
2. The S&P 500 is already too high
After the COVID-19 pandemic which caused a severe crash on the stock market, it turned out not to be as bad as I imagined, the market was actually getting faster to an all time high level. It has gone too high and needs to be restarted again.
3. Bitcoin is still too high and needs a little correction
In the 10x rally that occurred in bitcoin in 2020 and then followed by a crash with a decline of more than 50%. But it turned out that bitcoin touched its all-time high again and fell again, but when I saw the bitcoin chart, it seems that bitcoin should need a long correction before rallying again.
Conclusion
By looking at some of the factors above and supported by various fundamental factors such as inflation that is too high, world wars are everywhere and several other factors, investors will move their money to safe heaven assets, namely gold which is supported by cup and handle patterns. At that time bitcoin and other cryptocurrencies will be slightly corrected, when gold has surpassed the all time high, bitcoin and other cryptocurrencies will immediately crawl up and touch their all time high.
I don't care about your laughing at this nonsense analysis. But this is my personal analysis that I share with you.
I am not a financial advisor. Thank you

Bitcoin & Pre-Market - Reasons to remain cautiously optimistic!Traders,
We have tested our multi-year support yet again! As you know, this is something I did not want to see us doing. However, our support remains incredibly strong and thus, we have bounced yet again off of that support. This is now the 16th or 17th time (depending on what one classifies as a touch) that we have tested our support. Currently, Bitcoin is forming a bullish hammer candle. Let's to a quick review of our charts here.
⛓️ 🔗 Useful Links 🔗 ⛓️
(see below)

BABA Trend analysis and SIGNALThe price falls to the specified limit
Be sure to stick to Stop Lost and TAkE Profit. This is an idea and not a bargain offer
