Tuscan Holdings Corp. Announces Intent to Combine With MicrovastTuscan Holdings Corp. Announces Intent to Combine With Microvast Inc.
("Tuscan") today confirmed that it has signed a letter of intent ("LOI") related to a business combination with Microvast Inc., a market leading provider of next-generation battery technologies for commercial and specialty use electric vehicles ("Microvast" or the "Company").
Microvast has a compelling financial profile, with significant historical revenues as well as projected growth and profitability. With its battery technology installed in over 28,000 vehicles worldwide, an impressive, growing list of global OEM customers, and a strategic partnership with Fiat Power Train Industrial
Microvast expects to generate over $100 million of revenue this financial year.
Completion of the transaction is subject to, among other things, the execution of a definitive agreement, approval by the two companies' boards, satisfaction of customary closing conditions and approval of the transaction by each company's shareholders.
Accordingly, there can be no assurance that a definitive agreement will be entered into or that the proposed transaction will be consummated on the terms currently contemplated or at all.
finance.yahoo.com
Stockmarkets

Oragenics Inc $OGEN - investment idea 💡 This entry and SL is based on my technical analysis only.
Do your research and trade on your own risk!

RKT - We Have Confirmation!We are above 50D moving average, RSI over 50 and head and shoulder confirmed, I'm 100% bullish. Target 29

View to Merge with CFII, a SPAC sponsored by Cantor FitzgeraldView, the leader in Smart Windows, to Merge with CF Finance Acquisition Corp., II (Nasdaq: CFII) ("CF II"), a special purpose acquisition company sponsored by Cantor Fitzgerald
- View is the market leader in next-generation smart windows that use artificial intelligence and machine learning which will tint the glass to optimize natural light while controlling heat and glare to enhance mental and physical well-being for occupants, creating smart connected buildings which reduce energy consumption and greenhouse gas (GHG) emissions.
- The combined company will be called View, Inc. and will be publicly listed on the NASDAQ market
- The transaction values View at an enterprise value of $1.6 billion, and is expected to provide up to $800 million in proceeds, including a fully committed PIPE of $300 million at $10.00 per share and up to $500 million of cash held in the trust account of CF Finance Acquisition Corp. II
- The transaction is expected to close in the first quarter of 2021.
finance.yahoo.com

Lightning EMotors Said In Talks to Go Public Via GigCapital3Lightning EMotors Said In Talks to Go Public Via GigCapital3
-Lightning EMotors, a company that focuses on fleet electrification and cutting out fuel consumption, is in advanced talks to go public through a merger with blank-check firm GigCapital3 Inc., according to people with knowledge of the matter.
-GigCapital3 is seeking to raise about $100 million in new equity to support a transaction that would create a combined entity worth $700 million to $1 billion, including debt, said the people, who requested anonymity because the talks are private. Terms could change but a deal, if agreed, could be announced as soon as next week, some of the people said.
A representative for Lightning EMotors declined to comment. Representatives for GigCapital3 didn’t immediately respond to requests for comment.
-The Loveland, Colorado-based company, formerly known as Lightning Hybrids, adds technology to commercial vehicles such as vans, trucks and buses that reduces their emissions to zero, and provides a charging service.
-The company said in October that it had more than doubled its manufacturing space, ramped up production and that it had doubled its workforce.
- “There is significant momentum building in the commercial medium-duty electric vehicle industry, driven by social and regulatory trends,” Chief Executive Officer Tim Reeser said in a statement at the time, noting that demand outstrips supply for the industry. Reeser is also a managing director at Aravaipa Ventures, a Boulder, Colorado-based investment firm.
- GigCapital3, led by executive chairman Avi Katz, raised $200 million in a May initial public offering. It said it’ll focus on companies with enterprise valuations larger than $500 million in the technology, media and telecommunications industry.
- Katz’s GigCapital2 Inc. in October said it signed a letter of intent to merge with Bolder Industries, a company that converts end-of-life tires into sustainable industrial products. An earlier SPAC, GigCapital Inc., merged with Kaleyra SpA in a deal that took the software company public.
- A deal between GigCapital3 and Lightning eMotors would follow the pending merger of Pivotal Investment Corp. II and XL Fleet, another company that specializes in fleet electrification.
finance.yahoo.com

Aeva to Be Listed on NYSE through Business Combination with IPV Aeva, Maker of the First 4D LiDAR on Chip, to Be Listed on NYSE through Business Combination with InterPrivate Acquisition Corp.
-Aeva Inc. (“Aeva”) is the leading provider of comprehensive perception solutions developed on Silicon Photonics for mass scale applications in automotive, consumer electronics, consumer health, industrial and security markets.
-Aeva’s groundbreaking 4D LiDAR on Chip combines instant velocity measurements and long-range performance at affordable costs for commercialization at silicon scale.
-Aeva has received strategic investments from Porsche SE, the major shareholder of VW Group.
-Aeva’s commercial partners also include other top automotive OEMs and world’s leading mobility and technology players.
-In September, Aeva announced a production partnership with ZF to manufacture and distribute the first automotive grade 4D LiDAR to global OEM customers.
-Business combination to provide up to $363M in gross proceeds, comprised of InterPrivate’s $243M held in trust and a $120M fully committed common stock PIPE at $10.00 per share, including investments from Adage Capital and Porsche SE.
-Combined company expected to have an estimated post-transaction equity value of approximately $2.1B and is expected to be listed on the NYSE under the ticker symbol AEVA following anticipated transaction close in Q1 2021.
-All Aeva stockholders, including Lux Capital, Canaan Partners, and Lockheed Martin, will retain their equity holdings through Aeva’s transition into the publicly listed company.
-Aeva plans to use 100% of the net proceeds from the transaction to accelerate its growth and commercialization.
Transaction overview
The combined company will have an implied pro forma equity value of approximately $2.1 billion at closing, and Aeva’s existing stockholders will hold approximately 80% of the issued and outstanding shares of common stock of the combined company immediately following the closing.
Cash proceeds in connection with the transaction will be funded through a combination of :
(i) the issuance of approximately $120 million of common stock through a fully committed private placement at $10.00 per share, including investments from Adage Capital and Porsche SE,
(ii) the issuance of $ 1.7 billion of new common stock of InterPrivate to current stockholders of Aeva subject to customary adjustments and
(iii) $243 million of cash held in trust assuming no redemptions by InterPrivate’s existing public stockholders.
Completion of the proposed business combination is subject to, among other things, the approval by InterPrivate and Aeva stockholders and the satisfaction or waiver of other customary closing conditions , including a registration statement being declared effective by the Securities and Exchange Commission (the “SEC”), and is expected to occur in the first quarter of 2021.
ipvspac.com stock

SPX500 - end of the line soon/ correction pendingThe 1.618 extension is fairly close, the indicators lack conviction and the price has been crawling up on low volume.
I think we should go down for a healthy correction to test the market psych. I would slowly start booking profits here and there.

Local Now announced a distribution partnership with CinedigmThe Weather Channel's Local Now Expands OTT Streaming Offerings With Cinedigm Distribution Partnership
The Bob Ross Channel, Dove Channel, Gametoon, FashionBox, CONtv, Anime, Comedy Dynamics and BAMBU are Among Channels Now Available on Local Now
This collaboration is part of Local Now's commitment to expanding the depth, availability, and entertainment value of its programming offerings.
The Local Now audience will now have 24/7 access to engaging, marquee channels.
Cinedigm channels will also become available on Local Now's portfolio of OTT, CTV, mobile, and TV platforms at the end of the year.
Local Now currently serves a diverse audience, reaching more than 225 markets across the nation.
finance.yahoo.com

HCCH Receives Shareholder Approval of Business CombinationHL Acquisitions Corp. Receives Shareholder Approval of Business Combination with Fusion Fuel Green.
shareholders of HL have approved the business combination between HL and Fusion Fuel at an annual general meeting of shareholders held today in New York. None of HL’s public shares were redeemed in connection with the vote to approve the business combination. It is expected that the business combination will close in the coming days.
Upon the closing of the business combination, each unseparated unit of HL will separate into its component parts of one ordinary share, one warrant, and one right. Each right of HL will be automatically exchanged for one-tenth (1/10th) of one ordinary share in accordance with its terms. The ordinary shares and warrants of HL will then automatically convert into Class A ordinary shares and warrants of Fusion Fuel, respectively, and it is expected that such Class A ordinary shares and warrants will trade on the Nasdaq Capital Market under the symbols “HTOO” and “HTOOW,” respectively.
finance.yahoo.com

Pip Sandler research firm upgraded Funko's stockAnalyst Erinn Murphy from Pip Sandler research firm upgraded Funko's stock from Neutral to Overweight with a price target lifted from $6 to $12.
chat with the company's president, CFO and head of IR led to the firm switching to a bullish tone. Specifically, the management team expects to show modest growth in the U.S. business in the fourth quarter while gross margin concerns at other competitors aren't an issue at Funko.
Management is expected to release a "good amount" of new content for next year with a focus on recent hit content like "Queen's Gambit," "WandaVision," among others, the analyst wrote in a note.
More importantly, Piper Sandler's checks point to signs of success with the recent launch of Snapsies at 800 Target (NYSE: TGT) stores along with an expansion of board games and accelerated digital efforts.
finance.yahoo.com

StockMarket Update (#49) : We're at a Weekly Turning Point !Hope this idea will inspire some of you !
Don't forget to hit the like/follow button if you feel like this post deserves it ;)
That's the best way to support me and help pushing this content to other users.
Kindly,
Phil

Israeli Lidar Startup Innoviz in Talks to Merge With SPAC CGROIsraeli Lidar Startup Innoviz in Talks to Merge With SPAC
Innoviz Technologies Ltd., an Israeli startup focused on lidar, laser sensors used in autonomous vehicles, is in talks to go public through a merger with Collective Growth Corp., according to people with knowledge of the matter.
Collective Growth is seeking to raise $100 million to $350 million in new equity to support a transaction that’s set to value the combined entity at $1 billion or more, said the people, who requested anonymity because the discussions aren’t public. Terms could change as a deal isn’t finalized, and it’s possible talks could fall apart, one of the people said.
Collective Growth, the Austin, Texas-based special purpose acquisition company, is led by Chief Executive Officer Bruce Linton, who is known for co-founding Canopy Growth Corp., a cannabis producer. Collective Growth raised $150 million in April and said at the time it would focus on target businesses in any industry or geography.
Innoviz’s investors include Samsung Electronics Co., SoftBank Ventures Asia and Phoenix Insurance Co., among others
A SPAC merger has become an increasingly popular method for closely held companies to raise growth capital.
www.bloomberg.com

Stem, Inc. to become publicly listed through SPAC company STPKStem, Inc. to become publicly listed through business combination with Star Peak Energy Transition Corp. (NYSE: STPK).
• Stem, Inc. – Market Leader in AI-Driven Clean Energy Storage Systems – to Combine with Star Peak, Creating First Public Pure Play Smart Energy Storage Company
• Founded in 2009, Stem is an energy storage leader that offers customers a complete solution of integrated battery storage systems, network integration and battery optimization via its proprietary AI-driven software platform called Athena™.
• Transaction to provide up to $608 million in gross proceeds, comprised of Star Peak’s $383 million of cash held in trust, assuming no redemptions, and a $225 million fully-committed common stock PIPE at $10.00 per share, including investments from funds and accounts managed by BlackRock, Van Eck Associates Corporation, Adage Capital Management, L.P., Electron Capital Partners, and Senator Investment Group.
• Following the expected first quarter 2021 transaction close, the combined company will have an estimated equity value of approximately $1.35 billion and will remain listed on the New York Stock Exchange under the new ticker symbol “STEM.”
• Stem’s energy storage systems address a $1.2 trillion market opportunity , and offers investors a unique ESG opportunity to invest in a pure play clean energy company helping to revolutionize the electric grid.
www.businesswire.com stock

NSCO soars after $1.5 billion acquisition deal and equity investNesco Holdings To Acquire Custom Truck One Source And Create Leading Specialty Rental Equipment Company In Partnership With Platinum Equity
Nesco and CTOS are leading providers of specialized truck and heavy equipment solutions including rental, sales and aftermarket parts and service.
Platinum Equity, the premier financial sponsor in the specialty rental equipment industry, has committed to invest over $850 million in Nesco in exchange for newly issued common stock at a price of $5.00 per share and will hold a majority interest in the combined company
Nesco lead investors, Energy Capital Partners and Capitol Investment, and existing CTOS lead investor, Blackstone, to remain ongoing shareholders in partnership with Platinum Equity
Combination significantly reduces leverage, includes material synergies and substantially enhances both corporate and public market liquidity
With complementary business lines, customer bases and capabilities, the combination is expected to yield significant benefits from increased scale, breadth of product and service offerings and expanded geographic coverage.
existing CTOS shareholders are expected to invest approximately $100 million into Nesco in exchange for newly issued common stock also at the same price as Platinum.
After the closing of the CTOS purchase, which is expected to occur in the fist quarter of 2021, Platinum is expected to own approximately 57% of Nesco's outstanding stock, following an additional equity investment of up to $200 million from Platinum.
finance.yahoo.com
www.marketwatch.com

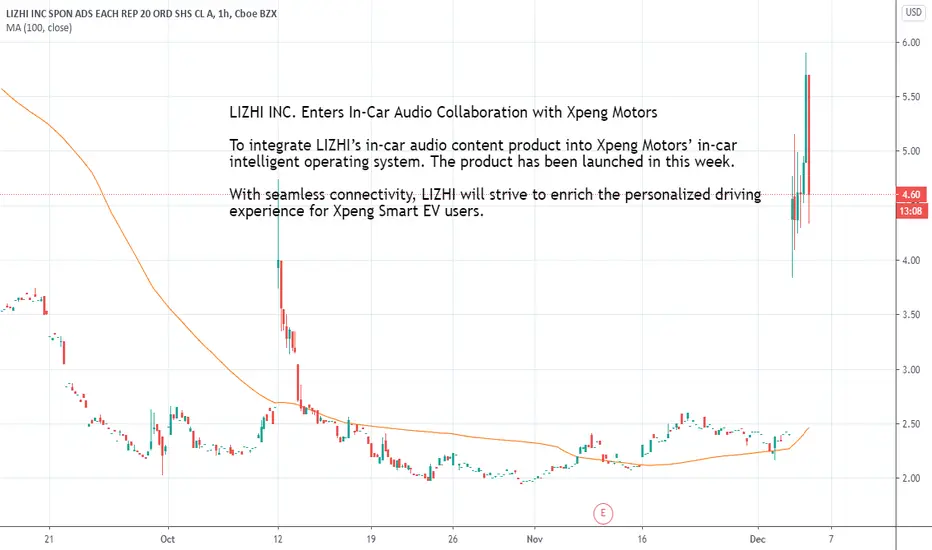
LIZI stock soars after Car Audio Collaboration with Xpeng MotorsLIZHI INC. Enters In-Car Audio Collaboration with Xpeng Motors
To integrate LIZHI’s in-car audio content product into Xpeng Motors’ in-car intelligent operating system. The product has been launched in this week.
With seamless connectivity, LIZHI will strive to enrich the personalized driving experience for Xpeng Smart EV users.
finance.yahoo.com
Tredegar Board Declares Special Dividend of $5.97 Per ShareTredegar Board Declares Special Dividend of $5.97 Per Share
The Special Dividend is payable on December 18, 2020 to shareholders of record at the close of business on December 11, 2020.
The Special Dividend is a direct result of our strong cash generation that resulted in cash in excess of debt of $28 million at September 30, 2020, which increased further at the end of October with the closing on the sale of our Personal Care business for estimated net proceeds (after transaction costs, purchase price adjustments and transition services) of $45 to $50 million.
the distribution of excess cash is being supplemented by borrowings under our revolving credit facility, which has a maturity date in June 2024, thereby allowing us to prudently use financial leverage in a low interest rate environment while also preserving available capital to meet the needs of our business units."
finance.yahoo.com


How To Place A Wheel TradeI’m Markus Heitkoetter and I’ve been an active trader for over 20 years.
I often see people who start trading and expect their accounts to explode, based on promises and hype they see in ads and e-mails.
They start trading and realize it doesn’t work this way.
The purpose of these articles is to show you the trading strategies and tools that I personally use to trade my own account so that you can grow your own account systematically.
Real money…real trades.
All right, so how exactly do you place a trade for The Wheel? Well if you have been following me for a while, then you know that I love trading two strategies.
The first strategy I trade with is The PowerX strategy and it’s my bread and butter strategy.
The second strategy I love trading is The Wheel strategy and this strategy has a very high winning percentage.
In fact, I’ve been trading it publicly live on my YouTube channel over the past few months, and thus far, knock on wood, I have a 100% winning percentage.
Having a trading strategy is key, but how do you actually place a trade? In this article, I will show what steps you need to take, from what type of account you need, to how exactly to place the trade.
I’ll show you these steps using two popular brokers, first on tastyworks, and then on Interactive Brokers because I know that many international traders use this platform.
Getting The Right Trading Permissions
Firstly, you can trade The Wheel in any account you want, even in a retirement account. You just need to make sure you have the right options for trading permissions.
When it comes to options trading there are four levels. On any account opening form they ask you, as any broker would,
“What type of activity do you plan to conduct in your options account?”
It doesn’t matter whether it is a cash account, a margin account, or a retirement account, all you need for trading The Wheel strategy is the lowest permission possible which is Tier 1.
With Tier 1, you can write and sell covered calls, as well as writing and selling cash-secured puts. This is exactly what we are doing with The Wheel strategy.
So this is step number one because if you don’t have these permissions, there’s not a whole lot that you can do.
Contact your broker and make sure that you have Tier 1 options permissions, which again, are writing covered calls and cash-secured puts.
If you have a higher Tier, like Tier 2 or 3, that’s okay, because Tier 1 is included in the higher Tiers.
The 4 Things You Need To Know
Before placing a trade, there are the first four things that you need to know:
What type of option are you trading? Are you trading a call or a put?
You need to know what is the expiration of the option.
What is the strike price?
What’s the minimum premium that we want to get in this trade when trading The Wheel strategy?
For those who may not be aware, when I take a trade I send out an alert notifying those who opt into our Power Income Alerts feature. I recently sent an alert out for a trade with WYNN that I recently took.
According to this alert, the idea is we believed that WYNN would stay above 70 by October 30th, but if it is less than $70, we would be assigned shares, then sell calls against the position.
The alert contained the four things needed to know in order to place the trade. It had the strike price, the expiration, and the credit that we wanted to achieve.
With this information from this alert, I’m now going to explain to you how would enter this trade in tastyworks, and then I will explain to you how exactly you do this on Interactive Brokers as well.
How To Enter A Trade In Tastyworks
Once you bring up the tastyworks platform, the first thing that you need to do is enter the symbol.
In the upper-left-hand side, we would enter WYNN because this is the stock that the alert went out for, so we type in W-Y-N-N.
Now, the second thing is, as soon as we bring it up, you click on the “TRADE” on the left-hand side.
After you click the “TRADE” tab, you have to select the expiration from the list that populates.
According to the alert, the expiration we are looking for is October 30th so this is the expiration we would select.
Now you’ll see all the calls on the left-hand side and all the puts on the right-hand side.
You just click on the bid price, and after clicking, it’ll say “S1”.
So this means now that you are selling one contract.
Now, depending on your account size, you might want to sell more than one contract.
This is why the alert will tell you the buying power that you would need to trade one option if you want to trade it cash secured, which I highly recommend you do cash secured, and that would be $7,000 for each option that you want to trade.
So for me personally, in the account I was using, I wanted to trade three options so I adjusted the quantity until I saw three options.
So the next thing is that you need to specify is the minimum amount of premium that you want to achieve.
In the alert, I specified that you should receive at least $0.50 credit.
The bid/ask of this option right now is between $0.80 for the bid and $0.84 for the ask, and it makes sense to go with the mid-price which most brokers suggest.
Now click on “REVIEW AND SEND”, and then you have the opportunity to quickly reviewing your order.
So now we have three WYNN options here that we are selling (-3), with an expiration of October 30th, and a strike price of 70.
You’ll see a P which stands for “put,” and STO means “sell to open.”
The limit order I used to sell it was at $0.82.
Now $0.82 is above the $0.50 credit that I suggested that you get at a minimum in the alert, so if you are able to get more than the minimum, good, do it.
There are estimated commissions and fees, and then you just have to hit “SEND ORDER” and the order gets placed.
You now just have to wait to get filled. If you’re not getting filled right away, you can adjust your bid and ask, so instead of going for $0.82, you can then try lowering your bid to see if you get filled.
As you can see, it’s very simple, and next, I want to show you also exactly how to do this on Interactive Brokers, and it’s just as easy.
How To Enter A Trade In Interactive Brokers
All right, so let’s go over how to place a trade with the Interactive Brokers platform.
Now I will be using the information from the same alert we used when placing the tastyworks trade.
This platform looks slightly different, but the functionality is always relatively the same.
There will be a place where you can enter the symbol, so we are typing in WYNN as the symbol in the upper left.
As soon as we hit Enter, it will ask us if we want to trade stocks, or do we want to trade options, so of course, we pick “options.”
This will bring up the options chain.
An alternative way to bring up the options chain is to click “New Window” above the field where you input the stock ticker and click “OptionTrader” to bring up the options chain.
I will look almost similar to how it looks on tastyworks.
So here again, we enter, simply W-Y-N-N and now we need to pick the expiration.
The expiration going back to the alert is October 30th and a strike price of 70.
Just like we did in tastyworks, after selecting the strike price of 70, we click on the bid.
Once we click on the bid, it will bring up the order at the top.
It asks for a limit order, and we can also adjust the number of contracts.
So instead of trading one contract, we can trade three contracts.
We can also adjust the limit order to 82, as we had with tastyworks.
When we’re done, all we need to do right now is hit the T for Transmit.
Summary
As you can see, there are differences between these packages.
I personally use Interactive Brokers a lot, and it is very popular with international traders.
I also use the tastyworks platform and find it a little bit easier to use.
Now you know how to place a trade according to the Wheel, using tastyworks and Interactive Brokers.
Other brokers, other than these two, will be very, very similar.
After reading this article, you now know what type of account you need for trading The Wheel Strategy, and you can use a cash account, a retirement account, or a margin.
It doesn’t matter as long as you have Tier 1 options permissions meaning you can write/sell covered calls, and cash-secured puts.
Within the platform, all you need to do is input whether you’re trading a call or put, the expiration, strike price, and what’s the minimum premium that you want to collect. It really is that easy.

The power of this Strategy for long term stocks investingHello Traders
Hope you are all enjoying the weekend.
I just wanted to share a series a stocks trades I am reviewing which have proved to be successful by using the trend based strategy software I use.
The strategy in use I am utilizing mainly on Forex pairs but can be used on stocks as well as indices and crypto.
The example you see here is working the one week time frame on Tesla stock.
Now as we all this stock has climbed and climbed this year but the trend strategy in use picked the potential upward trend as early as last year and presented a buy signal. The stock has gone on to grow 700%.
This could be a very valuable tool for long term stock trading, stock picking and for growing portfolios.
For any more information on the strategy I am using please feel free to message me.

XL Fleet Expects its Largest Partner to Double Orders in 2021XL Fleet Expects its Largest Partner to Double Orders in 2021
Farmbro Inc. (“Farmbro”), an Ontario-based upfitting solutions service provider specializing in commercial and work vehicles, expects to double its sales volume from approximately 1,000 XL unit installations in 2020 to over 2,000 in 2021 to meet the increasing demand for fleet electrification in Canada. As part of its expanding partnership, XL Fleet is recognizing Farmbro as its Sales and Installation Partner of the Year for 2020.
Farmbro is a member of XL’s Sales and Installation Partner network, the Company’s comprehensive go-to-market channel for selling and installing the thousands of electrification systems it has deployed in fleet vehicles throughout North America.
“Farmbro has been an exceptional partner for XL Fleet, as we have greatly expanded our reach into the Canadian fleet market over the past 18 months,”
“Demand in Canada for vehicle electrification has skyrocketed in recent years as both government and corporate initiatives on carbon reduction have become a priority for fleets,”
www.xlfleet.com

XL Fleet Expands XLP™ Plug-in Hybrid Electric Drive SystemXL Fleet Expands XLP™ Plug-in Hybrid Electric Drive System For Use in Multiple GM Fleet Applications
The platform is expected to begin shipping on select configurations of the Chevrolet and GMC Silverado / Sierra 2500 HD and 3500 HD pickup trucks in the first quarter of 2021, and on Chevrolet and GMC 3500 and 4500 cutaway chassis in the second quarter of 2021.
The Company’s newest product offering expands its growing lineup of plug-in hybrid electric drive systems, which can improve fuel economy by increasing miles per gallon by up to 50% and reducing CO2 emissions by approximately one-third compared to traditional gas-powered vehicles.
XL’s ability to electrify a wide range of commercial applications from the world’s leading vehicle manufacturers allows us to immediately serve this market with proven, high performance vehicles that are already designed and specified for the rigorous duty cycles of fleets."
By leveraging our experience with over 200 customers and utilizing proprietary data from nearly 140 million customer miles driven, we are uniquely positioned to quickly and efficiently develop solutions for applications with significant demand
XL remains on track to complete its previously announced merger agreement with Pivotal Investment Corporation II (NYSE: PIC), a publicly traded special purpose acquisition company, in the fourth quarter of 2020. Upon closing, the combined company will be named XL Fleet Corp. and is expected to remain listed on the New York Stock Exchange under a new ticker symbol, "XL".
finance.yahoo.com

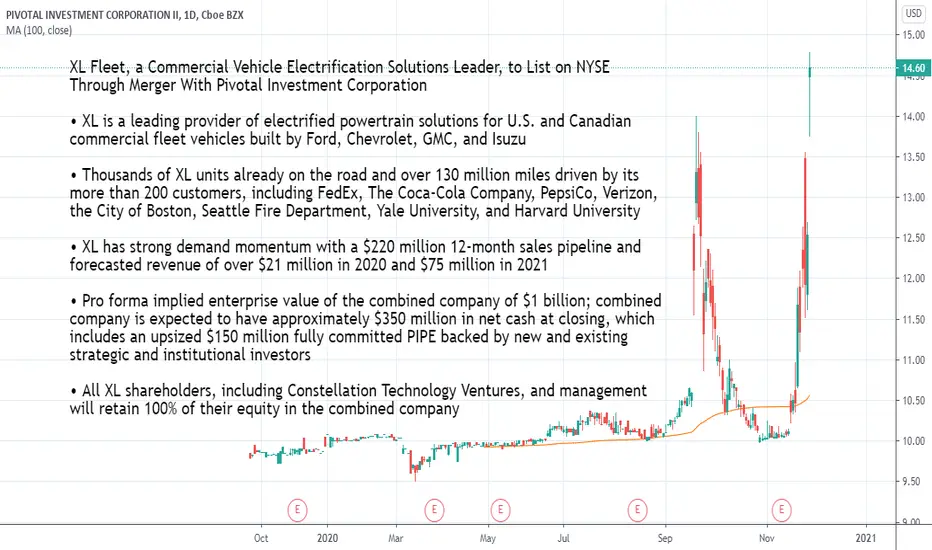
XL Fleet to List on NYSE Through Merger With Pivotal InvestmentXL Fleet, a Commercial Vehicle Electrification Solutions Leader, to List on NYSE Through Merger With Pivotal Investment Corporation
• XL is a leading provider of electrified powertrain solutions for U.S. and Canadian commercial fleet vehicles built by Ford, Chevrolet, GMC, and Isuzu
• Thousands of XL units already on the road and over 130 million miles driven by its more than 200 customers, including FedEx, The Coca-Cola Company, PepsiCo, Verizon, the City of Boston, Seattle Fire Department, Yale University, and Harvard University
• XL has strong demand momentum with a $220 million 12-month sales pipeline and forecasted revenue of over $21 million in 2020 and $75 million in 2021
• Pro forma implied enterprise value of the combined company of $1 billion; combined company is expected to have approximately $350 million in net cash at closing, which includes an upsized $150 million fully committed PIPE backed by new and existing strategic and institutional investors
• All XL shareholders, including Constellation Technology Ventures, and management will retain 100% of their equity in the combined company
• Upon closing, the combined company will be named XL Fleet and is expected to remain listed on the New York Stock Exchange under a new ticker symbol, "XL", with an anticipated implied enterprise value of approximately $1 billion and no material debt expected to be outstanding.
• The Company’s rapidly deployable technology solutions position it for long-term growth in a total addressable market that is greater than $1 trillion, which incorporates the money spent on energy consumption and vehicle costs for commercial fleets globally.
• XL’s revenues are expected to more than triple in 2021, cementing its status as the leading provider of vehicle electrification solutions for commercial and municipal fleet vehicles."
• Pivotal and XL Boards of Directors have unanimously approved the proposed merger and the related transactions, which are expected to be completed in the fourth quarter of 2020, subject to, among other things, the approval by Pivotal’s and XL’s stockholders of the proposed merger and satisfaction or waiver of other customary closing conditions.
finance.yahoo.com
Momentus to Become Public Through Merger With SRACMomentus to Become Public Through Merger With Stable Road Acquisition Corp.
Merger to create the first publicly traded space infrastructure company at the forefront of the new space economy
Momentus partners and customers include SpaceX, Lockheed Martin, and NASA
Combined company will have an estimated enterprise value of approximately $1.2 billion and will become listed on Nasdaq under the ticker symbol "MNTS" following expected transaction close in early 2021
Pro forma for the transaction, Momentus will have approximately $310 million in cash on the balance sheet, to be funded by Stable Road’s $172.5 million of cash held in trust (assuming no redemptions) and $175.0 million from a fully committed common stock PIPE at $10.00 per share, including investments from private equity growth investors, family offices and select top tier public institutional investors
The current size of the global space economy is expected to grow from an estimated $415 billion to $1.4 trillion by 2030 driving demand for transportation and infrastructure services in space.
finance.yahoo.com
