S&P Analysis Week of 9/13 - Neutral BearishI like to keep my analysis as simple as possible and call out high probability trades, even if they do not develop for days or weeks. This helps with taking emotion and FOMO out of trades in the stock market.
My preferred would be short trade with a breakdown of support at 3335, and retest and resumption down (lower low).
The long trade would be a break above 3500, a retest and resumption up (higher high). My bias is that this is unlikely as of today. However I will take this long trade if it develops. The stock market is unpredictable.
The price in between these two price areas are risky and I would consider that no man's land.
My method uses areas of support, resistance and trend lines. Simple and easy to follow which result in high-probability trades. I try to use minimum indicators and avoid complicated signals or patterns (i.e. Elliot Wave Theory). KISS (keep it simple silly) method.
Stockmarkets

#NASDAQ - Too good to be true?What a show, Nasdaq 100 lost almost 11% in a single week after a massive sell-off and everyone started to blame Robinhood for selling data, despite forecasts and warns of hundreds of analysts saying that the bubble will soon blow and all the tech stocks are overvalued, so.... Greed is one to blame?
This is just my opinion, you decide whether to agree or not.
From the technical perspective NDX is currently testing a dynamic resistance (dashed line) though remains above the 11300 support zone.
If it takes out the dynamic resistance with a massive green candle, then it will bounce to 12000.
If it breaks below the 11300, then it will drop to 11150 - 11098 in short term.
The best scenario is to drop down to 10400 levels to penetrate the 100MA and then bounce back towards new highs.
If Rumors on Robinhood continue growing and investigations are conducted, then we might witness the largest bubble explosion in the history.

New stimulus package? DOWEveryone is expecting a crash, dow touched perfectly the 0.618 fib, will it bounce?

Possible 20% Return on TQQQTQQQ has been on a strong upward trend follow the 180 day EMA. Last week had a significant drop but closed above the 180 day EMA. Great possible buy opportunity for a potential 20% return.

apple trend and fundamental analysishello , my new opinion about apple stock :
apple stock split 4-1 couple days ago ,after that Fear arose in the market called tech bubble , This caused the shares of the big company like apple and Tesla began to decrease , After this fear swept the entire market It caused widespread sales in the market ,
but let's talk about apple , apple is biggest company in the world with 2 trillion market cap , we can't expect any bad thing happen to stock price ,
beside new iphone will come out soon ( middle of the autumn ) , 4 or 5 new 5G iphone , This can throw Apple stock up .
hope it was useful

Buy Amazon 5-8-2020Amazon stock is moving in a short-term bullish direction
Bounce back above MA 13
Increase in trading volumes
So we can buy
Stop losses 2892
Target 3529

Buy Google 7/8/2020Google share is moving in a short-term upward trend
It was able to rebound from the 34 EMA upwards
So we can buy
1668 targeted
Stop the loss of 1450

$QQQ This baby is about to pop!! $QQQ is at the top of the channel! Looking for a pull back to 21dma

Buy Microsoft 13/8/2020 Microsoft share is moving in a short-term bullish trend
Rebounded from 34 SMA
So you can buy
Target 230.75
Stop Losses 197.5

Buy Facebook 16/8/2020Facebook share is moving in a short-term upward trend
Prices are testing moving average 13
Trading volumes increase with the increase in prices and decrease with the decrease in prices
So you can buy
Targeted 291
Stop Losses 247

WALT DISNEY Swing oppurtinity DIS stock face a new swing opportunity in its level. The stock has a gap that not filled that created with high volume. The stock also in its contraction of volatility phase since its hit a resistance two time with each one of them its create a higher support. There is a good probability that the stock will break this resistance and move higher until it reach 153.5 $. Especially with S&P 500 index moving higher. So the trading opportunity can be described as following:
1- Buying Now with market price which is almost 132 $.
2- Stop loss can be put at the start of gap price which is 122.8 $
3- Taking profit can be either at 153.4 , or trader can protect her profit once price reached 153 $ and keep the stock move in higher levels.
Good luck.

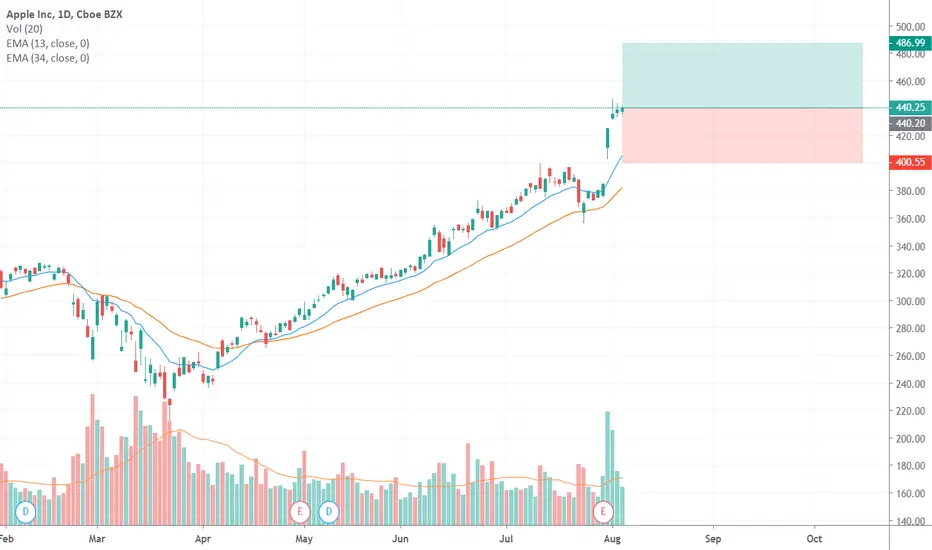
Buy Apple 6-8-2020Apple's stock is moving in a short-term bullish direction
and able to achieve new higher prices with high volumes
So we can buy
Target 487
Stop 400 losses


Not even worth comparing with traditional stock marketSome of the most popular crypto coins have performed way above traditional stock market. The return on these high popular coin have been over 200% YTD in some case.

WDC - This is the moment With RSI 30 (oversold) and the support level at 35.50
I think this is good opportunity to buy.

Doom aheadS&P is painting a bleak picture imo looks to me to have the same setup as the last doomsday device and this one could for sure be a lot worse 🍿🍿

NIKOLA - Short As Soon As Possible. The last analysis I did for Nikola was 2 weeks ago and I told you guys, if you want 20% profit buy Nikola and we saw it went up from 30 to $38. Now I think this is the moment to short because the next stop is 200D moving average (23) if the support level at 30 doesn't hold. GOOD LUCK

StockMarket Update : Bulls & Bears Battle is Raging !Hope this idea will inspire some of you !
Don't forget to hit the like/follow button if you feel like this post deserves it ;)
That's the best way to support me and help pushing this content to other users.
Kindly,
Phil

Gold to re-test all time highsWith the uncertainty of the economy due to the covid-19 pandemic, #gold should keep rising and at least test it's all time highs.

Technical view of 3MHello every one
3M stock is moving in a short-term bullish direction.
Continued respect for the uptrend line leads to 182 levels.
Negativity by breaking 156 down.
Good luck .

Technical view of PfizerPfizer’s stock is moving in a short-term sideway direction.
Between levels 41 and 31.5
With high volumes.
Therefore it is possible to trade between the two levels.

StockMarket Update : Major Top or just a S-Term Pullback ?Hope this idea will inspire some of you !
Don't forget to hit the like/follow button if you feel like this post deserves it ;)
That's the best way to support me and help pushing this content to other users.
Kindly,
Phil
