Stockmarkets

$SH Short $SPYAMEX:SH Short AMEX:SPY taking some profits here or buying some protection is a prudent idea with a earnings and the federal reserve meeting coming. Double bottom for AMEX:SH

Tesla's Q2 2023:Accelerating into the Future with Record RevenueIn the recently released Q2 2023 earnings report, Tesla Inc. presented a record quarter on multiple fronts, showcasing its resilience and innovation in a challenging macroeconomic environment. The electric vehicle and clean energy company reported a 9.6% operating margin, GAAP operating income of $2.4 billion, GAAP net income of $2.7 billion, and non-GAAP net income of $3.1 billion.
Despite price reductions in Q1 and early Q2, Tesla's operating margin remained robust, reflecting the company's ongoing cost reduction efforts, successful production ramp-ups in Berlin and Texas, and strong performance in the Energy and Services & Other sectors. The company's cash and investments increased by $0.7 billion in Q2, reaching a total of $23.1 billion.
Tesla's Cybertruck factory tooling is progressing as planned, with the company currently producing RC (release candidates) builds. The Model Y, one of Tesla's most popular models, became the best-selling vehicle globally in Q1, demonstrating the company's growing market dominance.
The company's total automotive revenues reached $21,268 million, marking a year-over-year (YoY) increase of 46%. The Energy generation and storage sector also saw significant growth, with revenues of $1,509 million, a YoY increase of 74%. Services and other revenue rose by 47% YoY to $2,150 million. Overall, Tesla's total revenues for Q2 2023 were $24,927 million, a 47% YoY increase.
In terms of production, Tesla manufactured 19,489 Model S/X vehicles and 460,211 Model 3/Y vehicles in Q2 2023, representing YoY increases of 19% and 90% respectively. The total deliveries of Model S/X were 19,225, a YoY increase of 19%. The total deliveries of Model 3/Y were 446,915, a YoY increase of 87%.
Tesla's installed annual vehicle capacity continues to expand. In California, the capacity for Model S/X is 100,000, and for Model 3/Y it's 550,000. In Shanghai, the capacity for Model 3/Y is over 750,000. In Berlin, the capacity for Model Y is 375,000. In Texas, the capacity for Model Y is over 250,000.
The company also highlighted its commitment to AI development, with the production of Dojo training computers commencing. This development is expected to satisfy Tesla's immense neural net training needs using in-house designed Dojo hardware, which will enable faster and cheaper neural net training.
For new Model 3 or Y customers, Tesla launched the "Get To Know Your Tesla" experience. This initiative allows users to adjust their seats, mirrors, and steering wheel, set up the phone key, and learn about topics such as regenerative braking.
In conclusion , Tesla's Q2 2023 shareholder deck paints a picture of a company that continues to innovate and grow despite external challenges. With a focus on cost reduction, new product development, investments in R&D, continuous product improvement, and the generation of free cash flow, Tesla is well-positioned for long-term success.
Read more in the comment section...

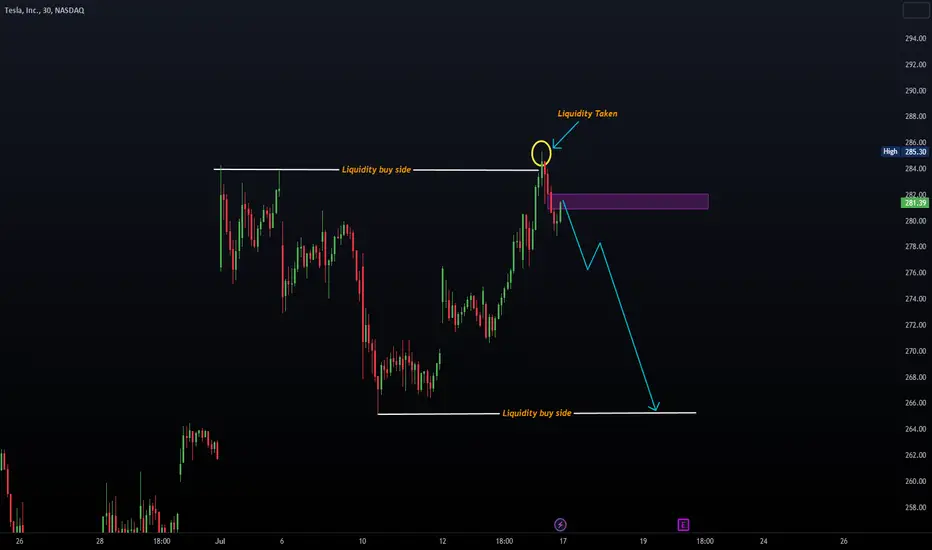
TESLA TRADEAtfer taken liquidity of buyside we will see a distrubution to wards sell side liquidity . FVG '' Fare Value Gap '' can be considered as an entry point .
AMD -> New Major Bullish CycleHello Traders and Investors ,
my name is Philip and today I will provide a free and educational multi-timeframe technical analysis of AMD 💪
As you can see on the monthly timeframe AMD stock perfectly retested the 0.618 fibonacci retracement level of the previous bullish cycle and already started a quite nice rejection.
On the weekly timeframe you can see that AMD retested the 50% fibonacci level and also filled the gap which was created a couple of weeks ago so everything is pointing towards more bullish growth.
Finally I am waiting for an entry signal on the daily timeframe - specifically AMD breaking above the current resistance at the $115 area and then I also do expect another daily push higher.
Keep in mind: Don't get caught up in short term moves and always look at the long term picture; building wealth is a marathon and not a quick sprint 📈
Thank you for watching and I will see you tomorrow!
My previous analysis of this asset:

If we confirm this breakout then....Traders,
A confirmation of this breakout on the daily will lead me to believe we are going to 461 at least and maybe further up to 469? See my latest post on the dollar's trajectory for more (in related links).
Stew

ES Futures Primary AnalysisI'll keep this brief.
The area on the chart where purple 5 resides best counts as a 3-wave structure. Therefore, in my primary analysis, I am counting this as an irregular b wave that made a slightly higher high and now we should be heading into the 4370 area for our black c wave of 4. I have a purple alternative 5 on the chart because there is a chance of wave 5 truncation...but that is only confirmed with a breach of 4260. If my primary analysis is correct, our black wave 5 should conclude in the area of 4519-4530.
Therefore we await more price action.
Best to all,
Chris

MACRO UPDATE - History is no longer reality since debasement
Take some time to focus on the information and macro movement here and compare it with my notes.
Why are leading economists and leading institutions fumbling? imagine comparing history prior to 2008 where Quantitative Easing did not exist.
No standard macro indicator will be accurate due to the debasement of money that happen during the GFC, compare the SPY to money supply we see that we barely have reached post 2001 levels, 2007 highs.
Jerome Powell will not admit this because the system has basically been debased hence the over compensation for rate rises why did he do it? because the debt situation is worse than it seems.
This is a very unique situation where retail is still majority short on options/futures while money market funds are still in trillions of cash. If this does play out and you're an institution do you wait for the final bubble to melt up? or do you allocate now and try to capitalize or risk missing the market, either way, something interesting is about to happen.
Reminder NO economic indicator can be trusted prior to 2008, its like using map plans for Atlantis you will quickly find out all your indicators are defected.
T10Y2 | Is the indicator the federal reserve uses to find recessions.
USM2 | M2 US money supply
USINTR | USA Interest Rates
WALCL | Federal Reserve balance sheet
SPY/M2SL | SPY adjusted for the debasement
Blue line | Global (major) central bank balances

Tesla -> EV Market On FireHello Traders and Investors ,
my name is Philip and today I will provide a free and educational multi-timeframe technical analysis of Tesla 💪
After Tesla stock retested the last strong support zone for bulls, the 0.786 fibonacci level at the $100 level, the recent pump over the past couple of weeks was no surprise at all.
On the weekly timeframe you can see that Tesla stock is currently retesting previous weekly structure and since Tesla is a little bit overextended we could see a short term drop from here.
However by looking at the daily timeframe you can also see that Tesla stock is not slowing down at all so not all three timeframes are pointing towards more growth yet so I am waiting for a daily and weekly break above the current resistance level and then I do expect more bullish upside.
Keep in mind: Don't get caught up in short term moves and always look at the long term picture; building wealth is a marathon and not a quick sprint 📈
Thank you for watching and I will see you tomorrow!
My previous analysis of this asset:

+22% in profit on $MARA , next $19+22% in profit on NASDAQ:MARA , next $19
Wonderful, great setup... I'm looking for $19 to sell my second position half.
Thanks,

Get ReadyBayanat is now looking very bullish, support is confirmed today with good volumes. I want to see tomorrow a small gap up opening and its ready to fly. Overall its a bullish stock now go for it.
Hit like & follow guys;)

Nifty50 Hit New All Time HighAmidst global recession fears, India's NIFTY50 smashes through All-Time High at 19000 level!
While the world grapples with economic challenges, India's flagship index defies the odds, showcasing resilience and growth.

Sanofi India LtdCMP 6930
MACD Turn Positive After 27 bars or 822 days
Resistance At 7000-7500
waiting for Monthly Closing Above 7000 with good volume

Harnessing the AI Revolution: A Powerful Surge with NVIDIA, GoogThe future is now, and it's coded in the language of Artificial Intelligence. As investors, we have a unique opportunity to be part of this game-changing journey. My personal story began with NVIDIA, an industry leader in AI and graphics processing. Acquiring NVIDIA shares two months ago was akin to boarding a spacecraft destined for new frontiers. The ride has been exceptional, with returns exceeding my expectations.
But, the vast landscape of AI is not limited to one planet. There's a whole universe to explore, and I decided to broaden my horizons. Hence, I ventured further, incorporating three other stellar entities into my portfolio - Google, Microsoft, and IBM. These industry titans are carving their paths, harnessing AI to innovate, and influencing global trends.
My portfolio is not just an investment; it's a belief in a future shaped by AI, a testament to a revolution unfolding right before our eyes. Join me in this journey, as I share my insights, strategies, and perspectives on navigating these high-tech tides. Together, we can capitalize on the industry that is relentlessly and rapidly shaping our tomorrow. Remember, the revolution might be digitized, but the rewards are very real.

Is the Worst OVER? This is the differential of 10yr vs 1yr US bond which represents long term against short term yield on sovereign debt, and those you don't know, short term bonds are used by central banks to control interest rates(amazing uh? the FED does not actually print money) therefore they do use bonds as a tool to control interest rates which then controls the S&D of capital.
As you can see, we are back at a differential which is extremely low, back to energy crisis levels. However, we seem to be already at very low levels, does that mean THE WORST HAS COME? What is going to happen to the stock market?
A very quick and personal thought to sum everything up as I do not consider myself an expert macroeconomist: the market is efficient, meaning that the current price on every single security is traded at all the current public information that is available and if something keeps going up, it means that expectation are in favor of it moving higher.
Hope that explains what I wanted to say,
Feel free to ask question, be safe!

Nifty50 Day End Analysis 2023.06.06NSE:NIFTY currently into iii (pink color) of 5 (orange color) of 5 (blue color) of 3 (gray color).
Wave ii (pink color) retraced wave i (pink color) by 61.8%.
As Nifty is currently into Wave iii (pink color), expecting Nifty to take out the trendline (purple color - from ATH to recent high) resistance around 18650 by providing a gap-up opening tomorrow above that level (this is because in 3rd waves, critical resistances are normally taken out by having a gap-up or gap-down opening).
Expecting Wave iii (pink color) to end around 18750 which is 161.8% extension of wave i (pink color).
View remains invalid if Nifty closes below 18560 on hourly candle.

S&P500 and US stock marketThe medium- and long-term forecast of a serious fall remains in force , but so far there is no confirmation of its beginning, we are focusing on the above levels. Technically, we can still show a small increase, fundamentally the situation is unstable and the fall can begin at any moment. There are serious problems in the banking sector , the prospects of a recession . In previous reviews, the inversion of the yield curve (US government bonds) was mentioned more than once, at the moment the situation is only getting worse. Sooner or later, it will begin to return to a "normal state", which will be the beginning of an sharp phase of the crisis.

ADANII POWER - WEEKLY TIME FRAMEThe Structure looks good to us, waiting for this instrument to correct and then give us these opportunities as shown on this instrument (Price Chart).
Note: Its my view only and its for educational purpose only. Only who has got knowledge about this strategy, will understand what to be done on this setup. its purely based on my technical analysis only (strategies). we don't focus on the short term moves, we look for only for Bullish or Bearish Impulsive moves on the setups after a good price action is formed as per the strategy. we never get into corrective moves. because it will test our patience and also it will be a bullish or a bearish trap. and try trade the big moves.
we do not get into bullish or bearish traps. We anticipate and get into only big bullish or bearish moves (Impulsive Moves). Just ride the Bullish or Bearish Impulsive Move. Learn & Know the Complete Market Cycle.
Buy Low and Sell High Concept. Buy at Cheaper Price and Sell at Expensive Price.
Keep it simple, keep it Unique.
please keep your comments useful & respectful.
Thanks for your support....
Tradelikemee Academy

Stock Market AnimalsThe stock market animals roam the financial landscape, representing optimism or pessimism. These animal metaphors capture the sentiment and beliefs behind the market participants who often try to outsmart each other through their edge in the market.
Here is a list of 7 most popular animal metaphors in the stock market. Maybe it can help some traders to look at themselves in the mirror.
🐮Bulls🐮
Its true that at some point everybody would have been a bull in the stock market but here we are talking about the hardcore bulls who are quintessential symbol of rising market. They never go short on the market and make money from the escalating prices of the stocks. This is because they are always overtly positive about the economy and the companies in which they invest. Undoubtedly, bulls are responsible for the buying pressure in the market.
🐻Bears🐻
Needless to say, bears are exactly the opposite of bulls. They never go long and make money from falling stock prices. Their pessimistic and cautionary view about the markets glue them to their short positions. Thus, bears keep on creating selling pressure in the markets.
🐕Wolf🐕
Wolves are neither bulls nor bears but at the same time they are the both. Wolves are shrewd animals who always seek profit making opportunities on both sides of the market. Due to their aggressive trading they quickly adapt to the changing market conditions. They are able to take advantage of momentum, volatility and short-term price discrepancies. They tend to quietly wait for opportunities rather than hopping on to them.
🐢Turtle🐢
Turtles by their very nature believe in slow money-making ideology. They are the most patient ones among all the other categories. Generally, they marry their investments with a longer-term perspective. They take stock splits, bonuses and pocket dividends to make money. Turtles are steady buyers as well as steady sellers.
🐰Rabbit🐰
Rabbits are the most popular trading creatures. They are Intraday hoppers who trade in both the directions. They may be bullish at 10am and bearish at 10:05am. They believe in small but quick money-making ideology. Characterized as least patient among all the other types of market participants, they are just the opposite of turtles. Generally, they are pushed by the market sentiment to take a large number of trades during the day. However, they square off all profit/loss making positions before market close. They don’t restraint themselves from using a whole lot of indicators and strategies to make buy and sell decisions. Unfortunately, most rabbits lose money in the market.
🐔Chicken🐔
They are risk-averse creatures who believe in preserving their capital. Market volatility and momentum are not their cup of tea. They invariably take small risk and make smaller money. A small price fluctuation, on either side, may throw them out of the trade.
🦈Shark🦈
Sharks are the market manipulators. With their exceptional potential to drive or hold the prices to certain levels, they look for opportunities to trap weak traders on the wrong side of the market and exploit their fear or greed. Trading pools, large traders and prop firms etc. fall into this category. What makes them different from the rest of the market participants is their access to more accurate market data and mammoth sized Gigabucks at their disposal.
I would not ask anybody's (predictable) type but would say that there is always room for improvement.
It just needs :
⚡Realization on your part to recognize yourself.
⚡Commitment to follow the discipline needed to transform yourself.
Anyways, which one do you like to become. Write in the comment section below.
Thanks for reading.
Do like for more educational stuff in future.
Disclaimer: These metaphors are not created by me but views are personal.

ADBE WCA - Ascending TriangleCompany: Adobe Inc.
Ticker: ADBE
Exchange: NASDAQ
Sector: Technology
Introduction:
Thank you for joining me for today's technical analysis. We will be examining Adobe Inc. (ADBE), a leading company in the Technology sector, listed on the NASDAQ. Our focus is on an Ascending Triangle pattern that has been developing on the weekly chart.
Ascending Triangle Pattern:
An Ascending Triangle pattern is often indicating a potential reversal or continuation of the trend. This pattern is formed when the price oscillates between a flat resistance line and an upward sloping support line.
Analysis:
In the case of Adobe, the previous trend was downward, as indicated by a blue diagonal resistance line. However, we are now witnessing the formation of an Ascending Triangle pattern, indicating a possible bottom reversal.
The horizontal resistance of the triangle is set at $397.36, with four touchpoints recorded. Meanwhile, the rising support line, which originates at $275.20, has also been touched four times. Notably, the current weekly candle (the third touch point) is making an attempt to break through the horizontal resistance line.
The 200 EMA closely aligns with the horizontal resistance, further underlining the significance of this level. A breakout – defined as a weekly candle closing above the horizontal resistance line – could present an excellent entry point for a long position.
If a breakout does occur, the price target would be approximately $524. This represents a potential gain of around 32%. Minor resistance could be encountered at 446,51.
Conclusion:
Adobe Inc.'s weekly chart paints an intriguing picture, with an Ascending Triangle indicating a potential bottom reversal. Traders should keep a keen eye on this setup, as a breakout could signal a strong buying opportunity.
Remember, this analysis does not serve as financial advice but a guiding point for your own research. Always consider your risk management strategies when trading.
If you found this analysis helpful, please like, share, and follow for more updates. Happy trading!
Best regards,
Karim Subhieh

Head and Shoulders Topping Formation on the Russell2000The recent failure of First Republic Bank highlights the problems facing the US banking system. These problems include the continued increase of delinquency rates on Credit cards, Commercial Real Estate & Automobiles, as well as a decrease of commercial bank deposits and M2 money supply (-4.2% YoY). These problems, among others, are causing banking institutions to rein in their lending to build reserves and take on debt from the FED & FHLBs to meet deposit withdrawals. This reduces the profitability of banks and restricts credit into the economy, which reduces economic activity as a whole. The economy had already begun slowing heavily before the credit crunch began in March 2023, but the current business cycle downturn, combined with 3 large regional bank failures and rising continuing jobless claims, portend a severe & lengthy economic contraction. The Conference Board Leading Economic Indicators registered a -7.2% YoY Contraction recently. Since 1968, Any Conference Board LEI contraction of more than -2% YoY has never yielded a false positive in regards to a coming recession.
Over 40% of Russell2000 companies are unprofitable and over 24% of S&P500 companies are zombie companies. Markets are still very overvalued within the context of a 5% Fed funds rate, contracting earnings, a credit crunch, and ongoing quantitative tightening by the FED. The markets have been seeing less buying volumes as well as carving out a head and shoulders top on the Russell2000. Other problems facing the banks include the popping auto & commercial real estate debt bubbles, as well as increasing large corporate bankruptcies (The most since 2010 thus far this year). The IPO market is the weakest it has been since 2009 (by total proceeds), which is also hurting Investment banking profits. I see the potential for 5%-10% possible upside and 35%-50% downside for the Russell2000 & S&P500 over the next 9 -18 months.
Thank you for reading,
Alexander C. Lambert

US500 - Bullish momentumThe S&P500 has broken the descending trendline and a strong resistance and continues to move towards higher resistance levels.
1D supports and resistances:
Good trading!
If you find it useful, like, follow, share!

NASDAQ - Bullish movement resumeThe price broke a strong trendline and a resistance and targeted the next significant resistance level, first the 127-138 level of Fibo and then the 13500 level.
1D:
Good trading!
If you find it useful, like, follow, share!
